Gaskets And Seals Market (2026 - 2035)

Gaskets and Seals Market Size, Share & Growth Analysis Report By Product (Seals (Shaft, Molded, and More), Gaskets (Metallic, Rubber, Cork, and More)), By Material (Metals, Rubber, Fiber, Graphite, Others (PTFE, Cork, Composites)), By Sales Channel (OEM, Aftermarket / MRO), By Application (Oil and Gas, Automotive OEM, Aerospace and Defense, Chemical Processing, Power Generation, Others (Marine, Mining, Pharma)) and By Regional (North America, Europe, South America, Asia Pacific, Middle East and Africa) – Industry Growth & Forecast to 2035
ID: MRFR/Equip/10107-HCR
128 Pages
Rashmi Phumatia
Last Updated: July 10, 2026
Gaskets And Seals Market
Market Size
Forecast Period2026-2035
CAGR (2026-2035)4.56%
2025 Market SizeUSD 82.12 Billion
2035 Market SizeUSD 137.48 Billion
Key Players
Freudenberg Sealing Technologies
Trelleborg AB
SKF Group
Parker Hannifin
EnPro Industries
Flowserve Corporation
Opportunities
  • Smart Gaskets and Sensor-Enabled Sealing Systems
  • Hydrogen-Economy Sealing Standards
  • Emerging-Market Refinery Build-Out

Gaskets And Seals Market Summary

The Gaskets and Seals Market stood at an estimated USD 82.12 billion in 2025 and is projected to reach USD 85.58 billion in 2026 before climbing to USD 137.48 billion by 2035, registering a CAGR of 4.56% during 2026–2035. Two catalysts anchor this trajectory: first, the global push to expand LNG regasification capacity — with over USD 45 billion committed to new terminals between 2024 and 2030 [2] — is driving demand for spiral wound gasket flange assemblies rated to cryogenic service; second, electric-vehicle battery enclosure programs now require PTFE gasket chemical resistance standards that did not exist five years ago, creating an entirely new replacement cycle for automakers and Tier-1 suppliers.

Legacy compressed-fiber and cork-based sealing products are giving way to engineered elastomers and metallic gasket ring joint configurations designed for hydrogen-blend pipelines and high-pressure fuel-cell stacks. The U.S. Department of Energy's Hydrogen Shot initiative targets USD 1/kg clean hydrogen by 2030 [3], and every new hydrogen pipeline segment demands O-ring sealing elastomer components certified to ISO 23936-2. Meanwhile, fire safe valve seal certifications under API 607 continue to tighten, forcing midstream operators to accelerate replacement schedules for gate and ball valve assemblies.

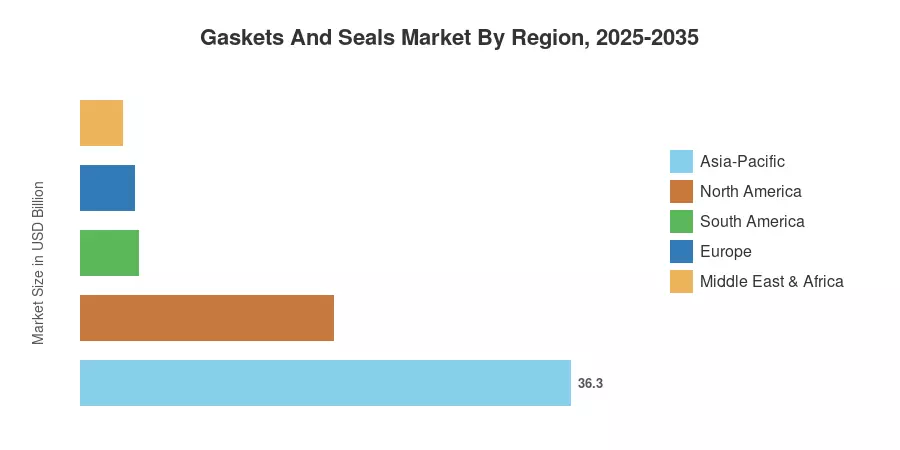
Asia-Pacific commands roughly 44.2% of global revenue, led by China's aggressive new-energy-vehicle build-out and India's refinery modernization push North America holds the second-largest share at approximately 22.8%, buoyed by wind-turbine repowering programs and shale-gas infrastructure maintenance. Europe follows closely, with its Green Deal Industrial Plan channeling investment into hydrogen-ready pipeline retrofits. The Gaskets and Seals Market is poised for sustained expansion as decarbonization mandates convert one-time capital projects into recurring seal-replacement revenue streams.


Key Report Takeaways

• By Product

  • Seals accounted for approximately 62.3% of the Gaskets and Seals Market revenue in 2025, driven by hydraulic cylinder rod seal applications in mobile equipment and industrial automation
  • Gaskets are forecast to grow at a 3.38% CAGR through 2035, with metallic gasket ring joint variants gaining share in LNG turnaround cycles

• By Material

  • Metals represented the leading material category in 2025, anchored by spiral wound gasket flange demand in petrochemical and power-generation facilities
  • Rubber compounds — including new fluoro-silicone and perfluoroelastomer grades — are expanding at the fastest pace, as automakers specify O-ring sealing elastomer solutions for battery thermal management

• By Sales Channel

  • OEM shipments constituted roughly 60.1% of the 2025 Gaskets and Seals Market turnover, reflecting strong original-equipment integration cycles
  • Aftermarket/MRO purchases will accelerate at a 5.34% CAGR as petrochemical operators extend asset life cycles beyond 30 years

• By Application

  • Oil and gas held approximately 42.1% of the 2025 value, underpinned by fire-safe valve seal mandates across upstream and midstream operations
  • Automotive OEM demand is advancing at the fastest rate through 2035, fueled by EV battery-enclosure sealing requirements and SAE J3277 compliance

• By Region

  • Asia-Pacific generated the largest share and is climbing at the quickest CAGR among all regions, led by China and India
  • North America benefits from hydrogen pilot lines and wind-turbine MRO spending


Gaskets and Seals Market Size and Forecast (2021–2035)

MRFR's proprietary estimation framework triangulates supply-side shipment data, downstream procurement records, and macroeconomic proxies (industrial production indices, refinery throughput, vehicle production volumes) to derive annual market-size estimates. Historical figures (2021–2024) rely on audited company filings and trade-association data; the base year (2025) reflects preliminary full-year estimates updated as of Q4 2025; and the forecast period (2026–2035) applies a calibrated compound growth model validated against bottom-up segment builds.
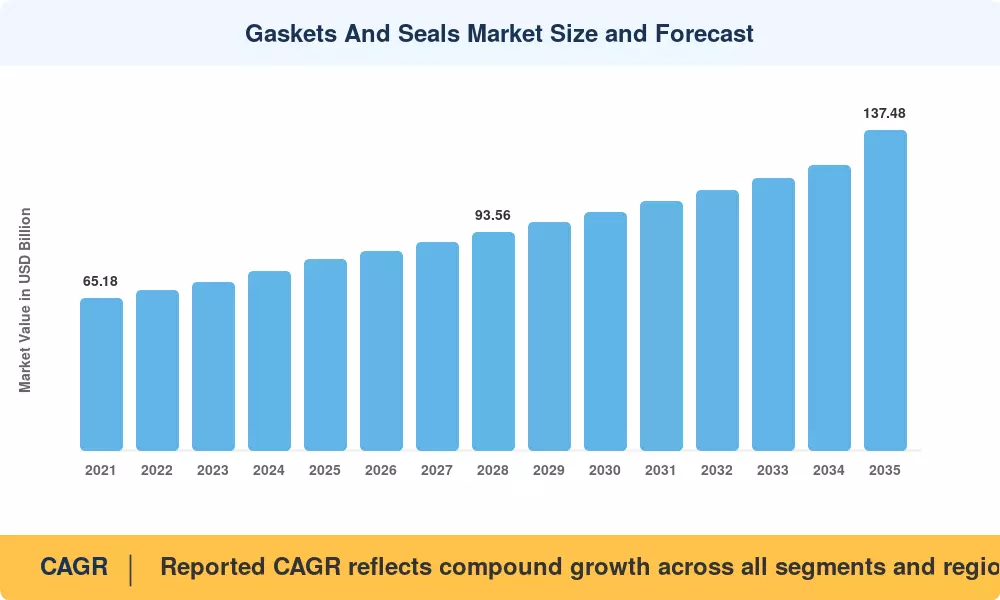
Gaskets And Seals Market Size and Forecast
Our Impact
Enabled $4.3B Revenue Impact for Fortune 500 and Leading Multinationals
Partnering with 2000+ Global Organizations Each Year
30K+ Citations by Top-Tier Firms in the Industry

Driver Impact Analysis

Driver ~% Impact on CAGR Geographic Relevance Impact Timeline
LNG capacity expansion and turnaround MRO +0.9% Middle East, N. America, APAC Short-term (≤2 yr)
EV battery-enclosure sealing mandates +0.8% Global Medium-term (2–4 yr)
Hydrogen-pipeline retrofit programs +0.6% Europe, N. America Long-term (≥4 yr)
Tightening fugitive-emission regulations +0.5% Europe, N. America Medium-term
Wind-turbine repowering and O&M cycles +0.4% N. America, Europe Short-term
Semiconductor fab cleanroom expansion +0.3% APAC, N. America Medium-term
Digital-twin predictive maintenance adoption +0.2% Global Long-term


LNG Capacity Expansion and Turnaround MRO

Global LNG liquefaction capacity is set to increase by over 250 MTPA between 2024 and 2030, according to the International Gas Union [2]. Every new LNG train requires thousands of spiral wound gasket flange sets rated for cryogenic temperatures below –162 °C, while scheduled turnarounds at existing facilities replace metallic gasket ring joint assemblies on a 4- to 6-year cycle. Qatar's North Field South expansion alone represents an estimated USD 1.2 billion in sealing-component procurement over its construction phase [2].

EV Battery-Enclosure Sealing Mandates

SAE International's J3277 standard now mandates fire-safe valve seal equivalency testing for battery-pack enclosure gaskets, requiring materials to withstand 1,000 °C flame impingement for at least five minutes [7]. This has pushed automakers toward PTFE gasket chemical resistance–rated compounds and custom-molded silicone seals, creating a USD 3.8 billion addressable opportunity within the broader Gaskets and Seals Market by 2030 [7]. China's GB/T 38031 battery-safety regulation mirrors these requirements, amplifying demand across Asia-Pacific.

Hydrogen-Pipeline Retrofit Programs

By 2040, the European Hydrogen Backbone project aims to build 53,000 km of hydrogen-ready pipes, of which about 60% will be converted from current natural gas lines [3]. O-ring sealing elastomer components certified to ISO 23936-2 for resistance to hydrogen embrittlement are required for retrofit projects. USD 7 billion has been distributed to seven hubs under the U.S. Department of Energy's Regional Clean Hydrogen Hubs initiative, each of which specifies hydrogen-grade sealing systems for infrastructure related to compression, storage, and distribution [3].


Fugitive-Emission Regulations

The EPA's updated OOOOb/c methane-emission rules require quarterly leak-detection-and-repair (LDAR) surveys at oil-and-gas facilities, penalizing operators USD 1,500 per metric ton of excess methane from 2026 [8]. Operators are proactively replacing aging gasket assemblies with low-emission packing and hydraulic cylinder rod seal upgrades to avoid penalty exposure. The Gaskets and Seals Market stands to benefit from this regulatory push as compliance deadlines approach.


Restraints Impact Analysis

Restraint impact percentages are directional, reflecting headwinds that slow but do not reverse growth. They are not subtracted directly from the headline CAGR.

Restraint ~% Impact on CAGR Geographic Relevance Impact Timeline
Raw-material price volatility (PTFE, nickel) –0.4% Global Short-term
Counterfeit and substandard seal imports –0.3% APAC, MEA Medium-term
Extended plant turnaround intervals –0.3% N. America, Europe Long-term
Skilled-labor shortages in precision machining –0.2% Europe, N. America Medium-term
Substitution risk from adhesive bonding technologies –0.1% Global Long-term


Raw-Material Price Volatility

Between Q1 2022 and Q3 2023, fluorspar supply interruptions in China and stricter PFAS restrictions in Europe caused a 38% increase in PTFE resin costs [12]. Over the same time period, spot prices for nickel, a crucial component of metallic gasket ring joint alloys, varied between USD 15,000 and USD 30,000 per tonne on the London Metal Exchange. In the gaskets and seals market, these fluctuations reduce manufacturer margins and give downstream purchasers concern about order timing.


Counterfeit and Substandard Seal Imports

According to the Fluid Sealing Association, 8–12% of aftermarket unit volumes in developing markets are made up of fake gaskets, which erodes consumer confidence in brands and poses a risk to safety [13]. Many refinery flange leaks in Southeast Asia have been connected to subpar O-ring sealing elastomer products that are not properly certified for Shore-A hardness. The price difference between certified and uncertified goods continues to entice consumers on a tight budget, and regulatory enforcement is still uneven.


Extended Plant Turnaround Intervals

Advances in predictive maintenance and corrosion-inhibitor technology are enabling refineries to push turnaround intervals from four years to six or even eight years. While this improves plant economics, it directly reduces the frequency of gasket and seal replacements — a headwind for aftermarket revenue in the Gaskets and Seals Market.


Gaskets And Seals Market Opportunities

Smart Gaskets and Sensor-Enabled Sealing Systems

Operators may now monitor fugitive emissions and bolt-load relaxation in real time thanks to embedded RFID and piezoelectric sensors, transforming a passive commodity into a data-rich service offering After implementing smart spiral wound gasket flange assemblies, early adopters of LNG report a 30% decrease in unscheduled shutdowns.


Hydrogen-Economy Sealing Standards

ISO 23936-2 certification for hydrogen service is still nascent, and fewer than 15 global manufacturers hold full compliance status [3]. First-movers that establish hydrogen-grade PTFE gasket chemical resistance portfolios can command premium pricing and lock in long-term supply agreements across the seven U.S. Regional Clean Hydrogen Hubs

Emerging-Market Refinery Build-Out

Sub-Saharan Africa and South Asia are adding over 4 million barrels per day of refining capacity by 2032, according to the IEA [17]. Each new refinery requires thousands of fire-safe valve seals and hydraulic cylinder rod seal assemblies, creating a greenfield procurement channel largely untapped by Western suppliers

Aftermarket-as-a-Service and Data Monetization

Major seal manufacturers are piloting subscription-based replacement programs tied to digital-twin analytics, where customers pay per operating hour rather than per unit This model stabilizes revenue, improves demand forecasting, and creates a recurring data stream that supports margin expansion in the Gaskets and Seals Market.

Semiconductor Fab Cleanroom Sealing

The CHIPS Act and similar programs in the EU, Japan, and South Korea are driving over USD 500 billion in fab investment through 2030 [10]. Ultra-clean O-ring sealing elastomer products rated for corrosive process gases (NF₃, Cl₂) represent a high-margin niche growing faster than the overall market


Gaskets And Seals Market Future Outlook

Digital Twins and Predictive Seal Replacement

Digital-twin platforms are enabling plant operators to model bolt-load degradation and elastomer aging in real time, shifting gasket replacement from calendar-based to condition-based scheduling. McKinsey estimates predictive maintenance can reduce unplanned downtime by 30–50% in process industries, which translates into more precise — though potentially lower-frequency — O-ring sealing elastomer procurement cycles. Smart gaskets embedded with piezoelectric sensors will become standard in critical LNG and hydrogen service by 2030.

Electrification Supercycle and Battery Sealing

The IEA projects global EV sales will surpass 45 million units annually by 2035 [17], and every battery pack demands multi-layer PTFE gasket chemical resistance–rated enclosure seals to prevent thermal runaway propagation. This supercycle is reshaping the Gaskets and Seals Market product mix, shifting revenue toward engineered elastomers and away from traditional metallic products. Suppliers investing in fluoro-rubber compounding capacity today will capture disproportionate share through the decade.

Hydrogen Infrastructure Scale-Up

Cumulative global investment in hydrogen infrastructure is forecast to exceed USD 600 billion by 2035, per IRENA [20]. Every compression station, electrolyzer skid, and storage vessel requires sealing products certified against hydrogen embrittlement. The Gaskets and Seals Market will see hydrogen-grade spiral wound gasket flange and hydraulic cylinder rod seal products grow at roughly double the overall market rate through the forecast period.

ESG Reporting and Fugitive-Emission Accountability

The EU's Corporate Sustainability Reporting Directive (CSRD) and SEC climate-disclosure rules are forcing industrial operators to quantify and report Scope 1 fugitive emissions from flanged connections [8]. This regulatory pressure converts fire safe valve seal and low-emission packing upgrades from discretionary maintenance into compliance-driven capital expenditure — a structural tailwind for the Gaskets and Seals Market through 2035.


Gaskets And Seals Market Segmentation

By Product

Segment Key Metric Primary Demand Driver
Seals (Shaft, Molded, and More) 62.3% of 2025 revenue Hydraulic cylinder rod seal demand in mobile equipment
Gaskets (Metallic, Rubber, Cork, and More) 3.38% CAGR (2026–2035) LNG turnarounds, hydrogen retrofits


Seals dominate the Gaskets and Seals Market by product, with shaft seals and molded seals serving critical functions in rotating equipment across oil-and-gas, automotive, and industrial-machinery applications. Hydraulic cylinder rod seal variants alone represent a multi-billion-dollar sub-segment, driven by construction-equipment fleet expansion in Asia-Pacific and mining-sector mechanization in South America. Gaskets — though smaller — are experiencing a material-grade upgrade cycle as spiral wound gasket flange assemblies transition from graphite-filled to PTFE-filled configurations for hydrogen and cryogenic service.

By Material

Segment Key Metric Primary Demand Driver
Metals 32.8% of 2025 revenue Metallic gasket ring joint for high-pressure flanges
Rubber 6.65% CAGR (2026–2035) Fluoro-silicone, perfluoroelastomer EV applications
Fiber USD 11.42 Billion (2025) General industrial compressed-fiber gaskets
Graphite 3.92% CAGR (2026–2035) High-temperature exhaust and steam service
Others (PTFE, Cork, Composites) USD 8.76 Billion (2025) PTFE gasket chemical resistance for chemical processing


Metals retain the largest material share in the Gaskets and Seals Market, anchored by metallic gasket ring joint demand in refinery and LNG turnarounds where pressure ratings exceed 2,500 psi. Rubber compounds are gaining ground rapidly as automakers adopt O-ring sealing elastomer solutions using next-generation fluoro-silicone and perfluoroelastomer grades that withstand battery-pack temperatures exceeding 200 °C while maintaining chemical resistance to electrolyte solvents.

By Sales Channel

Segment Key Metric Primary Demand Driver
OEM 60.1% of 2025 revenue Automotive and industrial original-equipment integration
Aftermarket / MRO 5.34% CAGR (2026–2035) Extended asset life cycles in petrochemical plants


By Application

Segment Key Metric Primary Demand Driver
Oil and Gas 42.1% of 2025 revenue Upstream and midstream fire safe valve seal mandates
Automotive OEM 7.35% CAGR (2026–2035) EV battery enclosure and powertrain sealing
Aerospace and Defense USD 5.18 Billion (2025) Engine nacelle and fuel-system sealing
Chemical Processing 4.28% CAGR (2026–2035) PTFE gasket chemical resistance requirements
Power Generation USD 4.67 Billion (2025) Turbine casing and HRSG sealing
Others (Marine, Mining, Pharma) 3.86% CAGR (2026–2035) Diversified industrial demand


Oil and gas remain the largest application within the Gaskets and Seals Market, driven by the sheer volume of flanged connections across upstream wellheads, midstream compressor stations, and downstream refinery units. Every fire safe valve seal replacement and hydraulic cylinder rod seal upgrade in this sector contributes directly to revenue. Automotive OEM demand is the fastest-growing segment, propelled by EV battery-pack sealing requirements and tightening SAE J3277 standards that mandate PTFE gasket chemical resistance testing for thermal-runaway barriers.


Regional Market Share Analysis

Region Key Metric Primary Investment Themes
Asia-Pacific 44.2% of 2025 revenue NEV production, refinery expansion, semiconductor fabs
North America 22.8% of 2025 revenue Hydrogen hubs, LNG export terminals, wind MRO
Europe 4.91% CAGR (2026–2035) Hydrogen backbone, fugitive-emission compliance
South America USD 4.28 Billion (2025) Pre-salt offshore, ethanol infrastructure
Middle East & Africa 3.82% CAGR (2026–2035) LNG mega-projects, refinery greenfield builds
Total USD 82.12 Billion (2025)

The Gaskets and Seals Market exhibits a concentrated regional hierarchy, with Asia-Pacific and North America accounting for roughly two-thirds of global value. Regional dynamics are shaped by industrial capex cycles, regulatory enforcement intensity, and the pace of energy-transition investments.


North America

Country Key Metric Key Driver
US 68.4% of regional revenue Hydrogen hubs, shale-gas MRO, CHIPS Act fabs
Canada 5.21% CAGR LNG Canada Phase 2, oil-sands turnarounds
Mexico USD 1.74 Billion (2025) Dos Bocas refinery, nearshoring wave


North America's Gaskets and Seals Market benefits from a convergence of hydrogen pilot investment, LNG export terminal construction along the Gulf Coast, and methane-penalty enforcement under EPA OOOOb/c rules [8]. The US alone accounts for over two-thirds of regional demand, with hydraulic cylinder rod seal procurement accelerating across Permian Basin operators, retrofitting aging wellhead assemblies. Canada's LNG Canada terminal and the Trans Mountain pipeline expansion are generating incremental spiral wound gasket flange orders through 2028.

Europe

Country Key Metric Key Driver
Germany 24.6% of regional revenue Hydrogen backbone, automotive OEM retooling
UK 4.78% CAGR Offshore wind O&M, North Sea decommissioning
France USD 2.14 Billion (2025) Nuclear fleet life extensions, hydrogen corridors
Italy 3.94% CAGR Refinery conversions to bio-feedstock
Spain USD 1.28 Billion (2025) Green-hydrogen export terminals
Nordic Countries 5.12% CAGR Offshore wind, battery gigafactory sealing
Russia USD 1.85 Billion (2025) Arctic LNG maintenance cycles
Rest of Europe 3.68% CAGR Diversified industrial MRO


Europe's Gaskets and Seals Market is propelled by the EU Green Deal Industrial Plan and its embedded hydrogen corridor mandates. Germany's decision to repurpose over 4,500 km of natural-gas pipelines for hydrogen blending by 2035 requires ISO 23936-certified metallic gasket ring joints and O-ring sealing elastomer replacements at every flange connection. The UK's offshore-wind installed base — set to triple by 2030 — drives recurring fire safe valve seal demand across subsea manifolds.

Asia-Pacific

Country Key Metric Key Driver
China 48.3% of regional revenue NEV production, petrochemical mega-complexes
India 6.84% CAGR Refinery modernization, city-gas distribution
Japan USD 4.52 Billion (2025) Hydrogen-society roadmap, semiconductor fabs
South Korea 5.47% CAGR Battery gigafactories, shipbuilding MRO
ASEAN USD 3.89 Billion (2025) Refinery expansion, palm-oil processing
Rest of Asia-Pacific 4.92% CAGR Mining, general industrial


Asia-Pacific dominates the Gaskets and Seals Market, with China's new-energy-vehicle output exceeding 12 million units in 2025 and each battery pack requiring precision PTFE gasket chemical resistance–rated seals [7]. India's ongoing refinery capacity additions — including the 60 MTPA Ratnagiri project — are generating large-scale spiral wound gasket flange procurement cycles. Japan's Green Transformation program allocates ¥20 trillion toward hydrogen and ammonia infrastructure, directly boosting demand for hydrogen-certified sealing products.

South America

Country Key Metric Key Driver
Brazil 61.8% of regional revenue Pre-salt FPSO fleet, ethanol biorefineries
Argentina 4.64% CAGR Vaca Muerta shale development
Rest of South America USD 0.72 Billion (2025) Mining, general industrial


Brazil's pre-salt deepwater FPSO fleet — the largest in the world — sustains steady demand for fire safe valve seal assemblies and hydraulic cylinder rod seal components rated for high-pressure subsea service. Argentina's Vaca Muerta shale play is attracting midstream pipeline investment that mirrors early Permian Basin sealing-procurement patterns.

Middle East & Africa

Country Key Metric Key Driver
Saudi Arabia 34.7% of regional revenue Vision 2030 refinery diversification
UAE 4.43% CAGR ADNOC gas-cap expansion, hydrogen pilots
South Africa USD 0.68 Billion (2025) Sasol CTL maintenance, mining
Egypt 4.18% CAGR East Mediterranean gas development
Rest of MEA USD 1.12 Billion (2025) Sub-Saharan refinery greenfield builds


Saudi Arabia's downstream diversification under Vision 2030 — including the Jafurah unconventional gas program — is generating multi-billion-dollar demand for metallic gasket ring joint and spiral wound gasket flange assemblies. The Gaskets and Seals Market in the UAE benefits from ADNOC's gas-cap development program and early-stage hydrogen pilot projects at Masdar City.


Gaskets And Seals Market By Region, 2025-2035

Competitive Benchmarking

The Gaskets and Seals Market exhibits medium concentration, with an estimated HHI below 800 and the top five players collectively holding 28–35% of global revenue. The competitive field ranges from diversified industrial conglomerates to specialized sealing-solution providers, with differentiation increasingly tied to material science capabilities, hydrogen-certification portfolios, and digital-service offerings.

Company Est. Revenue Share Range Key Offerings for Gaskets and Seals Market Strategic Positioning
Freudenberg Sealing Technologies ~5–8% O-ring sealing elastomer, hydraulic cylinder rod seal, battery seals Material-science leader in EV and hydrogen sealing
Trelleborg AB ~4–7% Polymer seals, PTFE gasket chemical resistance products Strong aerospace and automotive OEM footprint
SKF Group ~4–6% Shaft seals, bearing seals, and condition-monitoring solutions Integrated seal-plus-bearing systems approach
Parker Hannifin ~4–7% Spiral wound gasket flange, O-rings, hydraulic seals Broadest industrial-distribution network globally
EnPro Industries (Garlock) ~3–5% Metallic gasket ring joint, compressed-fiber gaskets Legacy leadership in refinery turnaround sealing
Flowserve Corporation ~3–5% Mechanical seals, fire safe valve seal products Pump-seal integration for process industries
Dana Incorporated ~2–4% Automotive OEM gaskets, thermal-management seals EV powertrain sealing specialization
John Crane (Smiths Group) ~3–5% Dry-gas seals, rotating-equipment sealing systems Dominant in upstream oil-and-gas compressor sealing
Tenneco Inc. ~2–4% Exhaust gaskets, powertrain sealing Aftermarket brand recognition (Federal-Mogul)
Klinger Group ~2–3% Metallic and semi-metallic gaskets, PTFE products Strong European process-industry presence


Recent News & Developments

  • Freudenberg Sealing Technologies (March 2025): Opened a USD 120 million fluoro-rubber compounding plant in Suzhou, China, expanding capacity for battery-enclosure O-ring sealing elastomer products by 40% [21].
  • Parker Hannifin (January 2025): Acquired a specialty PTFE gasket chemical resistance manufacturer in Texas, adding hydrogen-certified product lines to its spiral wound gasket flange portfolio [22].
  • Trelleborg AB (November 2024): Launched a sensor-embedded hydraulic cylinder rod seal series integrated with predictive-maintenance analytics platforms.
  • European Commission (September 2024): Published revised EN 13555 gasket testing standards incorporating hydrogen-blend service conditions, tightening fire safe valve seal certification requirements [8].
  • EnPro Industries (June 2024): Commissioned a metallic gasket ring joint production line in Deer Park, Texas, targeting LNG turnaround demand along the Gulf Coast.
  • SKF Group (March 2024): Partnered with a leading EV platform maker to co-develop integrated bearing-seal modules for next-generation electric drivetrains [23].
  • U.S. DOE (October 2023): Announced final selections for seven Regional Clean Hydrogen Hubs, collectively requiring over 200,000 hydrogen-grade sealing assemblies through 2030 [3].


Gaskets And Seals Market Report Scope

Parameter Detail
Market Scope Global Gaskets and Seals Market — products, materials, channels, applications, regions
Study Period 2021–2035
CAGR 4.56% (2026–2035)
Market Size (2025) USD 82.12 Billion
Market Size (2035) USD 137.48 Billion
Fastest Growing Segment Automotive OEM (by application); Rubber (by material)
Companies Profiled 10 (see Section 10)
Valuation Currency USD Billion
Methodology Bottom-up segment build validated by top-down macro indicators; primary interviews with OEM procurement heads and MRO distributors; secondary data from IEA, DOE, IOGP, OICA, trade associations
CAGR Driver Disclaimer Reported CAGR reflects compound growth across all segments and regions; individual segment CAGRs may differ materially


FAQs

How do procurement teams evaluate spiral wound gasket flange quality beyond standard certifications?
Leading buyers test bolt-load retention over 1,000 thermal cycles and verify filler-material traceability to specific PTFE or graphite lots. Third-party witness testing at API-licensed labs adds assurance beyond standard manufacturer certificates [13].
What distinguishes a fire safe valve seal from a standard elastomeric valve seal?
A fire safe valve seal must pass API 607 or ISO 10497 burn testing, surviving direct flame exposure at 750–1,000 °C while maintaining a pressure seal. Standard elastomeric seals melt under these conditions, making fire-safe variants mandatory for hydrocarbon service [8].
How are smart gaskets changing maintenance planning in the Gaskets and Seals Market?
Sensor-embedded gaskets transmit real-time bolt-load and temperature data to plant control systems, enabling condition-based replacement instead of calendar-based schedules. Early LNG adopters report 25–30% reductions in unplanned shutdowns [11].
What material trade-offs exist when specifying O-ring sealing elastomer products for hydrogen service?
Permeation resistance and embrittlement susceptibility are the primary trade-offs; EPDM offers low cost but higher permeation, while FFKM provides superior resistance at 5–8× the price. ISO 23936-2 testing clarifies which grade fits each pressure-temperature envelope [3].
How does PTFE gasket chemical resistance testing differ for battery-electrolyte versus traditional acid service?
Battery-electrolyte swell testing uses lithium-hexafluorophosphate solutions at 85 °C for 500 hours, whereas traditional acid tests use sulfuric or hydrochloric acid at lower concentrations. SAE J3277 now specifies the electrolyte protocol for EV applications [7].
What role does vertical integration into fluoro-rubber compounding play in the Gaskets and Seals Market?
Vertical integration secures raw-material supply and protects margins against fluoropolymer price swings, which exceeded 35% peak-to-trough in 2022–2023. Manufacturers with captive compounding capture 300–500 basis points of additional gross margin [12].
How do hydraulic cylinder rod seal failures typically manifest in offshore equipment?
Rod seal failures present as progressive external leakage past the wiper and primary lip, accelerated by saltwater corrosion and sideload misalignment. Subsea operators now specify redundant tandem-seal designs to extend mean-time-between-failures beyond 15,000 hours [18].    
Author
Author
Author Profile
Rashmi Phumatia LinkedIn
Senior Manager
Rashmi has more than nine years of experience in diversified sectors of the healthcare industry, including pharmaceuticals, diagnostics, medical devices, health care services, healthcare IT, medical services, and managed care. She also has rich experience in food and consumer goods industry including beverages and nutrition. She has also handled projects across the length and breadth of business functions such as procurement and sourcing, business operations, supply chain optimization, market entry strategy, related and unrelated diversification, go-to-market strategy, opportunity analysis, need gap analysis, competitor analysis, target market analysis, and many others.

Research Approach


Secondary Research

The secondary research process involved comprehensive analysis of regulatory databases, industry standards, technical publications, and authoritative manufacturing organizations. Key sources included the US Occupational Safety and Health Administration (OSHA), American Society of Mechanical Engineers (ASME), Society of Automotive Engineers (SAE International), European Committee for Standardization (CEN), International Organization for Standardization (ISO), US Environmental Protection Agency (EPA), European Environment Agency (EEA), US Department of Energy (DOE), International Energy Agency (IEA), National Institute of Standards and Technology (NIST), Bureau of Transportation Statistics (BTS), EU Eurostat Industrial Production Database, US Census Bureau Manufacturing Reports, and national industrial ministry reports from key markets.

For metallic gaskets, rubber seals, PTFE materials, and other sealing technologies, manufacturing statistics, regulatory compliance data, material safety studies, industrial automation trends, and market landscape analysis were gathered from these sources.


Primary Research

In order to gather both qualitative and quantitative insights, supply-side and demand-side stakeholders were interviewed during the primary research process. CEOs, VPs of Manufacturing, R&D directors, and business unit directors from OEMs, material suppliers, and gasket and seal manufacturers were examples of supply-side sources. Procurement managers, maintenance engineers, design engineers, and operations heads from automakers, aerospace firms, oil and gas operators, power plants, and manufacturers of industrial equipment made up demand-side sources. Primary research verified material innovation pipelines, validated market segmentation, and acquired information on supply chain tactics, pricing dynamics, and adoption patterns unique to certain applications.

Primary Respondent Breakdown:

By Designation: C-level Primaries (32%), Director Level (31%), Others (37%)

By Region: North America (32%), Europe (30%), Asia-Pacific (33%), Rest of World (5%)


Market Size Estimation

Revenue mapping and application volume analysis were used to get the global market valuation. The methodology comprised:

Finding more than fifty important manufacturers in North America, Europe, Asia-Pacific, and Latin America

Product mapping for shaft seals, molded seals, spiral wrapped gaskets, rubber gaskets, metallic gaskets, and car body seals

Material-specific examination of advanced composite materials, fiber, graphite, PTFE, and rubber

Examination of annual revenues for gasket and seal portfolios, both reported and modeled

coverage of producers accounting for 72–78% of the world market in 2024

Extrapolation of segment-specific valuations across the automotive, aerospace, oil and gas, power generation, and electronics sectors utilizing top-down (manufacturer revenue validation) and bottom-up (application volume × ASP by industry vertical) techniques

Download Free Sample

Kindly complete the form below to receive a free sample of this Report

Download PDF ×

We do not share your information with anyone. However, we may send you emails based on your report interest from time to time. You may contact us at any time to opt-out.
















