GCC Chemiluminescence Immunoassay Analyzers Market Segmentation
GCC Chemiluminescence Immunoassay Analyzers Market By Type (USD Million, 2025-2035)
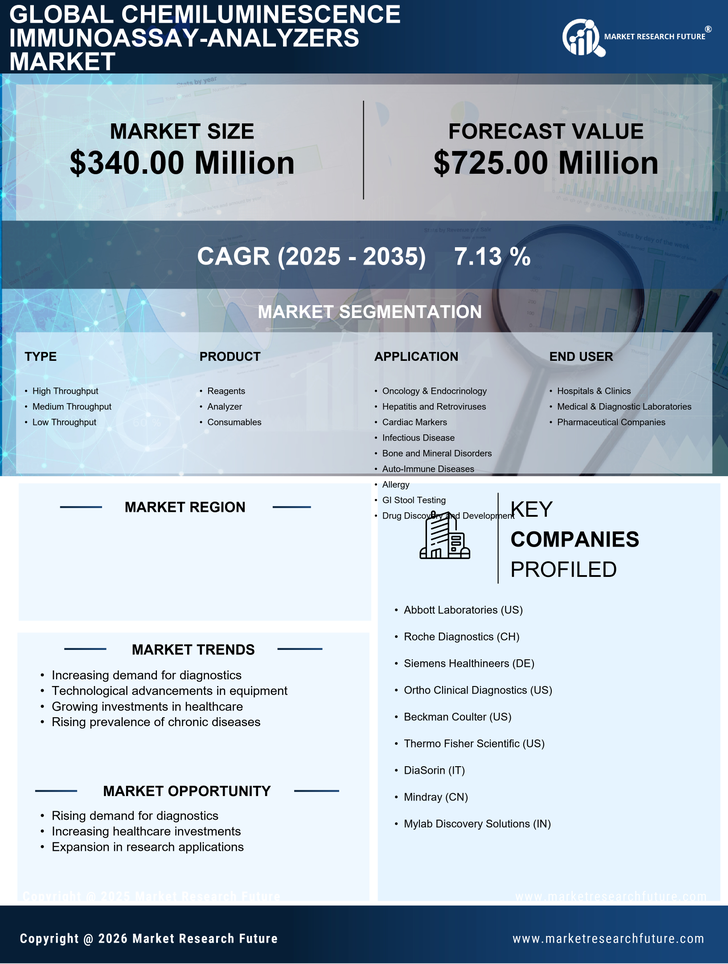
- High Throughput
- Medium Throughput
- Low Throughput
GCC Chemiluminescence Immunoassay Analyzers Market By Product (USD Million, 2025-2035)
- Reagents
- Analyzer
- Consumables
GCC Chemiluminescence Immunoassay Analyzers Market By Application (USD Million, 2025-2035)
- Oncology & Endocrinology
- Hepatitis and Retroviruses
- Cardiac Markers
- Infectious Disease
- Bone and Mineral Disorders
- Auto-Immune Diseases
- Allergy
- GI Stool Testing
- Drug Discovery and Development
GCC Chemiluminescence Immunoassay Analyzers Market By End User (USD Million, 2025-2035)
- Hospitals & Clinics
- Medical & Diagnostic Laboratories
- Pharmaceutical Companies