General Aviation Market (2026 - 2035)

General Aviation Market Size, Share, Industry Trend & Analysis Research Report By Aircraft Type (Business Jets; Turboprop Aircraft; Piston-Engine Aircraft; Helicopters; eVTOL / AAM Vehicles), By Propulsion Type (Conventional Piston / Turbine; Hybrid-Electric; All-Electric), By Ownership Model (Full Private Ownership; Fractional Ownership; Charter / Air Taxi; Leasing / Managed Operations), By End-User Application (Business / Corporate Transport; Personal and Leisure Flying; Emergency Medical Services; Agricultural Aviation; Government and Special Missions), By Geography (North America; Europe; Asia-Pacific; South America; Middle East & Africa) - Forecast to 2035.
ID: MRFR/AD/30777-HCR
128 Pages
Shubham Munde, Sejal Akre
Last Updated: June 30, 2026
General Aviation Market
Market Size
Forecast Period2026-2035
CAGR (2026-2035)4.40%
2025 Market SizeUSD 37.60 Billion
2035 Market SizeUSD 57.83 Billion
Key Players
Textron Aviation
Gulfstream Aerospace
Bombardier
Dassault Aviation
Embraer
Cirrus Aircraft
Opportunities
  • Advanced Air Mobility and Urban Vertiport Networks
  • Data-Driven MRO and Predictive Maintenance Platforms
  • Emerging-Market Fleet Expansion

General Aviation Market Summary

The general aviation market stood at USD 37.60 Billion in 2025 and is projected to reach USD 39.25 Billion in 2026 before climbing to USD 57.83 Billion by 2035, registering a CAGR of 4.40% across the forecast window. Sustained wealth accumulation among high-net-worth individuals and improving corporate profitability are channeling fresh capital into fleet expansion. The FAA Reauthorization Act of 2024 earmarked over USD 4.6 Billion for airport infrastructure modernization, directly benefiting non-commercial airfields and heliports that anchor the general aviation market ecosystem [1].

Propulsion technology is the headline transformation story. Conventional piston and turboprop powertrains remain the workhorse, yet hybrid-electric demonstrators from multiple OEMs logged certification milestones in 2024, pulling forward timelines for sub-regional commuter platforms. The European Union's ReFuelEU Aviation mandate, requiring a 2% sustainable aviation fuel blend by 2025, is pressuring operators and fuel distributors to invest in SAF supply chains that will reshape the general aviation market cost structure over the next decade [2].

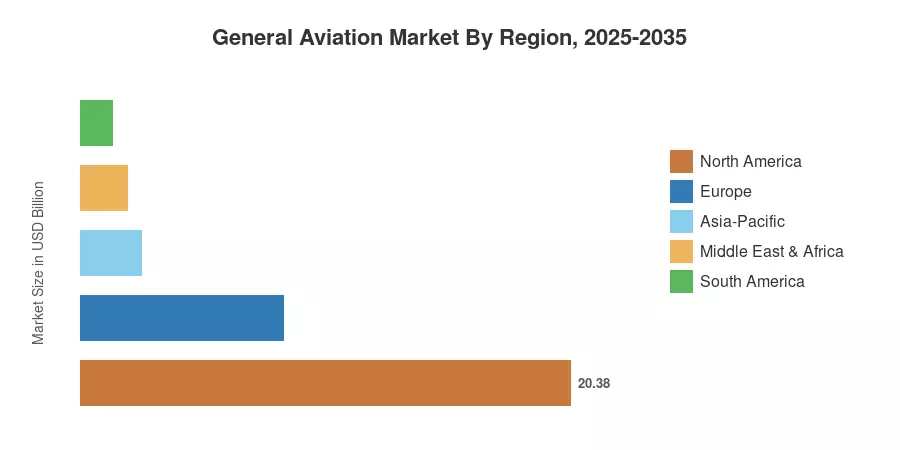
North America commands roughly 54.2% of the general aviation market, buoyed by the world's largest installed fleet of over 210,000 registered aircraft. Asia-Pacific is the fastest-growing region at a projected 6.75% CAGR, driven by greenfield airport construction in India and China. Europe holds the second-largest share at approximately 22.5%, supported by strong business-jet traffic corridors between London, Geneva, and Paris. The interplay of electrification, fractional ownership growth, and next-generation air-traffic management will determine how value is distributed across geographies through 2035.


Key Report Takeaways

• By Aircraft Type

  • Business jets accounted for 49.8% of the general aviation market share in 2025, reflecting sustained corporate demand for intercontinental-range platforms.
  • Turboprop and piston-engine aircraft delivered combined revenues exceeding USD 12.30 billion in 2025, serving training, agricultural, and regional connectivity roles.
  • eVTOL and advanced air-mobility vehicles are projected to expand at a 3.90% CAGR through 2035 as certification pathways crystallize.

• By Ownership

  • Full private ownership commanded 60.5% of the general aviation market in 2025.
  • Charter and air-taxi operators are pacing at a 3.85% CAGR, broadened by on-demand booking platforms.


• By End Use

  • Emergency medical services represent the fastest-growing end-user segment at a 5.35% CAGR to 2035.

• By Region

  • North America captured over 54% of the general aviation market revenues in 2025.
  • Asia-Pacific is logging the fastest regional CAGR at 6.75% through 2035.
  • Europe contributed approximately USD 8.46 Billion in 2025 general aviation market value.


Market Size and Forecast (2021–2035)

Figures below combine primary research interviews with OEM delivery data, aircraft registry filings, FAA and EASA annual reports, and proprietary econometric modeling. Historical values (2021–2024) reflect actual deliveries and fleet utilization rates; forecast values (2026–2035) apply a constant CAGR anchored to the 2025 base year.
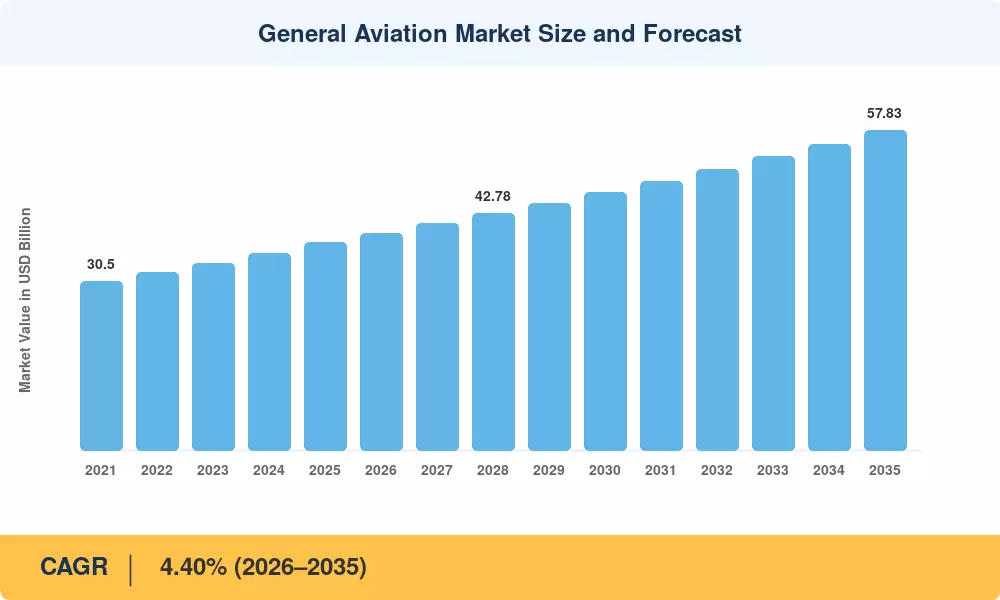
General Aviation Market Size and Forecast
Our Impact
Enabled $4.3B Revenue Impact for Fortune 500 and Leading Multinationals
Partnering with 2000+ Global Organizations Each Year
30K+ Citations by Top-Tier Firms in the Industry

Driver Impact Analysis

Driver ~% Impact on CAGR Geographic Relevance Impact Timeline
Corporate fleet replacement cycles +0.85% North America, Europe Short-term (≤2 yr)
Fractional ownership platform expansion +0.70% North America, Asia-Pacific Medium-term (2–4 yr)
SAF mandates and green aviation incentives +0.55% Europe, North America Medium-term (2–4 yr)
Infrastructure upgrades in emerging economies +0.50% Asia-Pacific, MEA Long-term (≥4 yr)
eVTOL and advanced air-mobility certification +0.45% Global Long-term (≥4 yr)
Rising HNWI population and wealth creation +0.40% Asia-Pacific, MEA Short-term (≤2 yr)
Digital flight operations and MRO platforms +0.30% Global Medium-term (2–4 yr)


Corporate Fleet Replacement Cycles

As older avionics suites get closer to obsolescence, large firms running aging midrange and super-midsize jets must contend with rising maintenance costs. Fleet turnover continues to be the principal short-term volume driver for the general aviation sector, as seen by Textron Aviation and Gulfstream's strong order backlogs. Notably, for qualified aircraft put into service after January 19, 2025, the One Big Beautiful Bill Act (OBBBA) of 2025 has permanently reinstated 100% bonus depreciation. This eliminates the prior phase-out timeline, giving capital-intensive purchase decisions long-term certainty and encouraging fleet modernization over lease extensions.


Fractional Ownership Platform Expansion

By growing their managed fleets, NetJets, Flexjet, and Wheels Up continue to push demand beyond conventional owner-operators. By lowering entrance barriers through fractional-share programs, these platforms greatly increase the buyer pool for the general aviation sector and democratize access to point-to-point air travel. By incorporating dynamic pricing algorithms and sophisticated mobile booking interfaces, transactional friction has been significantly reduced, successfully turning charter-curious travelers into regular fractional program users.


SAF Mandates and Green Aviation Incentives

Globally, Sustainable Aviation Fuel (SAF) regulations are expanding. Switzerland introduced its own mandate in January 2026 in accordance with the ReFuelEU rule, which mandates 6% SAF blending by 2030. Fuel manufacturers are being pushed toward scalable paths by complementary U.S. incentives under the Inflation Reduction Act, which continue to provide tax credits for SAF production. Operators who obtain early, long-term SAF supply contracts are given preference in the general aviation market, giving them a clear competitive edge when catering to ESG-conscious corporate clientele.


Infrastructure Upgrades in Emerging Economies

With the approval of the Modified UDAN (UDAN 2.0) program in March 2026 for the years 2026–2036, India's regional connectivity has entered a new phase. This plan intends to build 100 new airports and improve regional connectivity throughout Tier-2 and Tier-3 cities with a significant investment of INR 28,840 crore. In the meantime, as part of its 15th Five-Year Plan (2026–2030), China has shifted its aviation focus to the "low-altitude economy". In order to promote sector-wide growth, China is now giving priority to the deployment of standardized drone infrastructure, eVTOL landing places, and integrated urban air traffic management systems after completing the 14th Five-Year Plan, which resulted in the construction of 270 commercial airports.


Restraints Impact Analysis

Restraint impact percentages are directional, scenario-weighted estimates. They do not mechanically subtract from the headline CAGR.

Restraint ~% Impact on CAGR Geographic Relevance Impact Timeline
High acquisition and operating costs –0.60% Global Persistent
Pilot shortage and training bottlenecks –0.45% North America, Europe Short-term (≤2 yr)
Regulatory fragmentation across jurisdictions –0.35% Global Medium-term (2–4 yr)
Airport slot constraints and noise restrictions –0.30% Europe, Asia-Pacific Persistent
Supply-chain disruptions for critical components –0.25% Global Short-term (≤2 yr)


High Acquisition and Operating Costs

Large-cabin business jets cost more than USD 70 million, whereas new light jets range in price from USD 3.5 million to USD 8 million. Hangarage, insurance, crew pay, and planned maintenance are examples of annual fixed costs that usually make up about 8–12% of the purchase price. High capital expenditures continue to be a barrier to entry, especially for smaller corporate organizations and individual owner-operators in the general aviation industry, even though the extreme interest rate volatility of 2023–2024 has lessened.


Pilot Shortage and Training Bottlenecks

Boeing's 2024 Pilot and Technician Outlook estimated a global need for 674,000 new pilots by 2043, with general aviation competing against commercial airlines for the same candidate pool. Starting salaries at regional airlines surpassed USD 90,000 in 2024, drawing trainees away from corporate and charter operations [15]. The resulting scarcity elevates crew costs and constrains fleet utilization rates, dampening the general aviation market expansion trajectory, particularly in North America and Western Europe.

Regulatory Fragmentation Across Jurisdictions

Different airworthiness standards between the FAA, EASA, ANAC, and CAAC continue to impose substantial duplicative burdens despite continued bilateral initiatives to streamline global certification, such as the FAA-EASA International Aviation Safety Conference held in June 2026. In order to obtain multi-market type certifications for new platforms, OEMs frequently have to undergo additional validation for 18 to 24 months, which increases the cost of compliance by millions per version. This fragmentation continues to be a strategic obstacle for OEMs, especially smaller manufacturers, seeking to introduce new models into the global general aviation market, even as regulators prioritize the responsible introduction of new technologies and unified safety frameworks.


General Aviation Market Opportunities

Advanced Air Mobility and Urban Vertiport Networks

eVTOL platforms from Joby Aviation, Archer Aviation, and Lilium are targeting FAA Part 135 certification between 2025 and 2027. Cities including Los Angeles, Miami, and Dubai have announced vertiport master plans that could generate USD 2–4 billion in new infrastructure spending by 2030 [8]. The general aviation market stands to absorb this emerging vertical, blending traditional FBO networks with next-generation vertiport operations.

Data-Driven MRO and Predictive Maintenance Platforms

Connected aircraft generate over 1 TB of operational data per flight hour. Startups such as Veryon and Flightdocs are monetizing this data through subscription-based predictive-maintenance dashboards that reduce unscheduled downtime by 20–30% [12]. These platforms offer high-margin SaaS revenue streams for the general aviation market and create stickier OEM-operator relationships through long-term service agreements.

Emerging-Market Fleet Expansion

Africa's fleet of registered general aviation aircraft sits below 3,500 units, compared with North America's 210,000-plus. Nigeria, Kenya, and South Africa are modernizing their civil aviation authorities and investing in airfield upgrades to attract private and charter operators [10]. The general aviation market has significant white-space potential in these geographies, particularly for rugged turboprop platforms suited to unimproved strips.

Fractional and Membership-Based Ownership Models

Membership programs like Surf Air Mobility's all-you-can-fly subscription (starting at USD 199 per month plus per-seat costs) are converting price-sensitive travelers from commercial first-class into light-jet passengers. These models increase aircraft utilization rates from the private-owner average of 200–300 hours annually to 1,000+ hours, improving fleet economics and broadening the general aviation market demand base.

Sustainable Aviation Fuel Supply-Chain Investment

Global SAF production reached an estimated 600 million liters in 2024, less than 0.2% of total jet-fuel consumption. Governments and energy majors have announced over USD 16 billion in SAF refinery commitments through 2030 [2]. Early-mover general aviation operators that lock in SAF offtake agreements will gain pricing advantages and regulatory goodwill, particularly in Europe.


General Aviation Market Future Outlook

Electrification and Hybrid-Electric Propulsion

Battery energy density is advancing at roughly 6–8% per year, with solid-state prototypes surpassing 400 Wh/kg in laboratory conditions. If commercial cells reach 350 Wh/kg by 2030, hybrid-electric platforms could serve routes up to 500 nautical miles — covering roughly 85% of general aviation market mission profiles in Europe and Asia-Pacific [9]. Certification of magniX and Rolls-Royce electric powertrains is expected to trigger a second wave of fleet investment rivaling the turbofan transition of the 1970s.

Autonomous Flight and AI-Enabled Operations

Single-pilot operations for business jets are under active regulatory review by both the FAA and EASA, with advisory committees targeting a preliminary rulemaking notice by 2028 [19]. Machine-learning systems from Garmin (Autoland) and Honeywell (Anthem suite) already perform emergency autonomous landings, establishing a technology baseline. Reducing cockpit crew from two to one could lower direct operating costs by 12–18%, materially improving fleet economics within the general aviation market through the mid-2030s.

Platform Economics and Digital Marketplaces

Digital booking platforms such as XO (Vista Global), Magellan Jets, and FlyExclusive are consolidating demand fragmentation by aggregating empty-leg inventory across hundreds of operators. Transaction-based platforms processed an estimated USD 4 billion in bookings during 2024 [20]. As these marketplaces layer in dynamic pricing, carbon-offset integration, and loyalty programs, they will reshape how end users access the general aviation market, shifting pricing power from operators toward platform orchestrators.

ESG Reporting and Carbon-Accountability Frameworks

The EU Corporate Sustainability Reporting Directive (CSRD), effective for large companies from 2025, requires Scope 3 emissions disclosure — including business-travel flights. Corporate sustainability officers increasingly demand carbon-neutral flight options, elevating SAF procurement and carbon-credit bundling from niche add-ons to procurement prerequisites [21]. Operators who embed verified offset programs and real-time emissions dashboards into their service offerings will command a premium positioning within the general aviation market through 2035.


General Aviation Market Segmentation

By Aircraft Type

Segment Key Metric Primary Demand Driver
Business Jets 49.8% share (2025) Corporate travel, intercontinental range
Turboprop Aircraft USD 7.15 Billion (2025) Regional connectivity, training, and cargo
Piston-Engine Aircraft 3.65% CAGR (2026–2035) Flight training, personal recreation
Helicopters USD 5.30 Billion (2025) EMS, offshore energy, VIP transport
eVTOL / AAM Vehicles 3.90% CAGR (2026–2035) Urban mobility, last-mile logistics


Business jets remain the revenue backbone of the general aviation market, led by large-cabin and ultra-long-range models from Gulfstream (G700/G800), Bombardier (Global 7500/8000), and Dassault (Falcon 10X). Order backlogs for these flagship platforms stretched beyond 30 months at the close of 2024, reflecting persistent demand from Fortune 500 flight departments and government-affiliated operators [5]. Turboprop aircraft occupy the second-largest category, with the Pilatus PC-12 and Beechcraft King Air families dominating sales in utility, medevac, and regional commuter roles.

Helicopters serve mission-critical applications where fixed-wing platforms cannot operate — offshore oil-platform crew changes, hospital rooftop EMS landings, and law-enforcement surveillance. Leonardo (AW139/AW169) and Airbus Helicopters (H145/H160) control the medium-twin segment, while Robinson and Bell cater to training and light-utility buyers. The eVTOL category, though small today, carries outsized strategic importance as Joby, Archer, and Vertical Aerospace pursue type certification in the general aviation market.

By Propulsion Type

Segment Key Metric Primary Demand Driver
Conventional Piston / Turbine 85.5% share (2025) Proven reliability, global MRO network
Hybrid-Electric 5.10% CAGR (2026–2035) Fuel savings, noise reduction
All-Electric 4.80% CAGR (2026–2035) Zero-emission mandates, training fleets


Conventional powertrains will remain the dominant propulsion architecture for the general aviation market through the mid-2030s, underpinned by an entrenched global MRO ecosystem and deep spare-parts inventories. Pratt & Whitney Canada's PT6 turboprop family and Continental/Lycoming piston engines power the vast majority of the active fleet. Hybrid-electric propulsion is positioned for medium-range commuter and cargo missions where battery-only range remains insufficient, with programs from Ampaire and Heart Aerospace targeting 2028–2030 entry into service.

By Ownership Model

Segment Key Metric Primary Demand Driver
Full Private Ownership 60.5% share (2025) Corporate flight departments, HNWI buyers
Fractional Ownership USD 5.85 Billion (2025) Cost sharing, guaranteed availability
Charter / Air Taxi 3.85% CAGR (2026–2035) On-demand flexibility, digital booking
Leasing / Managed Operations USD 2.70 Billion (2025) Balance-sheet flexibility


Full private ownership dominates the general aviation market because it offers schedule certainty, cabin customization, and unrestricted base selection. Flight departments at large multinationals and family offices typically operate two to four aircraft, spanning light to large-cabin categories. Fractional ownership continues its secular growth trajectory as NetJets, Flexjet, and PlaneSense add aircraft and expand geographic coverage. Charter and air-taxi operators, meanwhile, are the fastest-growing ownership-model segment, catalyzed by app-based booking platforms that compress quote-to-wheels-up time to under four hours.

By End-User Application

Segment Key Metric Primary Demand Driver
Business / Corporate Transport 52.0% share (2025) C-suite travel, multi-city itineraries
Personal and Leisure Flying USD 6.20 Billion (2025) Recreation, tourism, owner-flown aircraft
Emergency Medical Services 5.35% CAGR (2026–2035) Critical-care patient transfer
Agricultural Aviation USD 1.85 Billion (2025) Crop dusting, aerial application
Government and Special Missions 3.70% CAGR (2026–2035) Surveillance, firefighting, border patrol


Business and corporate transport is the primary revenue engine for the general aviation market, driven by time-sensitive executives requiring direct airport-pair access without commercial-airline scheduling constraints. Emergency medical services represent the highest-growth application, as hospitals and regional health systems invest in rotor- and fixed-wing air-ambulance contracts to meet golden-hour trauma guidelines [22].


Regional Market Share Analysis

Region Key Metric Primary Investment Themes
North America 54.2% share (2025) Fleet modernization, SAF infrastructure, fractional growth
Europe USD 8.46 Billion (2025) Regulatory harmonization, noise-compliant platforms
Asia-Pacific 6.75% CAGR (2026–2035) Airport construction, HNWI fleet additions
South America USD 1.32 Billion (2025) Agricultural aviation, charter connectivity
Middle East & Africa 5.20% CAGR (2026–2035) VIP transport, medevac, oil-and-gas support
Total USD 37.60 Billion (2025)

The general aviation market displays pronounced geographic concentration, with three regions — North America, Europe, and Asia-Pacific — collectively representing over 91% of total value. Investment themes vary sharply by region, from fleet renewal in mature markets to greenfield infrastructure in developing ones.


North America

Country Key Metric Key Driver
United States 82.5% of regional share Largest registered fleet, Part 91/135 operations
Canada USD 1.92 Billion (2025) Northern resource-access flying, medevac
Mexico 3.80% CAGR (2026–2035) Business aviation hubs in Toluca and Monterrey


The United States alone houses more than 190,000 general aviation aircraft across approximately 5,100 public-use airports and nearly 14,000 private airstrips. FAA NextGen ADS-B mandates have driven avionics retrofit spending exceeding USD 1.2 billion since 2020, keeping the aftermarket vibrant. Canada's vast geography makes rotary and fixed-wing charter indispensable for mining, forestry, and indigenous community access, while Mexico's growing business-travel corridors between Mexico City, Monterrey, and Cancún are fueling corporate jet demand within the general aviation market [1][15].

Europe

Country Key Metric Key Driver
Germany 24.8% of regional share Industrial corporate travel, Airbus feeder demand
United Kingdom USD 1.65 Billion (2025) London-area FBO density, finance-sector travel
France 4.15% CAGR (2026–2035) Dassault production ecosystem, leisure flying
Italy USD 0.68 Billion (2025) Luxury charter, Mediterranean routing
Spain 3.90% CAGR (2026–2035) Tourism-driven charter expansion
Nordic Countries USD 0.52 Billion (2025) Remote connectivity, air ambulance
Russia 2.80% CAGR (2026–2035) Sanctions-constrained fleet aging
Rest of Europe USD 1.14 Billion (2025) Emerging FBO networks in Eastern Europe


European general aviation traffic is shaped by EASA's evolving regulatory framework, which introduced simplified Part 21 Light certification in 2023 to reduce compliance costs for sub-2,000 kg aircraft. The UK's post-Brexit CAA divergence adds a separate validation layer for aircraft crossing the English Channel, a friction point that nonetheless preserves London-area FBOs as the continent's busiest general aviation market gateways [16][17].

Asia-Pacific

Country Key Metric Key Driver
China 32.5% of regional share 14th Five-Year Plan airport buildout
India 7.60% CAGR (2026–2035) UDAN regional connectivity scheme
Japan USD 0.92 Billion (2025) Corporate travel, disaster-response fleets
South Korea 5.80% CAGR (2026–2035) UAM corridor development
ASEAN USD 0.74 Billion (2025) Island-hopping charter, tourism
Rest of Asia-Pacific 5.50% CAGR (2026–2035) Australia, New Zealand, resource flying


Asia-Pacific's general aviation market lags North America and Europe in per-capita fleet density but leads in growth momentum. China's CAAC approved 126 new low-altitude flight routes in 2024, unlocking aerial tourism and short-haul cargo corridors. India's Directorate General of Civil Aviation streamlined Non-Scheduled Operator Permits in 2023, reducing charter licensing timelines from 12 months to under 6 [10][11].

South America

Country Key Metric Key Driver
Brazil 68.2% of regional share Agribusiness aviation, Embraer domestic presence
Argentina USD 0.18 Billion (2025) Estancia connectivity, energy exploration
Rest of South America 3.55% CAGR (2026–2035) Mining and resource access


Brazil operates the world's second-largest general aviation fleet after the United States, with roughly 14,000 registered aircraft. Agribusiness operators in Mato Grosso and Goiás rely on single-engine piston aircraft for crop-dusting and ranch logistics, anchoring a recurring demand cycle for the general aviation market. Embraer's Phenom and Praetor families serve as the region's preferred corporate platforms, reinforced by local MRO and parts availability [3][7].

Middle East & Africa

Country Key Metric Key Driver
Saudi Arabia 28.5% of regional share Vision 2030 tourism and NEOM projects
UAE USD 0.54 Billion (2025) Dubai/Abu Dhabi VIP charter hubs
South Africa 4.60% CAGR (2026–2035) Mining logistics, safari tourism
Egypt USD 0.15 Billion (2025) Nile corridor tourism charters
Rest of MEA 5.00% CAGR (2026–2035) Oil-and-gas crew transport, medevac


The Middle East's general aviation market is anchored by ultra-high-net-worth VIP demand concentrated in the UAE and Saudi Arabia. Dubai's Al Maktoum International expansion includes dedicated business-aviation aprons designed to handle wide-cabin, ultra-long-range jets. In sub-Saharan Africa, limited road and rail infrastructure make rotary-wing and STOL fixed-wing aircraft indispensable for humanitarian logistics, mining, and wildlife management [10][11].


General Aviation Market By Region, 2025-2035

Competitive Benchmarking

The general aviation market exhibits medium concentration, with an estimated top-five OEM share of approximately 55–62% and a Herfindahl-Hirschman Index (HHI) in the 900–1,200 range. Consolidation has intensified — Textron's ownership of Cessna, Beechcraft, and Bell creates cross-platform synergies — yet specialized OEMs like Cirrus and Pilatus retain defensible niches. Competition spans airframe manufacturing, propulsion, avionics, and aftermarket services.

Company Est. Revenue Share Range Key Offerings for the General Aviation Market Strategic Positioning
Textron Aviation ~12–16% Cessna Citation jets, Beechcraft King Air turboprops, Cessna piston aircraft Broadest product portfolio across all GA segments
Gulfstream Aerospace (General Dynamics) ~10–14% G280, G650/700/800 large-cabin jets Ultra-long-range and flagship business jets
Bombardier ~8–12% Challenger 350/3500, Global 7500/8000 Large-cabin and super-long-range specialist
Dassault Aviation ~6–9% Falcon 900LX, 6X, 8X, 10X Trijet design heritage, European market strength
Embraer ~5–8% Phenom 100EX/300E, Praetor 500/600 Mid-price business jets, strong Latin America base
Cirrus Aircraft ~3–5% SR series piston, Vision Jet SF50 Owner-flown segment leader, whole-aircraft parachute
Pilatus Aircraft ~3–5% PC-12 NGX, PC-24 Versatile turboprop/jet, short-field capability
Honda Aircraft Company ~2–4% HondaJet Elite S, Echelon Light jet innovation, fuel efficiency
Piper Aircraft ~2–3% M-Class turboprops, Archer/Seminole trainers Training fleet backbone, lower price points
Diamond Aircraft Industries ~1–3% DA40/DA42/DA62, DART-750 Composite airframes, diesel-engine efficiency


Recent News & Developments

  • Gulfstream Aerospace (October 2024): Received FAA type certification for the G700, the industry's largest-cabin purpose-built business jet, reinforcing Gulfstream's ultra-long-range leadership in the general aviation market [23].
  • Bombardier (March 2024): Launched the Global 8000, setting a new city-pair speed record on its maiden transcontinental demonstration flight [25].
  • European Union (January 2025): ReFuelEU Aviation regulation took effect, mandating 2% SAF uplift at all EU airports — directly impacting cost structures across the general aviation market [2].
  • Cirrus Aircraft (November 2023): Delivered its 9,000th SR-series aircraft, marking a milestone in the owner-flown piston segment [26].
  • Archer Aviation (September 2024): Announced a USD 1 billion partnership with United Airlines and Stellantis to scale Midnight eVTOL production for urban air-mobility routes [27].


General Aviation Market Report Scope

Parameter Detail
Market Scope Global general aviation market covering airframe OEMs, propulsion, ownership platforms, and end-user applications
Study Period 2021–2035
CAGR (Forecast) 4.40% (2026–2035)
Market Size (2025) USD 37.60 Billion
Market Size (2035) USD 57.83 Billion
Fastest Growing Segment Emergency Medical Services (5.35% CAGR)
Fastest Growing Region Asia-Pacific (6.75% CAGR)
Companies Profiled 10+, including Textron Aviation, Gulfstream, Bombardier, Dassault, Embraer, Cirrus, Pilatus, Honda Aircraft, Piper, Diamond Aircraft
Valuation Currency USD Billion


FAQs

How do pre-owned aircraft values affect new-aircraft purchase decisions in this sector?
Strong residual values on late-model business jets reduce trade-in friction, encouraging faster fleet turnover to newer, more fuel-efficient platforms. Weak resale conditions, conversely, lock owners into aging aircraft and suppress new-delivery volumes [14].
What insurance considerations should first-time aircraft buyers evaluate?
Hull and liability premiums vary widely by aircraft type, pilot experience, and intended mission profile. Buyers should secure quotes from aviation-specialist underwriters and budget 1.5–3% of hull value annually for comprehensive coverage [14].
How does airspace congestion around major metropolitan areas influence general aviation operations?
Congested terminal airspace forces operators toward satellite reliever airports, increasing ground-transportation time but offering lower landing fees and faster turnaround than primary hubs [17].
What role do avionics retrofit mandates play in lifecycle cost planning?
ADS-B Out mandates and upcoming FANS/CPDLC requirements compel periodic avionics upgrades costing USD 50,000–500,000 per aircraft, creating predictable aftermarket spending cycles [19].
How are carbon-offset programs structured for private aviation operators?
Operators typically partner with verified-credit registries such as Verra or Gold Standard, purchasing offsets at USD 8–25 per metric ton of CO₂ equivalent, bundled into per-flight-hour surcharges [21].
What financing structures dominate new business-jet acquisitions?
Secured loans, operating leases, and tax-equity structures each serve different balance-sheet strategies. Bonus depreciation under U.S. tax code Section 168(k) remains a decisive factor for domestic buyers [13].
How do OEM backlog lengths impact delivery slot availability for prospective buyers?
Current large-cabin backlogs exceed 24–36 months, requiring buyers to commit capital well ahead of need. Pre-owned acquisition or fractional entry offers faster access to capacity [5].    
Author
Author
Author Profile
Shubham Munde LinkedIn
Team Lead - Research
Shubham brings over 7 years of expertise in Market Intelligence and Strategic Consulting, with a strong focus on the Automotive, Aerospace, and Defense sectors. Backed by a solid foundation in semiconductors, electronics, and software, he has successfully delivered high-impact syndicated and custom research on a global scale. His core strengths include market sizing, forecasting, competitive intelligence, consumer insights, and supply chain mapping. Widely recognized for developing scalable growth strategies, Shubham empowers clients to navigate complex markets and achieve a lasting competitive edge. Trusted by start-ups and Fortune 500 companies alike, he consistently converts challenges into strategic opportunities that drive sustainable growth.
Co-Author
Co-Author Profile
Sejal Akre LinkedIn
Senior Research Analyst
She has over 5 years of rich experience, in market research and consulting providing valuable market insights to client. Hands on expertise in management consulting, and extensive knowledge in domain including ICT, Automotive & Transportation and Aerospace & Defense. She is skilled in Go-to market strategy, industry analysis, market sizing, in depth company profiling, competitive intelligence & benchmarking and value chain amongst others.

Research Approach


Secondary Research

The secondary research process involved comprehensive analysis of regulatory databases, aviation industry publications, aerospace technical journals, and authoritative aviation organizations. Key sources included the Federal Aviation Administration (FAA), European Union Aviation Safety Agency (EASA), International Civil Aviation Organization (ICAO), National Business Aviation Association (NBAA), General Aviation Manufacturers Association (GAMA), Aircraft Owners and Pilots Association (AOPA), International Air Transport Association (IATA), Bureau of Transportation Statistics (BTS), National Transportation Safety Board (NTSB), US Department of Transportation (DOT), Eurostat Transport Database, Flight Global, Aviation Week Network, Jane's All the World's Aircraft, Teal Group, Rolls-Royce Market Forecasts, Embraer Market Outlook, Honeywell Global Forecast, JETNET (aircraft transaction data), Amstat (business aircraft statistics), and national civil aviation authorities from key markets including Brazil's ANAC, Canada's Transport Canada, Australia's CASA, and China's CAAC. These sources were used to collect aircraft delivery statistics, fleet composition data, regulatory certification timelines, safety incident reports, pilot demographic trends, airport infrastructure development, and market landscape analysis for piston aircraft, turboprops, business jets, and helicopters.


Primary Research

In order to gather both qualitative and quantitative insights, supply-side and demand-side stakeholders were interviewed during the primary research process. CEOs, VPs of Aircraft Programs, chief engineers, heads of certification, and sales directors from general aviation OEMs (airframe, engine, and avionics manufacturers) as well as MRO suppliers and FBO operators were examples of supply-side sources. Fleet managers, chief pilots, aviation directors, procurement executives from corporate flight departments, fractional ownership providers, flight schools, charter operators, and aircraft lessors were examples of demand-side suppliers. Primary research obtained information on fleet replacement cycles, pre-owned aircraft market dynamics, ADS-B and sustainability mandate compliance, financing/insurance trends, and product development and certification timelines. It also validated market segmentation across aircraft types and business aviation usage patterns.

Primary Respondent Breakdown:

By Designation: C-level Primaries (28%), Director Level (35%), Others (37%)

By Region: North America (32%), Europe (30%), Asia-Pacific (25%), Rest of World (13%)


Market Size Estimation

Global market valuation was derived through delivery tracking, fleet analysis, and order book examination. The methodology included:

Identification of 50+ key manufacturers across North America, Europe, Asia-Pacific, and Latin America

Aircraft mapping across piston-engine airplanes, turboprops, light jets, medium jets, large-cabin long-range jets, and helicopters (light-intermediate-medium-heavy)

Analysis of reported deliveries, backlog values, and modeled OEM revenues specific to general aviation portfolios

Coverage of manufacturers representing 75-80% of global general aviation market share in 2024

Extrapolation using bottom-up (unit deliveries × ASP by aircraft category and region) and top-down (OEM revenue validation against GAMA shipment reports) approaches to derive segment-specific valuations

Download Free Sample

Kindly complete the form below to receive a free sample of this Report

Download PDF ×

We do not share your information with anyone. However, we may send you emails based on your report interest from time to time. You may contact us at any time to opt-out.
















