Green Building Materials Market (2026 - 2035)

Green Building Materials Market Research Report Information By Application (Residential, Commercial, Infrastructure, Industrial) by End-use (Exterior siding, Interior Finishing, Insulation, Framing, Roofing and others), And By Region (North America, Europe, Asia-Pacific, And Rest Of The World) – Market Forecast Till 2035.
ID: MRFR/PCM/1333-HCR
140 Pages
Varsha More
Last Updated: July 06, 2026
Green Building Materials Market
Market Size
Forecast Period2026-2035
CAGR (2026-2035)10.48%
2025 Market SizeUSD 324.50 Million
2035 Market SizeUSD 873.20 Million
Key Players
Holcim Group
BASF SE
Saint-Gobain
Kingspan Group
Owens Corning
Interface Inc.
Opportunities
  • Geopolymer and Calcined-Clay Cement Commercialization
  • Building-as-a-Material-Bank Circular Economy Models
  • Emerging-Market Urbanization in Africa and South Asia

Green Building Materials Market Summary

The Green Building Materials Market was valued at USD 324.50 Million in 2025 and is projected to grow from USD 356.30 Million in 2026 to USD 873.20 Million by 2035, registering a CAGR of 10.48% during the forecast period (2026–2035). Federal procurement mandates in the United States now require Environmental Product Declarations (EPDs) for all materials used in publicly funded construction exceeding USD 35 Million, a threshold that channeled an estimated USD 12 Billion in institutional spending toward verified low-carbon suppliers in 2024 alone [1]. Europe's Digital Product Passport regulation, scheduled for full enforcement by 2028, is further accelerating the shift toward traceable, third-party-certified building inputs [2].

Material science is undergoing a generational transition within the Green Building Materials Market. Conventional Portland cement — responsible for roughly 8% of global CO₂ emissions — is ceding ground to calcined-clay blends and geopolymer binders that cut embodied carbon by up to 40% [3]. Mass-timber framing, once confined to low-rise residential projects, now appears in commercial structures exceeding 18 stories, supported by updated International Building Code provisions adopted across 14 U.S. states [4]. Cellulose insulation derived from post-consumer newsprint is displacing fiberglass in retrofit applications, driven by vapor-permeability requirements in revised energy codes.

North America commands a 43.52% share of the Green Building Materials Market, anchored by Buy Clean mandates and LEED-driven institutional procurement. Asia-Pacific is the fastest-growing region with a projected 11.76% CAGR through 2035, as China's 14th Five-Year Plan targets 50% certified green urban construction by 2030 [5]. Europe holds the second-largest share at approximately 27.50%, propelled by the EU Taxonomy Regulation and Renovation Wave strategy. The convergence of tightening carbon budgets and urbanization in developing economies positions this market for sustained double-digit expansion through the next decade.


Key Report Takeaways

• By Material Type

  • Low-Carbon Concrete and Cement led the Green Building Materials Market with a 25.89% revenue share in 2025, driven by federal EPD mandates and carbon border adjustments
  • Cellulose and Bio-Foam Insulation is advancing at an 11.24% CAGR through 2035, outpacing traditional fiberglass as vapor-permeability codes tighten

• By Application

  • Framing captured 24.78% of the Green Building Materials Market share in 2025, reflecting mass-timber adoption in mid-rise commercial construction
  • Insulation is forecast to expand at a 10.82% CAGR through 2035 as retrofit mandates scale across North America and Europe

• By End-Use Industry

  • Residential construction accounted for 42.45% of 2025 demand in the Green Building Materials Market, supported by green mortgage incentive programs
  • Commercial projects are projected to grow at a 10.67% CAGR to 2035 as tenant ESG specifications penalize high-carbon finishes

• By Region

  • North America leads the Green Building Material Market with a 43.52% of 2025 revenue share.
  • Asia-Pacific is poised to register an 11.76% CAGR through 2035, making it the fastest-expanding region within the Green Building Material Market.


Green Building Materials Market Size and Forecast (2021–2035)

Market sizing draws on a triangulated methodology combining bottom-up revenue analysis of manufacturer shipments, top-down validation against national construction spending databases (U.S. Census Bureau, Eurostat, China NBS), and cross-referencing with EPD registry filings across 40+ countries. Historical figures (2021–2024) reflect audited shipment data; 2025 is the base-year estimate; 2026–2035 values are forecast at a constant 10.48% CAGR.
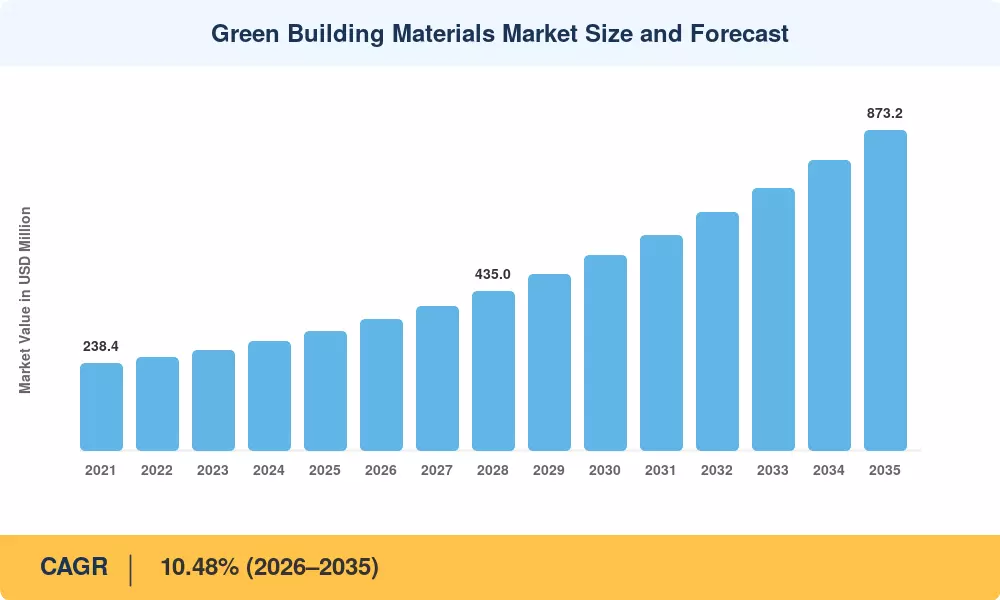
Green Building Materials Market Size and Forecast
Our Impact
Enabled $4.3B Revenue Impact for Fortune 500 and Leading Multinationals
Partnering with 2000+ Global Organizations Each Year
30K+ Citations by Top-Tier Firms in the Industry

Driver Impact Analysis

Driver ~% Impact on CAGR Geographic Relevance Impact Timeline
Federal & state Buy Clean mandates +2.1% North America Short-term (≤2 yr)
EU Digital Product Passport & Taxonomy +1.8% Europe Medium-term (2–4 yr)
Mass-timber building code expansion +1.5% North America, Europe Medium-term (2–4 yr)
China & India green-urban-construction targets +1.9% Asia-Pacific Long-term (≥4 yr)
Corporate net-zero procurement commitments +1.4% Global Medium-term (2–4 yr)
Energy code retrofits mandating low-carbon insulation +1.2% North America, Europe Short-term (≤2 yr)
Carbon border adjustment mechanisms +0.9% Europe, North America Long-term (≥4 yr)


Federal and State Buy Clean Mandates

The U.S. Federal Buy Clean Initiative, codified through Executive Order 14057, requires agencies to prioritize construction materials with published EPDs when spending exceeds USD 35 million per project. The General Services Administration reported that EPD-verified material procurement rose 38% year-over-year in fiscal year 2024, directly benefiting suppliers of low-carbon concrete and recycled-steel framing.

EU Digital Product Passport and Taxonomy Regulation

The European Commission's Ecodesign for Sustainable Products Regulation mandates Digital Product Passports (DPPs) for construction products beginning in 2028, requiring full lifecycle carbon disclosure from raw-material extraction through end-of-life [2]. Early pilot programs in France and Germany have already creating first-mover advantages for manufacturers investing in traceability infrastructure.

Mass-Timber Building Code Expansion

In 2024, the International Building Code was updated to allow for mass timber construction up to 18 stories, and 14 states in the U.S. and three provinces in Canada have now embraced this provision [4]. As a substitute for steel and concrete assemblies, cross-laminated timber (CLT) sequesters about 1 tonne of CO2 per cubic meter and provides a 25-45% decrease in embodied carbon for mid-rise structures. Institutional investors, pension funds managing upwards of USD 600 billion in real estate, and others now need mass-timber in any new portfolio additions [11].


China and India Green-Urban-Construction Targets

China’s Ministry of Housing and Urban-Rural Development has a goal of 50% certified green urban construction by 2030, with RMB 180 billion in local subsidies from 2023-2025 [5]. Energy Conservation Building Code 2023 – Sets minimum green-material requirements for commercial buildings over 5,000 square meters in all Tier-1 cities across India. Addressable demand: USD 8.2 billion per annum by 2028 [8].


Restraints Impact Analysis

Restraint impact percentages are directional estimates reflecting each factor's drag on market growth. They are not directly subtracted from the CAGR and represent qualitative assessments from industry interviews and supply-chain modeling.

Restraint ~% Impact on CAGR Geographic Relevance Impact Timeline
Feedstock constraints on fly ash and agricultural residue −1.4% Global Short-term (≤2 yr)
Green premium pricing barriers −1.1% Emerging markets Medium-term (2–4 yr)
Fragmented certification and standards landscape −0.8% Global Long-term (≥4 yr)
Skilled-labor shortages for mass-timber and CLT installation −0.7% North America, Europe Medium-term (2–4 yr)
Supply-chain bottlenecks in recycled-metal feedstock −0.5% Asia-Pacific, South America Short-term (≤2 yr)


Feedstock Constraints on Supplementary Cementitious Materials

Coal-fired power generation — the primary source of fly ash used in blended cements — is declining globally. Producers are pivoting toward calcined natural pozzolans and ground granulated blast-furnace slag, but these alternatives require dedicated processing infrastructure that adds USD 8–12 per tonne to production costs.

Green Premium Pricing Barriers

In most regions, low-carbon concrete now has a 15-25% premium above conventional mixtures, rising to 30-40% in Southeast Asia and Sub-Saharan Africa, where the certification infrastructure is young [14]. Cost-sensitive developers working in price-elastic marketplaces will oppose specification changes until either carbon pricing or procurement regulations capture the environmental cost of conventional materials.


Fragmented Certification Landscape

Globally, there are more than 600 green building rating systems, including LEED, BREEAM, and country-specific systems such as India's GRIHA and China's Three-Star system [15]. Material suppliers must manage numerous product certifications in parallel, with yearly compliance expenses topping USD 250,000 for mid-sized firms. This fragmentation demotivates small producers to enter into Green Building Materials Market.


Green Building Materials Market Opportunities

Geopolymer and Calcined-Clay Cement Commercialization

Geopolymer cements — produced from industrial byproducts activated with alkaline solutions — deliver 60–80% lower embodied carbon than Portland cement and are approaching price parity in pilot manufacturing lines [3]. LC3 (Limestone Calcined Clay Cement) technology, validated by the Swiss Federal Institute of Technology, requires only minor kiln modifications, reducing capex barriers for existing cement producers.

Building-as-a-Material-Bank Circular Economy Models

The European Commission’s Level(s) framework promotes the design of buildings for the recovery of materials, where structural elements are considered as assets with residual value instead of demolition rubbish. Dutch early adopters have shown 70 percent material-recovery rates in commercial deconstruction projects, establishing second-hand supply chains for recycled steel, timber and masonry. This strategy turns demolition contractors into providers of materials, creating a new revenue stream in the Green Building Materials Market.


Emerging-Market Urbanization in Africa and South Asia

Sub-Saharan Africa is expected to add 900 million urban residents by 2050, requiring an estimated 300 million new housing units [18]. Compressed earth blocks, stabilized with 5–8% cement content, offer a 60% cost reduction over fired brick while meeting structural requirements for buildings up to four stories. International development finance institutions have committed USD 2.4 billion in concessional lending for green-housing projects across East Africa and South Asia between 2024 and 2028.

Digital Material Passports and Data Monetization

As DPP mandates expand, manufacturers who instrument their supply chains with IoT sensors and blockchain-based provenance tracking can license lifecycle data to architects, insurers, and ESG reporting platforms [2]. This data-as-a-service model could generate ancillary revenue equal to 3–5% of core material sales for early movers, effectively monetizing compliance investments.

Green Retrofit of Existing Commercial Building Stock

Approximately 75% of Europe's building stock is energy-inefficient, and the EU Renovation Wave strategy targets 35 million building renovations by 2030 [12]. Retrofit insulation, low-VOC coatings, and recycled-content cladding represent a distinct demand channel within the Green Building Materials Market that is largely independent of new-construction cycles.


Green Building Materials Market Future Outlook

AI-Driven Material Selection and Design Optimization

Generative design platforms powered by machine learning are enabling architects to optimize material selection for embodied carbon, structural performance, and cost simultaneously. Autodesk's Forma platform and similar tools have demonstrated 20–30% reductions in material volumes for complex structures, directly reducing green-material procurement costs [20]. By 2030, an estimated 45% of commercial projects in OECD countries will use AI-assisted material specification, creating a feedback loop that favors suppliers offering machine-readable EPD data.

Carbon-Credit Integration and Embodied-Carbon Trading

Developers using low-carbon concrete or mass timber can now monetize avoided emissions, creating a financial incentive structure that the World Bank estimates could channel USD 8 Billion annually into the Green Building Materials Market by 2032. Expect regulated embodied-carbon caps to follow in the EU and North America by 2028–2030.

Industrialized Construction and Modular Prefabrication

Off-site construction using prefabricated green-material assemblies — CLT panels, recycled-steel modules, and bio-composite facades — reduces site waste by 50–70% and construction timelines by 30–40% . estimates that industrialized construction could capture USD 130 billion of global construction value by 2030, with green-certified modules commanding a 10–15% price premium. The Green Building Materials Market will increasingly serve modular fabrication facilities rather than traditional job sites.

ESG Reporting Mandates and Scope 3 Disclosure

The International Sustainability Standards Board (ISSB) S2 climate disclosure standard, effective for fiscal years beginning January 2025, requires Scope 3 emissions reporting for listed companies — including embodied carbon in corporate real-estate portfolios [21]. This forces corporate occupiers to demand lifecycle-carbon data from landlords, who in turn specify low-carbon materials. An estimated 4,000 publicly listed companies with combined real-estate assets exceeding USD 15 trillion will be subject to these requirements by 2027, structurally shifting procurement toward the Green Building Materials Market.


Green Building Materials Market Segmentation

By Material Type

Segment Key Metric Primary Demand Driver
Low-Carbon Concrete and Cement 25.89% share (2025) EPD mandates; federal procurement rules
Recycled Metals USD 62.40 Million (2025) Circular-economy regulations; scrap-steel availability
Structural Timber (CLT, Glulam) 11.10% CAGR (2026–2035) Building-code expansion to 18 stories
Cellulose and Bio-Foam Insulation 11.24% CAGR (2026–2035) Vapor-permeability code requirements
Recycled-Content Roofing and Cladding USD 34.80 Million (2025) Cool-roof mandates; LEED material credits
Other Green Materials 8.50% CAGR (2026–2035) Bio-composites; bamboo structural products


Low-Carbon Concrete and Cement commands the largest share of the Green Building Materials Market by material type, driven by the sheer volume of cementitious products consumed in global construction — over 4 billion tonnes annually. EPD-verified blended cements containing fly ash, slag, or calcined clay now account for roughly one-quarter of the total market, as procurement mandates compel specifiers to document Global Warming Potential per unit of structural capacity.

Cellulose and Bio-Foam Insulation represent the fastest-growing material category, outpacing conventional fiberglass and mineral-wool products. Updated residential energy codes in the United States (IECC 2024) and Europe (EPBD recast) mandate higher R-values and vapor permeability, specifications that cellulose naturally meets without chemical vapor barriers [12]. Bio-based spray-foam formulations using soy or castor-oil polyols are gaining share in commercial retrofit applications where closed-cell performance is required.

By Application

Segment Key Metric Primary Demand Driver
Framing 24.78% share (2025) Mass-timber IBC code expansion
Insulation 10.82% CAGR (2026–2035) Energy-code retrofit mandates
Roofing USD 48.60 Million (2025) Cool-roof ordinances; solar-ready requirements
Exterior Cladding and Facades 10.30% CAGR (2026–2035) Ventilated-facade energy standards
Interior Finishes USD 28.90 Million (2025) Low-VOC mandates; WELL Building certification
Foundation and Paving 9.20% CAGR (2026–2035) Permeable-paver stormwater regulations


Framing represents the largest application segment in the Green Building Materials Market, reflecting the structural backbone role of concrete, steel, and timber in every building project. The expansion of mass-timber codes to 18 stories has opened mid-rise commercial and institutional construction to CLT and glulam framing, displacing reinforced concrete in projects where carbon budgets are binding constraints [4].

Insulation is the fastest-growing application segment, driven by a dual wave of new-construction energy codes and retrofit mandates targeting existing building stock. The EU Energy Performance of Buildings Directive recast requires member states to renovate the worst-performing 15% of commercial buildings by 2030, creating a retrofit pipeline valued at EUR 275 billion that heavily favors bio-based and recycled-content insulation systems [12].

By End-Use Industry

Segment Key Metric Primary Demand Driver
Residential 42.45% share (2025) Green mortgages; energy-code compliance
Commercial 10.67% CAGR (2026–2035) Tenant ESG specifications; LEED/BREEAM mandates
Industrial and Institutional USD 52.30 Million (2025) Government EPD procurement; university net-zero pledges
Infrastructure 10.10% CAGR (2026–2035) Green-road and bridge programs; permeable-paving codes


Residential construction is the largest end-use segment in the Green Building Materials Market, driven by rising consumer awareness, green-mortgage products offering 10–25 basis-point rate discounts, and mandatory energy-code compliance that effectively requires low-carbon material specification in single- and multi-family housing [14]. The U.S. Department of Housing and Urban Development's Green Building Initiative has channeled USD 3.8 billion in FHA-insured mortgages toward green-certified homes since 2023.

Commercial construction is the fastest-growing end-use segment, as corporate tenants increasingly embed embodied-carbon limits in lease agreements. CBRE reports that 62% of Fortune 500 companies now include green-material clauses in build-to-suit specifications, penalizing landlords who rely on conventional high-carbon finishes [11]. This specification-driven demand creates a structural growth tailwind for the Green Building Materials Market within office, retail, and hospitality construction.


Regional Market Share Analysis

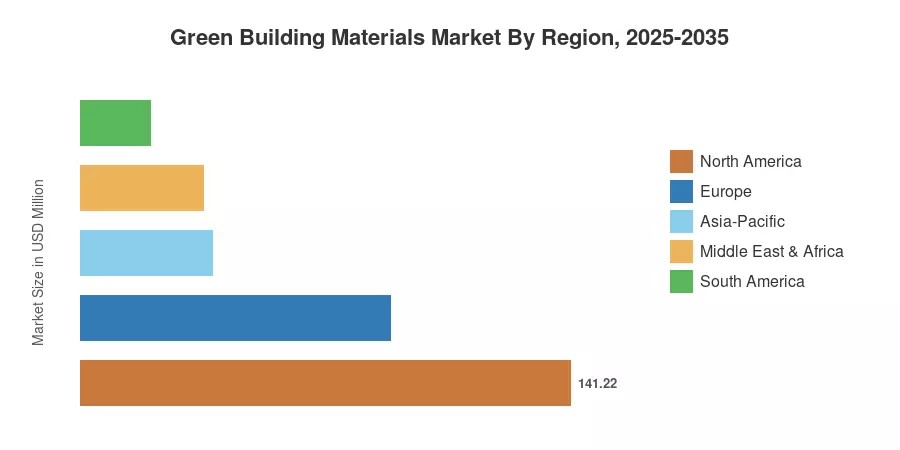
Region Key Metric Primary Investment Themes
North America 43.52% share (2025) Buy Clean mandates; LEED institutional procurement
Europe USD 89.30 Million (2025) Digital Product Passports; Renovation Wave retrofits
Asia-Pacific 11.76% CAGR (2026–2035) Green-urban-construction codes; urbanization subsidies
South America USD 20.10 Million (2025) EDGE certification adoption; social housing programs
Middle East & Africa 10.95% CAGR (2026–2035) NEOM and Vision 2030 green infrastructure; GSAS codes
Total USD 324.50 Million (2025)

The Green Building Materials Market exhibits significant regional variation shaped by regulatory maturity, construction spending, and certification infrastructure. North America leads in absolute value, while Asia-Pacific shows the strongest growth trajectory.


North America

Country Key Metric Key Driver
United States 78.30% of regional share Federal Buy Clean; state-level EPD mandates
Canada USD 18.60 Million (2025) Mass Timber Action Plan; BC Step Code
Mexico 9.85% CAGR (2026–2035) NAMA social housing; EDGE certification pilots


The United States accounts for the vast majority of North American demand in the Green Building Materials Market, driven by the General Services Administration's EPD procurement rules and California's pioneering Buy Clean Act. Canada's Mass Timber Action Plan has catalyzed over CAD 400 Million in CLT manufacturing capacity since 2022, while British Columbia's Energy Step Code is creating mandatory demand for high-performance insulation and triple-glazed fenestration [4].

Europe

Country Key Metric Key Driver
Germany 24.50% of regional share Energiewende; KfW-efficient building subsidies
United Kingdom USD 14.80 Million (2025) Future Homes Standard 2025; PAS 2080 carbon management
France 10.92% CAGR (2026–2035) RE2020 lifecycle-carbon regulation
Italy USD 8.40 Million (2025) Superbonus 110% green-renovation incentive
Spain 10.15% CAGR (2026–2035) CTE-DB-HE energy code revision
Nordic Countries USD 11.20 Million (2025) Carbon-neutral construction roadmaps
Russia 7.85% CAGR (2026–2035) Green-building standard GOST R adoption
Rest of Europe USD 12.90 Million (2025) EU Taxonomy alignment; Renovation Wave funds


Europe's regulatory architecture is the most prescriptive globally, with France's RE2020 regulation mandating lifecycle carbon accounting for all new buildings since January 2022 [2]. Germany's KfW efficiency program disbursed EUR 14 billion in green-building subsidies between 2021 and 2024, directly stimulating demand for low-carbon insulation and structural timber across the Green Building Materials Market.

Asia-Pacific

Country Key Metric Key Driver
China 38.70% of regional share Three-Star certification; municipal green-construction subsidies
India 12.30% CAGR (2026–2035) ECBC 2023; GRIHA-mandated commercial buildings
Japan USD 7.20 Million (2025) ZEH (Net Zero Energy House) program
South Korea 11.50% CAGR (2026–2035) Green New Deal; K-Building carbon assessment
ASEAN USD 4.80 Million (2025) EDGE and GreenMark certification expansion
Rest of Asia-Pacific 10.20% CAGR (2026–2035) Urbanization-driven construction growth


China's green-building certification base has grown at a compound rate exceeding 20% annually since 2020, with certified floor area surpassing 10 billion square meters in 2024 [5]. India's ECBC 2023 mandates minimum green-material specifications for commercial buildings in all Tier-1 cities, while South Korea's Green New Deal has earmarked KRW 12.1 trillion for carbon-neutral building retrofits through 2030, making Asia-Pacific the fastest-growing region in the Green Building Materials Market.

South America

Country Key Metric Key Driver
Brazil 58.20% of regional share LEED Brazil; Minha Casa Verde e Amarela
Argentina USD 3.40 Million (2025) IRAM green-construction standards
Rest of South America 9.50% CAGR (2026–2035) IDB-financed green social housing


Brazil dominates South American demand, where LEED-certified floor area surpassed 22 million square meters in 2024, and the federal Minha Casa Verde e Amarela housing program now includes green-material procurement requirements for projects exceeding 500 units [9]. Argentina's IRAM standards body issued revised thermal-insulation mandates in 2023, catalyzing new demand for bio-based and recycled-content insulation products.

Middle East & Africa

Country Key Metric Key Driver
Saudi Arabia 32.10% of regional share Vision 2030; NEOM zero-carbon city mandate
UAE USD 3.90 Million (2025) Estidama Pearl Rating; Al Masdar City standards
South Africa 10.80% CAGR (2026–2035) Green Building Council SA; carbon tax Act
Egypt USD 1.80 Million (2025) New Administrative Capital green specifications
Rest of MEA 9.70% CAGR (2026–2035) AfDB green-infrastructure lending


Saudi Arabia's NEOM project specifies 100% green-certified construction materials across its planned 170 km linear development, representing a single-project demand surge estimated at USD 1.2 billion through 2030 [19]. The UAE's Estidama Pearl Rating system, mandatory for all new Abu Dhabi construction, has established one of the most mature green-procurement frameworks in the Middle East, driving sustained demand within the Green Building Materials Market.


Green Building Materials Market By Region, 2025-2035

Competitive Benchmarking

The Green Building Materials Market exhibits medium concentration, with an estimated HHI of 650–800 and the top five players commanding approximately 28–35% of global revenue. The landscape spans global building-material conglomerates with dedicated green product lines, specialized pure-play manufacturers, and regional producers leveraging local feedstock advantages. Competition centers on EPD portfolio breadth, carbon-intensity benchmarks, and certification speed rather than price alone.

Company Est. Revenue Share Range Key Offerings for Green Building Materials Market Strategic Positioning
Holcim Group ~6–9% ECOPact low-carbon concrete; Susteno recycled-aggregate cement Vertical integration from quarry to ready-mix; global EPD leader
BASF SE ~5–8% Neopor EPS insulation; Elastopor bio-based spray foam Chemical innovation platform; R&D spend exceeding EUR 2.4B annually
Saint-Gobain ~5–7% ISOVER bio-based insulation; Gyproc recycled-content gypsum Full building-envelope solutions; 250+ EPDs published
Kingspan Group ~4–6% QuadCore insulation panels; Planet Passionate sustainability program Net-zero manufacturing target by 2030; circular-economy focus
Owens Corning ~3–5% PINK NEXT GEN fiberglass; EcoTouch recycled-content batts Vertically integrated glass-fiber manufacturing; U.S. market leader
Interface Inc. ~2–4% Carbon-negative carpet tile; Climate Take Back initiative First manufacturer to achieve carbon-negative products at scale
PPG Industries ~2–4% Low-VOC architectural coatings; DURANAR recycled-content finishes Coatings specialist with LEED-credit-enabling product portfolio
Boral Limited ~2–3% Envirocrete low-carbon concrete; recycled-content masonry Asia-Pacific production footprint; fly-ash supply integration
Armstrong World Industries ~2–3% Sustain ceiling systems; recycled-content mineral fiber Cradle to Cradle certified; interior-finish specialization
Knauf Group ~2–3% Knauf Insulation ECOSE bio-binder; Cleaneo air-purifying board European market leader in insulation; bio-binder technology pioneer


Recent News & Developments

  • Holcim Group (October 2024): Launched ECOPact Prime, a concrete mix achieving 90% lower carbon intensity versus conventional Portland-cement mixes, now available across 15 European markets [3]


  • European Commission (December 2024): Published delegated acts specifying Digital Product Passport data requirements for construction products, with pilot enforcement beginning January 2026 [2]


  • BASF SE (January 2024): Introduced Elastopor Terra, a spray-foam insulation system derived from 30% castor-oil-based polyols, targeting the North American retrofit market [24]
  • U.S. General Services Administration (November 2023): Expanded Buy Clean procurement mandates to cover flat glass and mineral-wool insulation, adding an estimated USD 4.2 billion in annual addressable demand [1]


Green Building Materials Market Report Scope

Parameter Detail
Market Scope Global Green Building Materials Market
Study Period 2021–2035
CAGR 10.48% (2026–2035)
Base Year Market Size USD 324.50 Million (2025)
Forecast Endpoint Market Size USD 873.20 Million (2035)
Fastest Growing Segment Cellulose and Bio-Foam Insulation (by material type); Asia-Pacific (by region)
Companies Profiled 10 (Holcim, BASF, Saint-Gobain, Kingspan, Owens Corning, Interface, PPG, Boral, Armstrong, Knauf)
Valuation Currency USD Million


FAQs

How do Environmental Product Declarations affect procurement decisions in the Green Building Materials Market?
EPDs enable specifiers to compare embodied carbon across competing products on a standardized basis. Procurement teams use EPD data to score bids, awarding 5–15% preference to suppliers demonstrating lower Global Warming Potential [1].
What role does carbon pricing play in accelerating adoption of green materials?
Carbon taxes and cap-and-trade systems raise the effective cost of conventional cement and steel, narrowing the green premium. The EU ETS carbon price exceeding EUR 80 per tonne has shifted cost-competitiveness decisively toward low-carbon alternatives [10].
How do mass-timber structures compare to steel-frame buildings in fire performance?
CLT panels char at a predictable rate of approximately 0.65 mm per minute, maintaining structural integrity for fire-resistance ratings up to 2 hours. This performance meets or exceeds code requirements for most commercial applications [4].
What financing mechanisms support green building material adoption in developing economies?
Development finance institutions offer concessional loans with 200–400 basis-point rate reductions for certified green projects. The IFC's EDGE program functions as a green building standard and certification tool deployed across roughly 96 to 130 countries to verify USD 63 billion in assets [9].
How are digital twins advancing material lifecycle management in the Green Building Materials Market?
Digital twins link real-time sensor data with BIM models, enabling predictive maintenance and end-of-life material-recovery planning. Early adopters report 25–35% improvement in material utilization rates across building lifecycles [20].
What supply-chain risks threaten recycled-metal availability for the Green Building Materials Market?
Scrap-steel export restrictions in Turkey and India, combined with rising EAF capacity in Southeast Asia, are tightening recycled-metal feedstock. Producers are securing 5–10-year offtake agreements to mitigate supply volatility [17].
How do green building certifications impact commercial property valuations?
LEED-certified office buildings command 3–4% rental premiums and 14–20% higher sale prices versus non-certified peers. These valuation premiums create direct financial incentives for landlords to specify green materials [14].    
Author
Author
Author Profile
Varsha More LinkedIn
Senior Research Analyst
Experienced business professional with a demonstrated history of working in the CFnB industry. Skilled in market research, and market estimation. Strong professional with a Masters focused in marketing management.

Research Approach


Secondary Research

The secondary research process involved comprehensive analysis of regulatory databases, industry publications, construction trade journals, and authoritative environmental and building organizations. Key sources included the US Environmental Protection Agency (EPA), US Green Building Council (USGBC), US Department of Energy (DOE) Building Technologies Office, US Department of Housing and Urban Development (HUD), National Institute of Standards and Technology (NIST), European Commission Directorate-General for Environment, European Environment Agency (EEA), EU Construction and Demolition Waste Management protocols, International Energy Agency (IEA), World Green Building Council (WorldGBC), United Nations Environment Programme (UNEP) Global Status Report for Buildings and Construction, International Code Council (ICC), Leadership in Energy and Environmental Design (LEED) certification database, Building Research Establishment (BRE) Environmental Assessment Method (BREEAM), Construction Products Regulation (CPR) EU database, National Association of Home Builders (NAHB), American Institute of Architects (AIA), ASTM International standards, ISO Technical Committee 59 (Building Construction), national statistics offices from key markets (US Census Bureau, Eurostat, National Bureau of Statistics of China), and ministry reports from housing, environment, and construction departments across major economies. These sources were used to collect building permit data, green certification statistics, energy efficiency regulations, carbon emission targets, material consumption trends, and market landscape analysis for wood-based materials, insulation products, exterior siding systems, interior finishing materials, roofing solutions, and framing technologies.


Primary Research

Qualitative and quantitative insights were obtained by interviewing supply-side and demand-side stakeholders during the primary research process. The supply-side sources comprised CEOs, VPs of Sustainability, chief technology officers, regulatory affairs heads, product development directors, and commercial directors from green building material manufacturers, chemical companies that produce eco-friendly raw materials, and construction material distributors. Demand-side sources included chief sustainability officers, procurement directors, project managers, architects, general contractors, facility managers, and green building consultants from residential developers, commercial construction firms, infrastructure project developers, and industrial facility operators. The primary research validated market segmentation, confirmed sustainability certification timelines, and collected insights on material adoption patterns, pricing dynamics, carbon footprint reduction strategies, and green building code conformance requirements.

Primary Respondent Breakdown:

By Designation: C-level Primaries (32%), Director Level (30%), Others (38%)

By Region: North America (32%), Europe (30%), Asia-Pacific (32%), Rest of World (6%)


Market Size Estimation

The global market valuation was determined by analyzing construction volume and revenue mapping. Included in the methodology were the followingThe identification of over 50 main manufacturers in North America, Europe, Asia-Pacific, Latin America, and the Middle East and AfricaProduct mapping for wood-based materials, insulation systems, exterior siding, interior finishing, roofing materials, structural solutions, and other green building categoriesA review of the annual revenues that have been reported and modeled for the green building material portfolios.

Coverage of manufacturers representing 72-78% of global market share in 2024

Extrapolation using bottom-up (construction project volume × material ASP by country/region) and top-down (manufacturer revenue validation) approaches to derive segment-specific valuations

Integration of green building certification data (LEED, BREEAM, Green Star, etc.) to validate market penetration rates

Cross-reference with government mandates for sustainable construction and energy efficiency retrofit programs to gauge the trajectory of demand.

Download Free Sample

Kindly complete the form below to receive a free sample of this Report

Download PDF ×

We do not share your information with anyone. However, we may send you emails based on your report interest from time to time. You may contact us at any time to opt-out.
















