AI In Healthcare Market (2026 - 2035)

AI In Healthcare Market Research Report: Size, Share, Trend Analysis By Applications (Medical Imaging, Predictive Analytics, Robotic Surgery, Clinical Trials, Virtual Health Assistants), By Technology (Machine Learning, Natural Language Processing, Computer Vision, Deep Learning), By End Use (Hospitals, Pharmaceutical Companies, Research Institutions, Diagnostic Centers) - Growth Outlook & Industry Forecast 2025 To 2035

Forecast Period
2026-2035
CAGR
33.7%
2025 Market Size
USD 37.33 Billion
2035 Market Size
USD 681.02 Billion
Healthcare Services ● Updated August 26, 2026 Report ID: MRFR/HS/4226-CR | Pages: 144 | Author: Rahul Gotadki, Kinjoll Dey

AI In Healthcare Market Summary

The Artificial Intelligence in Healthcare Market reached USD 37.33 billion in 2025 and opens the forecast window at USD 49.86 billion in 2026, climbing to USD 681.02 billion by 2035 at a 33.7% CAGR. Two catalysts explain the steepness of that curve. The U.S. Centers for Medicare & Medicaid Services has begun attaching New Technology Add-on Payments to algorithm-assisted diagnostic procedures, converting pilot budgets into recurring line items [3]. Parallel to that, the European Union's AI Act created a compliance calendar that health systems can actually plan against [6].

Hospitals are abandoning rule-based clinical alerts, isolated PACS viewers, and manual prior authorization queues. They’ve been replaced by inference pipelines that run against images, claims and unstructured notes in parallel. Globally, venture and corporate funding into health-focused algorithm developers hit USD 11.4 billion in 2024, which is around 28% higher than the previous year [16].


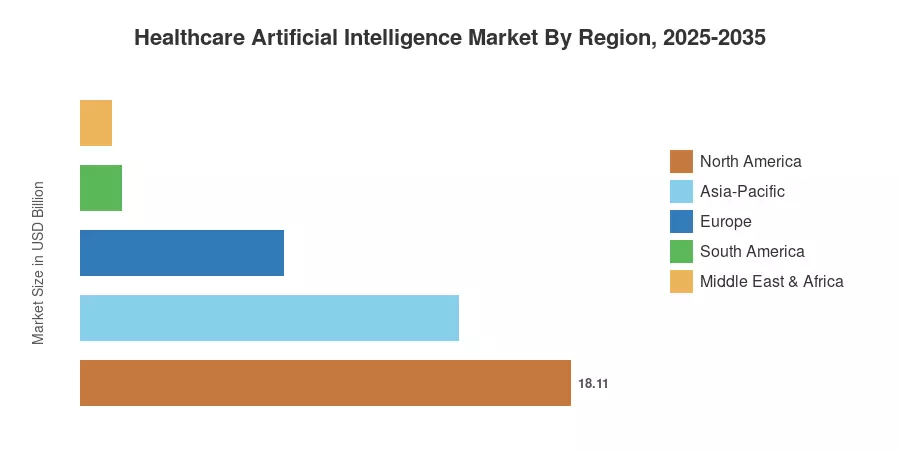
Geographically, North America accounts for 48.5% of the Artificial Intelligence in Healthcare Market, owing to dense GPU capacity and early payer testing. Asia-Pacific sees the fastest growth at 37.4% CAGR, driven by federated data frameworks in China, Japan and India. Europe is second, aided by Germany’s hospital digitization fund. The next decade will be for those suppliers who survive procurement, not demos.


Key Report Takeaways

• By Technology

  • Machine learning held a 34.2% share of the Artificial Intelligence in Healthcare Market in 2025, the largest single technology block.
  • Computer vision and context-aware computing are forecast to advance at a 37.8% CAGR through 2035
  • Natural language processing contributed roughly USD 7.99 billion in 2025 revenue.

• By Sector

  • Software solutions captured 42.5% of component revenue in 2025
  • Services are projected to compound at 36.5% annually to 2035
  • Robot-assisted surgery generated about USD 7.88 billion within the Artificial Intelligence in Healthcare Market in 2025

• By Geography

  • North America led with a 48.5% revenue share in 2025
  • Asia-Pacific is the fastest-growing region at a 37.4% CAGR
  • Europe recorded USD 7.50 billion in 2025 revenue


Market Size and Forecast (2021–2035)

Estimates are derived from bottom-up vendor revenue mapping across around 140 declared product lines, triangulated top-down against national health IT spend figures, regulatory clearance counts and hospital capital budget disclosures. For issuers that break out health-specific algorithm revenue, historical years were reconciled against audited segment reporting; otherwise, allocation used installed-base weighting.
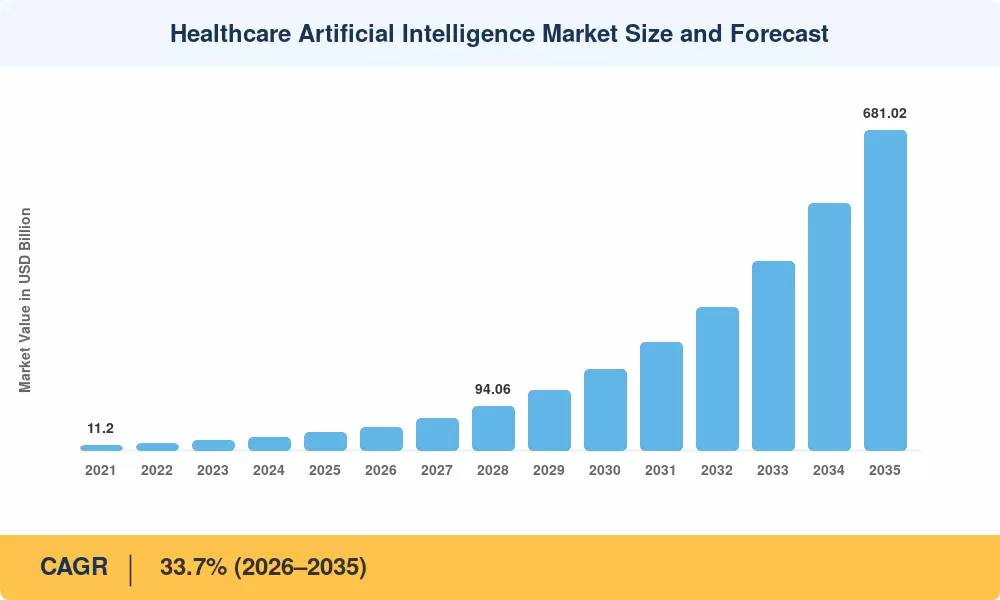
Healthcare Artificial Intelligence Market Size and Forecast
Our Impact
Enabled $4.3B Revenue Impact for Fortune 500 and Leading Multinationals
Partnering with 2000+ Global Organizations Each Year
30K+ Citations by Top-Tier Firms in the Industry

Driver Impact Analysis

Driver ~% Impact on CAGR Geographic Relevance Impact Timeline
Reimbursement pathways for algorithm-assisted diagnostics +5.8 North America, Europe Short-term (≤2 yr)
Clinician shortage and documentation burden +5.1 Global Medium-term (2–4 yr)
Cloud GPU capacity and falling inference cost +4.6 North America, Asia-Pacific Short-term (≤2 yr)
Accelerating regulatory clearance velocity +4.0 Global Medium-term (2–4 yr)
National health data infrastructure and federated learning +3.4 Asia-Pacific, Europe Long-term (≥4 yr)
Pharmaceutical R&D productivity pressure +2.9 Global Long-term (≥4 yr)
Payer fraud, waste and abuse recovery mandates +2.2 North America Medium-term (2–4 yr)


Reimbursement Finally Arrives

Money changes behaviour faster than evidence does. CMS now lists more than 20 algorithm-linked payment mechanisms across radiology, cardiology, and ophthalmology, including a coronary plaque analysis add-on reimbursed at roughly USD 950 per eligible admission [3]. Chief financial officers who ignored pilot results for five years responded within two budget cycles. Hospitals that previously classified detection software as discretionary IT spend have reclassified it as revenue-supporting clinical equipment.

Workforce Economics

Staffing is the binding constraint. The World Health Organization projects a shortfall of 11.1 million health workers by 2030, concentrated in low- and middle-income systems [7]. Ambient documentation tools now cut clinician after-hours charting by 40–60 minutes per shift in published deployments, which health systems monetise as retained physician capacity rather than as software savings. That framing has moved procurement authority from IT departments to chief medical officers.

Clearance Velocity and Compute Cost

Regulators cleared over 1,200 algorithm-enabled devices in the United States by the end of 2024, with radiology accounting for roughly three-quarters of submissions [4]. Simultaneously, per-token inference costs for clinical-grade language models fell by more than 80% between 2023 and 2025 [16]. Cheaper compute plus a predictable clearance corridor collapsed the payback period on deployment from four years to under eighteen months for high-volume imaging sites.

Pharmaceutical Pipeline Pressure

Drug developers face patent expirations covering an estimated USD 180 billion of annual revenue through 2030 [14]. Target identification and trial-site selection models have become defensive infrastructure rather than experimental spend. Several large sponsors now run protocol feasibility screening entirely on internal model stacks, compressing site-selection timelines by 30–40% and shifting budget from clinical research organisations toward licensed platforms.


Restraints Impact Analysis

Restraint ~% Impact on CAGR Geographic Relevance Impact Timeline
Patient data privacy and cross-border transfer limits −3.6 Europe, Asia-Pacific Medium-term (2–4 yr)
Algorithmic bias and post-market validation gaps −2.9 Global Long-term (≥4 yr)
Legacy electronic record interoperability debt −2.4 North America, Europe Medium-term (2–4 yr)
Reimbursement ambiguity outside imaging specialties −1.8 Global Short-term (≤2 yr)
Implementation talent scarcity and change-management cost −1.3 South America, Middle East & Africa Long-term (≥4 yr)


Privacy Architecture as a Cost Centre

Cross-border model training remains legally awkward. GDPR enforcement actions in the health sector exceeded EUR 62 million cumulatively through 2024, and the AI Act layers conformity assessment obligations on top for high-risk clinical applications [6]. Vendors now budget 8–12% of deployment cost purely for data residency engineering. Smaller developers frequently cannot absorb that overhead, which is quietly consolidating the supplier base.

Validation Debt

Peer-reviewed audits continue to find performance degradation when models move between institutions, with reported sensitivity drops of 8–15 percentage points on external cohorts [18]. Health systems have responded by demanding local silent-trial periods before go-live, adding four to nine months to each contract. That lag is the single largest gap between signed pilots and recognised revenue.

Interoperability Friction

Roughly 30% of U.S. hospitals still report significant barriers to exchanging structured clinical data with outside organisations [5]. Integration engineering consequently absorbs a disproportionate share of project budgets, which is precisely why services revenue is compounding faster than licence revenue across the forecast period.


AI In Healthcare Market Opportunities

Ambient Workflow Beyond Documentation

Documentation was the wedge; orders, coding, and discharge planning are the expansion. Systems that already deployed ambient scribes have an installed microphone and consent framework, which reduces the marginal cost of the next module to near zero. Vendors that convert single-module contracts into workflow suites will capture a disproportionate share.

Emerging-Market Diagnostic Leapfrogging

Countries without dense radiologist supply are adopting screening algorithms as primary infrastructure rather than as augmentation. India's national digital health programme has connected over 700 million health accounts, creating a screening substrate that does not exist in wealthier systems [10]. Tuberculosis, diabetic retinopathy, and cervical cancer triage are the immediate beachheads across South Asia and sub-Saharan Africa.

Data Monetisation Through Federated Consortia

Hospitals sit on assets they have never priced. Federated learning consortia let institutions contribute gradients rather than records, earning royalty participation in downstream models. Several academic networks now report per-institution annual returns in the low seven figures, a genuinely new revenue line for provider organisations [11].

Payer-Side Automation

Claims adjudication remains the least glamorous and most profitable frontier. Improper payment rates in large public programmes exceed 7%, representing tens of billions in recoverable value annually [3]. Insurers deploying detection stacks report recovery lifts of 15–22% against manual baselines.

Regulated Autonomy in Procedures

Surgical platforms are moving from telemanipulation toward supervised task autonomy for suturing and tissue retraction. Clearance precedent exists in narrow indications, and each incremental approval expands the addressable base substantially.


AI In Healthcare Market Future Outlook

Supervised Autonomy in Procedural Care

Robotic platforms will shift from full teleoperation to task-level autonomy under clinician supervision. Expect the first broad clearances for autonomous suturing and anastomosis assistance around 2029–2031, which would materially expand the procedural share of the Artificial Intelligence in Healthcare Market. Liability frameworks, not engineering, set that timeline.

Platform Economics and Pricing Compression

Per-study pricing collapses as inference costs fall. Vendors will migrate toward per-bed or per-covered-life subscriptions, and gross margins on standalone detection modules should compress from the high seventies toward the low sixties by 2032. Bundling becomes a survival strategy for mid-tier suppliers.

Sovereign Health Compute

Governments increasingly treat clinical model training as critical infrastructure. National compute allocations for health research now exceed USD 6 billion cumulatively across the OECD, and that figure understates in-kind university capacity [8]. Sovereignty requirements will fragment the vendor landscape regionally even as underlying architectures converge.

Outcome-Linked Contracting

Buyers are done paying for accuracy metrics. Contracts increasingly tie payment to length-of-stay reduction, readmission avoidance, or documented time savings, with 20–35% of contract value at risk. Predictive AI patient care programmes that cannot produce audited operational deltas will lose renewals regardless of published performance.


AI In Healthcare Market Segmentation

By Component

Segment Key Metric Primary Demand Driver
Software Solutions 42.5% share (2025) Detection, triage and documentation licences
Services 36.5% CAGR (2026–2035) Integration, validation and model retraining
Hardware USD 8.77 Billion (2025) Edge inference appliances and imaging accelerators


Software leads the Artificial Intelligence in Healthcare Market on revenue, but services tell the more interesting story. Every deployment now carries a multi-year retraining and drift-monitoring obligation that buyers cannot staff internally. That recurring engagement converts one-time projects into annuities, and it is why services growth outpaces licences across every region surveyed.

By Technology

Segment Key Metric Primary Demand Driver
Machine Learning 34.2% share (2025) Risk stratification and claims analytics
Deep Learning USD 10.00 Billion (2025) Imaging interpretation and pathology
Natural Language Processing 35.9% CAGR (2026–2035) Ambient documentation and coding
Computer Vision & Context-Aware Computing 37.8% CAGR (2026–2035) Procedural guidance and ambient clinical intelligence


Machine learning retains the largest technology share of the Artificial Intelligence in Healthcare Market because tabular risk models remain the workhorse of payer and population health operations. Context-aware computing grows fastest, drawing on sensor fusion in operating theatres and intensive care units where models must reason over environment state rather than a single study.

By Application

Segment Key Metric Primary Demand Driver
Robot-Assisted Surgery USD 7.88 Billion (2025) Procedure volume growth and autonomy features
Automated Image Diagnosis 16.4% share (2025) Reimbursed triage in radiology and cardiology
Clinical Trial Optimisation 13.9% share (2025) Site selection and protocol feasibility
Preliminary Diagnosis 34.4% CAGR (2026–2035) Primary care triage and symptom assessment
Administrative Workflow Assistance 11.5% share (2025) Prior authorisation and revenue cycle
Virtual Nursing Assistants USD 3.66 Billion (2025) Post-discharge monitoring
Dosage Error Reduction 8.6% share (2025) Pharmacy verification and infusion safety
Fraud Detection & Cybersecurity 35.7% CAGR (2026–2035) Payer recovery mandates and ransomware exposure


Robot-assisted surgery is the largest application within the Artificial Intelligence in Healthcare Market by value. However, most of that revenue still attaches to platform hardware and consumables rather than to the algorithmic layer. Fraud detection compounds fastest, driven by payer economics that produce measurable recoveries within a single fiscal year.

By End User

Segment Key Metric Primary Demand Driver
Pharmaceutical & Biotechnology Companies 30.3% share (2025) Discovery and trial productivity pressure
Healthcare Providers USD 10.79 Billion (2025) Diagnostic throughput and workforce shortage
Healthcare Payers 19.4% share (2025) Claims automation and risk adjustment
Patient & Consumer Platforms 37.9% CAGR (2026–2035) Remote monitoring and digital front doors
Others 7.8% share (2025) Research institutes and public health agencies


Pharmaceutical and biotechnology buyers lead spending because their return calculation is cleaner than a hospital's: a shortened trial timeline has an unambiguous net present value. Provider adoption follows reimbursement rather than evidence, which is why provider revenue accelerates sharply after 2026 in this model.


Regional Market Share Analysis

Region Key Metric Primary Investment Themes
North America 48.5% share (2025) Reimbursed imaging triage, payer automation, ambient documentation
Europe USD 7.50 Billion (2025) AI Act conformity, hospital digitisation funds, pathology
Asia-Pacific 37.4% CAGR (2026–2035) National data exchanges, screening at scale, domestic model stacks
South America USD 1.53 Billion (2025) Public-hospital triage, telemedicine augmentation
Middle East & Africa 3.1% share (2025) Sovereign AI programmes, greenfield hospital builds
Total USD 37.33 Billion (2025)

Regional performance in the Artificial Intelligence in Healthcare Market diverges sharply on reimbursement maturity rather than on technical capability.


North America

Country Key Metric Key Driver
US 88.4% of regional revenue CMS add-on payments and dense GPU capacity
Canada USD 1.32 Billion (2025) Provincial diagnostic backlog reduction programmes
Mexico 31.6% CAGR (2026–2035) IMSS digitisation and private hospital expansion


The United States anchors the Artificial Intelligence in Healthcare Market because payment, clearance, and compute converge in one jurisdiction. More than 1,200 cleared algorithm-enabled devices are now marketed domestically, and the ASTP/ONC HTI-1 rule requires certified record systems to disclose predictive model attributes, which paradoxically accelerated adoption by giving buyers a transparency artefact to audit [4][5]. Canada moves slower on procurement but faster on public-sector imaging consolidation.

Europe

Country Key Metric Key Driver
Germany 23.8% of regional revenue Krankenhauszukunftsfonds hospital digitisation grants
UK USD 1.34 Billion (2025) NHS diagnostic imaging network and stroke triage rollout
France 13.1% of regional revenue Health Data Hub research access
Italy 9.4% of regional revenue PNRR recovery-fund telemedicine allocation
Spain 8.2% of regional revenue Regional pathology digitisation
Nordic Countries 34.1% CAGR (2026–2035) Population registries and mature consent infrastructure
Russia USD 0.31 Billion (2025) State radiology reference service
Rest of Europe 8.9% of regional revenue Cross-border reference imaging


Germany's hospital future fund committed roughly EUR 4.3 billion in matched federal and state capital, a meaningful share of which flowed into diagnostic and documentation software [9]. England's stroke triage deployment now covers the large majority of acute trusts and has become the reference case European buyers cite when negotiating outcome-linked contracts [12].

Asia-Pacific

Country Key Metric Key Driver
China 38.7% of regional revenue NMPA clearance pipeline and domestic model stacks
India 41.9% CAGR (2026–2035) Ayushman Bharat Digital Mission health account scale
Japan USD 1.71 Billion (2025) Ageing population and MHLW reimbursement codes
South Korea 11.2% of regional revenue K-Health data platform and hospital-vendor joint ventures
ASEAN USD 0.83 Billion (2025) Tele-radiology hub models
Rest of Asia-Pacific 6.4% of regional revenue Screening programmes in Oceania


Asia-Pacific is the fastest-growing block in the Artificial Intelligence in Healthcare Market largely because regulators there approved clinical algorithms before Western payers agreed to fund them. China's NMPA has cleared well over 100 Class III algorithm-enabled devices, and Japan added dedicated technical fees for computer-aided detection in its biennial fee revision [10][13]. India's scale is the outlier variable that could reprice the entire region.

South America

Country Key Metric Key Driver
Brazil 62.3% of regional revenue SUS teleradiology contracts and ANVISA clearances
Argentina USD 0.21 Billion (2025) Private-insurer diagnostic partnerships
Rest of South America 24.0% of regional revenue Chilean and Colombian hospital modernisation


Brazil dominates regional demand within the Artificial Intelligence in Healthcare Market through public-system teleradiology, where a small number of centralised reading centres serve thousands of remote units [15]. Currency volatility remains the chief commercial obstacle, pushing vendors toward local-currency subscription pricing rather than dollar-denominated perpetual licences.

Middle East & Africa

Country Key Metric Key Driver
Saudi Arabia 34.7% of regional revenue Vision 2030 health cluster digitisation and SDAIA programmes
UAE USD 0.29 Billion (2025) Malaffi and Riayati health information exchanges
South Africa 14.2% of regional revenue Tuberculosis screening deployments
Egypt 39.8% CAGR (2026–2035) Universal health insurance rollout
Rest of MEA 11.6% of regional revenue Donor-funded screening in sub-Saharan Africa


Gulf states buy differently from everyone else in the Artificial Intelligence in Healthcare Market: greenfield hospital construction means no legacy integration debt, so deployment timelines run half as long. Saudi Arabia's health cluster restructuring explicitly names algorithmic triage in its operating model, and sovereign compute investment removes the hosting constraint that slows African deployments [17].


Healthcare Artificial Intelligence Market By Region, 2025-2035

Competitive Benchmarking

Concentration level is poor. Market Research Future (MRFR) forecasts a CAGR of Herfindahl-Hirschman Index of about 620, with the top five suppliers representing about 34-39% of total sales. Fragmentation remains in surgical robots, claims analytics and pathology, which require unrelated data assets, clearance paths and buyer relationships. No single vendor credibly covers all of them, and attempts to do so via acquisition have often resulted in weakly fragmented portfolios rather than integrated platforms.

Company Est. Revenue Share Range Key Offerings for Artificial Intelligence in Healthcare Market Strategic Positioning
NVIDIA Corporation ~10–13% Clinical inference accelerators, medical imaging SDKs, federated training frameworks Infrastructure layer; captures value regardless of application winner
Microsoft Corporation ~8–11% Ambient clinical documentation, cloud health data services, coding automation Distribution advantage through existing enterprise agreements
Alphabet Inc. (Google Health) ~5–8% Screening models, medical language models, imaging research platforms Research depth; commercialisation via cloud partnerships
Siemens Healthineers AG ~5–7% Imaging-embedded detection, workflow orchestration, digital twin tools Installed modality base as deployment channel
GE HealthCare Technologies ~4–7% Scanner-native reconstruction, cardiac and neuro triage, edge appliances Hardware-software bundling at point of acquisition
Koninklijke Philips N.V. ~4–6% Monitoring analytics, radiology workflow, oncology pathways Acute-care monitoring franchise
Medtronic plc ~3–5% Surgical guidance, endoscopy detection, closed-loop therapy Procedural autonomy roadmap
Oracle Corporation (Oracle Health) ~3–5% Record-embedded analytics, revenue cycle automation Leverages record system incumbency
International Business Machines ~2–4% Life sciences discovery tooling, governance and audit frameworks Repositioned toward assurance and compliance
Intuitive Surgical Inc. ~2–4% Robotic surgical platforms, intraoperative analytics Deepest procedural dataset in surgery
Tempus AI Inc. ~1–3% Oncology sequencing analytics, real-world evidence Data-asset differentiation in precision oncology
Aidoc Medical ~1–3% Acute triage suite, deployment orchestration platform Multi-vendor marketplace strategy


Recent News & Developments

  • U.S. Food and Drug Administration (January 2025): Published updated lifecycle management guidance for adaptive algorithms, clarifying predetermined change control plans and reducing resubmission burden for model updates [4].
  • European Commission (August 2024): The AI Act entered into force, placing most clinical decision tools in the high-risk category with staged obligations through 2027 [6].
  • NVIDIA and leading health systems (March 2024): Expanded a federated imaging collaboration spanning multiple academic centres, enabling multi-institution training without record transfer [11].
  • Microsoft (September 2023): Completed integration of ambient documentation into major electronic record workflows, moving the category from pilot to enterprise deployment [16].
  • GE HealthCare (June 2024): Acquired a cardiac imaging analytics developer to embed quantification directly into scanner reconstruction pipelines [20].
  • Centers for Medicare & Medicaid Services (October 2024): Extended add-on payment eligibility to additional algorithm-assisted diagnostic procedures in the inpatient prospective payment rule [3].
  • India Ministry of Health (February 2025): Announced national screening expansion using automated chest radiograph interpretation across public tuberculosis programmes [10].
  • Medtronic (November 2024): Received clearance for expanded intraoperative detection indications in gastrointestinal endoscopy, broadening procedural coverage [21].


AI In Healthcare Market Report Scope

Parameter Detail
Market Scope Global Artificial Intelligence in Healthcare Market across component, technology, application, end user and geography
Study Period 2021–2035 (Historical 2021–2024; Base Year 2025; Forecast 2026–2035)
CAGR 33.7% (2026–2035)
Market Size Checkpoints USD 37.33 Billion (2025); USD 49.86 Billion (2026); USD 681.02 Billion (2035)
Fastest Growing Segments Services (component); Computer Vision & Context-Aware Computing (technology); Patient & Consumer Platforms (end user)
Companies Profiled 12 major suppliers including NVIDIA, Microsoft, Alphabet, Siemens Healthineers, GE HealthCare, Philips, Medtronic, Oracle Health, IBM, Intuitive Surgical, Tempus AI, Aidoc
Valuation Currency USD Billion, constant 2025 dollars

FAQs

What procurement red flags should buyers watch for when evaluating vendors in the Artificial Intelligence in Healthcare Market?
Watch for validation cohorts drawn only from the vendor's development sites. Demand external test results and a written drift-monitoring commitment before signing [18].
How should health systems budget for the hidden costs of deployment?
Allocate roughly 40% of total programme cost to integration, silent-trial validation, and clinician training rather than licensing. Most overruns come from interface engineering, not software fees [5].
Does the Artificial Intelligence in Healthcare Market favour best-of-breed tools or single-platform suites?
Best-of-breed still wins on clinical performance in narrow indications. Suites win on total cost once a system runs more than five concurrent models.
What liability exposure do clinicians carry when following algorithmic recommendations?
Liability generally remains with the clinician in most jurisdictions, since these tools are regulated as decision aids rather than autonomous practitioners. Documentation of independent clinical reasoning remains essential [6].
Which contracting model produces the best outcomes?
Outcome-linked contracts with 20–35% of value at risk against operational metrics outperform flat subscriptions. They force vendors to support adoption rather than just delivery.
How does the EU AI Act change vendor selection in the Artificial Intelligence in Healthcare Market?
High-risk classification requires conformity assessment, technical documentation, and post-market monitoring. Buyers should require proof of assessment readiness in tender responses [6].
Are open-weight clinical models viable alternatives to commercial platforms?
They are viable for research and internal tooling but rarely for regulated diagnostic use, since clearance attaches to a specific validated configuration. AI clinical decision support deployed clinically almost always requires a regulated commercial pathway [4].    
Author
Author
Author Profile
Rahul Gotadki LinkedIn
Research Manager
He holds an experience of about 9+ years in Market Research and Business Consulting, working under the spectrum of Life Sciences and Healthcare domains. Rahul conceptualizes and implements a scalable business strategy and provides strategic leadership to the clients. His expertise lies in market estimation, competitive intelligence, pipeline analysis, customer assessment, etc.
Co-Author
Co-Author Profile
Kinjoll Dey LinkedIn
Senior Research Analyst
He is an extremely curious individual currently working in Healthcare and Medical Devices Domain. Kinjoll is comfortably versed in data centric research backed by healthcare educational background. He leverages extensive data mining and analytics tools such as Primary and Secondary Research, Statistical Analysis, Machine Learning, Data Modelling. His key role also involves Technical Sales Support, Client Interaction and Project management within the Healthcare team. Lastly, he showcases extensive affinity towards learning new skills and remain fascinated in implementing them.
Share::
Request Free Sample

Research Approach


Secondary Research

The secondary research process involved comprehensive analysis of regulatory databases, peer-reviewed medical journals, AI research publications, and authoritative health technology organizations. Key sources included the US Food & Drug Administration (FDA) [AI/ML-Based Medical Devices Database], European Medicines Agency (EMA) [AI Innovation Board Guidelines], HealthIT.gov [Office of the National Coordinator for Health Information Technology], National Institutes of Health (NIH) [National Library of Medicine AI in Healthcare Archives], Healthcare Information and Management Systems Society (HIMSS), Radiological Society of North America (RSNA) [AI Imaging Standards], Advanced Medical Technology Association (AdvaMed), Organization for Economic Co-operation and Development (OECD) [Health Statistics], World Health Organization (WHO) [Global Strategy on Digital Health], UN International Telecommunication Union (ITU) [AI for Health Framework], National Health Service (NHS) England [AI Lab Publications], European Commission [High-Level Expert Group on AI Documents], and national AI strategy reports from key markets. These sources were used to collect algorithmic approval data, clinical validation studies, deployment statistics, regulatory pathway analysis, and technology landscape mapping for machine learning platforms, natural language processing tools, computer vision systems, and deep learning diagnostic applications.


Primary Research

To gather both qualitative and quantitative information, the primary research process involved interviewing players from both the supply and demand sides. On the supply side, we found healthcare AI developers, medical imaging software providers, and health IT manufacturers, as well as chief technology officers (CTOs), heads of artificial intelligence strategy, managers of regulatory affairs, and sales leaders from these companies. In terms of demand-side sources, we have CMIOs, CDOs, radiology department heads, hospital IT directors, procurement leaders from IDNs, research directors from pharmaceutical companies and academic medical institutes, and others. Through primary research, we were able to confirm the development timelines of AI algorithms, validate the market segmentation across medical imaging and clinical decision support applications, and gain insights into the barriers to clinical adoption, costs of integration with existing EHR systems, and reimbursement pathways for AI-driven diagnostics.

Primary Respondent Breakdown:

By Designation: C-level & Board Level (40%), Director & VP Level (30%), Manager & Technical Leads (30%)

By Region: North America (40%), Europe (25%), Asia-Pacific (28%), Rest of World (7%)


Market Size Estimation

Global market valuation was derived through revenue mapping and deployment volume analysis. The methodology included:

Identification of 60+ key technology developers and healthcare AI vendors across North America, Europe, Asia-Pacific, and Middle East

Product mapping across machine learning platforms, natural language processing tools, computer vision systems, deep learning algorithms, and robotic process automation

Analysis of reported and modeled annual revenues specific to healthcare AI portfolios, including software licensing, platform subscriptions, and professional services

Coverage of manufacturers and software vendors representing 75-80% of global market share in 2024

Extrapolation using bottom-up (deployment volume × Average Selling Price by clinical application and care setting) and top-down (vendor revenue validation against health system IT spending) approaches to derive segment-specific valuations for medical imaging AI, clinical decision support systems, drug discovery platforms, and administrative workflow automation tools.

Share::
Request Free Sample
Download Free Sample

Kindly complete the form below to receive a free sample of this Report

* Please use a valid business email

Share::
Request Free Sample
Download PDF ×

We do not share your information with anyone. However, we may send you emails based on your report interest from time to time. You may contact us at any time to opt-out.
















