Herbal Beauty Products Market (2026 - 2035)

Herbal Beauty Products Market Size, Share, Industry Trend & Analysis Research Report By Product Type (Personal Care Products, Cosmetics/Make-up Products), By Category (Mass, Premium), By Distribution Channel (Supermarkets/Hypermarkets, Health and Beauty Stores, Online Retail Stores, Other Distribution Channels), By Geography (North America, Europe, Asia-Pacific, South America, Middle East & Africa) - Forecast to 2035.
ID: MRFR/CG/10792-HCR
128 Pages
Snehal Singh
Last Updated: July 13, 2026
Herbal Beauty Products Market
Market Size
Forecast Period2026-2035
CAGR (2026-2035)6.80%
2025 Market SizeUSD 101.90 Billion
2035 Market SizeUSD 196.54 Billion
Key Players
Himalaya Wellness
Dabur India Ltd.
Patanjali Ayurved
Natura & Co
L'Occitane en Provence
Burt's Bees
Opportunities
  • Biofermented Botanical Actives
  • Halal and Ethical Beauty in Emerging Markets
  • Personalized Herbal Skincare via AI Diagnostics

Herbal Beauty Products Market Summary

The Herbal Beauty Products Market reached an estimated USD 101.90 Billion in 2025 and is projected to grow from USD 108.83 Billion in 2026 to USD 196.54 Billion by 2035, registering a CAGR of 6.80% during the forecast period. Consumer migration away from synthetic formulations has accelerated under tighter ingredient-safety regulations — the EU's updated Cosmetics Regulation now restricts over 2,700 substances, and India's AYUSH Ministry has expanded quality-certification mandates for herbal exports, channeling investment toward standardized botanical supply chains [1][2].

A broader transformation is reshaping how brands develop and position herbal formulations. Legacy trial-and-error R&D is giving way to AI-assisted ingredient screening and clinical-grade efficacy testing, with the global botanical ingredients sector attracting over USD 4.2 billion in venture and corporate funding between 2022 and 2024 [3]. This shift has elevated consumer expectations: shoppers now demand third-party certifications and ingredient traceability, not just "natural" label claims. The Herbal Beauty Products Market is responding with blockchain-enabled supply-chain platforms and standardized biomarker testing that validate botanical potency at each production stage.

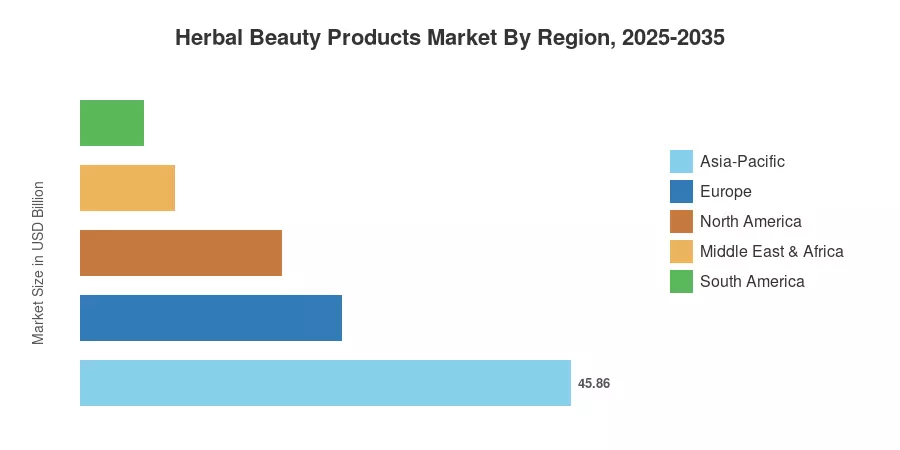
Asia-Pacific commands approximately 45.0% of the Herbal Beauty Products Market, driven by deep-rooted Ayurvedic and traditional Chinese medicine heritage combined with a rapidly expanding middle class. The Middle East & Africa region is the fastest-growing at an 8.60% CAGR through 2035, supported by rising halal-certified beauty demand and improving retail infrastructure. Europe holds the second-largest share at roughly 24.0%, anchored by stringent clean-label preferences and premium positioning. Over the next decade, digital-first distribution and personalized herbal regimens will redefine competitive dynamics across the Herbal Beauty Products Market.


Key Report Takeaways

• By Product Type

  • Personal care products dominated the Herbal Beauty Products Market with approximately 87% revenue share in 2025, reflecting broad adoption of herbal shampoos, body washes, and skincare lines.
  • Cosmetics and make-up products are forecast to expand at a 9.62% CAGR through 2035 as color cosmetics infused with botanical actives gain shelf space globally.

• By Category

  • The mass segment accounted for roughly 65% of the Herbal Beauty Products Market in 2025, supported by price-sensitive emerging-market demand.
  • The premium segment is projected to grow at a 9.14% CAGR through 2035 as affluent consumers prioritize clinical-grade herbal formulations.

• By Distribution Channel

  • Health and beauty stores captured an estimated 30% share of the Herbal Beauty Products Market in 2025.
  • Online retail stores are advancing at an 8.32% CAGR through 2035, fueled by DTC subscription models and social commerce.

• By Region

  • Asia-Pacific accounted for roughly 45.0% of the Herbal Beauty Products Market in 2025.
  • The Middle East & Africa region is expanding at an 8.60% CAGR through 2035, the fastest among all regions.


Market Size and Forecast (2021–2035)

Market Research Future employs a triangulated approach combining top-down revenue modeling, bottom-up product-level tracking across 42 countries, and validation interviews with industry executives. Historical data draws from customs databases, company filings, and trade association registries, while forecast projections integrate macroeconomic indicators, regulatory pipeline analysis, and proprietary consumer-sentiment surveys.
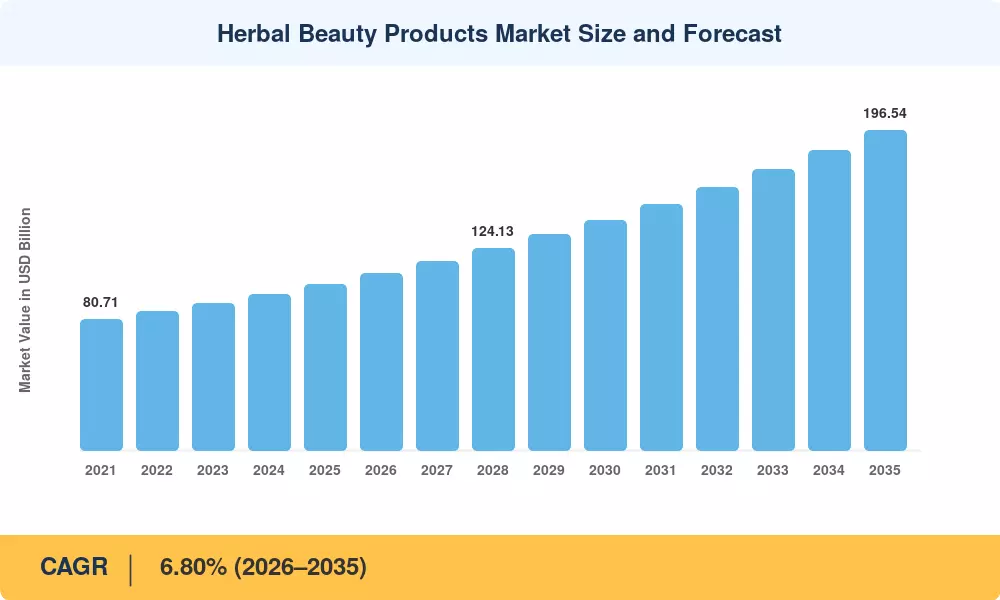
Herbal Beauty Products Market Size and Forecast
Our Impact
Enabled $4.3B Revenue Impact for Fortune 500 and Leading Multinationals
Partnering with 2000+ Global Organizations Each Year
30K+ Citations by Top-Tier Firms in the Industry

Driver Impact Analysis

Driver ~% Impact on CAGR Geographic Relevance Impact Timeline
Tightening synthetic-ingredient bans ~18% EU, North America Short-term (≤2 yr)
Rising Ayurveda and TCM institutionalization ~16% Asia-Pacific Medium-term (2–4 yr)
DTC and social commerce expansion ~14% Global Short-term (≤2 yr)
Clinical validation of botanical efficacy ~13% North America, Europe Medium-term (2–4 yr)
Premiumization and clean-label positioning ~12% Europe, North America Long-term (≥4 yr)
Halal and ethical beauty certification growth ~10% MEA, ASEAN Medium-term (2–4 yr)
Sustainable sourcing and circular packaging mandates ~9% EU, South America Long-term (≥4 yr)


Tightening Synthetic-Ingredient Bans

The EU Cosmetics Regulation revision of 2024 added 14 new restricted substances, bringing the total above 2,700 — a regulatory wall that forces reformulation toward plant-derived alternatives [1]. In the United States, the Modernization of Cosmetics Regulation Act (MoCRA) has imposed mandatory adverse-event reporting since 2023, raising compliance costs for synthetic-heavy portfolios and making herbal formulations economically attractive for mid-tier brands entering the Herbal Beauty Products Market. These parallel regulatory thrusts have compressed product-development timelines, as brands rush to certify compliant botanicals.

Rising Ayurveda and TCM Institutionalization

India's AYUSH Ministry allocated INR 3,050 crore (approximately USD 365 million) in its 2024–25 budget to promote Ayurvedic product standardization and export infrastructure [2][5]. China's State Administration of Traditional Chinese Medicine simultaneously expanded its quality-traceability platform to cover over 600 botanical raw materials. Together, these government-backed initiatives legitimize herbal beauty claims with clinical-level documentation, lifting consumer confidence and enabling premium pricing strategies across the Herbal Beauty Products Market.

DTC and Social Commerce Expansion

In 2024, the global sales of beauty products through social commerce surpassed USD 62 billion, with homeopathic and clean-beauty SKUs growing at a rate that is 2.4 times faster than conventional alternatives on platforms such as TikTok Shop, Instagram Checkout, and Meesho [6]. A discovery channel has been established in China, India, and Southeast Asia, where ingredient storytelling directly leads to conversion through live-streaming product demonstrations. Botanical-origin narratives are inherently visual and communicable, which is why the Herbal Beauty Products Market benefits disproportionately from this format.


Clinical Validation of Botanical Efficacy

Peer-reviewed publications on phytochemical actives in skincare grew 38% between 2021 and 2024, with dermatology journals publishing over 1,200 studies on turmeric, neem, centella, and tea-tree oil efficacy [7]. This evidence base transforms consumer perception from folklore to science-backed performance, enabling herbal brands within the Herbal Beauty Products Market to compete head-to-head with pharmaceutical skincare lines on claims of anti-aging, anti-acne, and barrier repair.


Restraints Impact Analysis

Restraint ~% Negative Impact on CAGR Geographic Relevance Impact Timeline
Botanical supply-chain volatility ~–20% Global Short-term (≤2 yr)
Regulatory fragmentation across geographies ~–18% Cross-regional Medium-term (2–4 yr)
Shelf-life and stability limitations ~–15% Emerging markets Short-term (≤2 yr)
Consumer skepticism toward greenwashing ~–12% North America, Europe Medium-term (2–4 yr)
Higher production costs versus synthetics ~–10% Global Long-term (≥4 yr)


Botanical Supply-Chain Volatility

Climate disruption has directly impacted yields of critical botanicals — Indian sandalwood output declined an estimated 12% between 2022 and 2024 due to erratic monsoon patterns, while Moroccan argan oil production dropped 15% during drought years [11]. These supply shocks create price spikes that squeeze margins for brands in the Herbal Beauty Products Market, particularly mass-segment players with thin pricing buffers. The absence of commodity-grade futures markets for most botanical compounds compounds the problem, leaving procurement teams reliant on spot-market negotiations.

Regulatory Fragmentation

A herbal skincare product approved for sale in India under AYUSH norms may require entirely different dossier submissions for the EU (under the CosIng database framework), the US (under FDA MoCRA), and ASEAN (under the ASEAN Cosmetic Directive) [12]. This fragmentation raises compliance costs by an estimated 18–25% for brands targeting multi-regional distribution within the Herbal Beauty Products Market, discouraging smaller players from scaling internationally and creating competitive moats for multinationals with dedicated regulatory affairs teams.

Consumer Skepticism Toward Greenwashing

According to a 2024 consumer survey, 47% of beauty customers in the United States are skeptical of "natural" or "herbal" marketing claims unless they are supported by third-party certification [14]. The scrutiny has been intensified as a result of high-profile enforcement actions, such as the Federal Trade Commission's warnings against unsubstantiated botanical efficacy claims. Brands in the Herbal Beauty Products Market are currently under pressure to invest in transparent certifications, including USDA Organic, Ecocert, and COSMOS, which will increase the cost of product development by 8–12%.


Herbal Beauty Products Market Opportunities

Biofermented Botanical Actives

Fermentation technology applied to traditional herbs (turmeric, ginseng, rice bran) enhances bioavailability by up to 300%, creating next-generation actives that outperform raw extracts in clinical trials [7]. Brands that invest in proprietary fermentation IP can command 30–40% price premiums while differentiating within the Herbal Beauty Products Market.

Halal and Ethical Beauty in Emerging Markets

The global halal cosmetics sector is projected to exceed USD 95 billion by 2030, and herbal formulations inherently align with halal ingredient requirements [9]. The Herbal Beauty Products Market stands to capture a significant share in the Middle East, North Africa, and ASEAN by co-certifying products as both halal and organic, addressing two consumer priorities simultaneously.

Personalized Herbal Skincare via AI Diagnostics

AI-powered skin-analysis apps have surpassed 200 million downloads globally, and integrating these platforms with customized herbal-serum dispensing systems represents a high-margin DTC opportunity [6]. Subscription-based personalized regimens could drive recurring revenue and reduce churn for digitally native brands in the Herbal Beauty Products Market.

Herbal Beauty Data Monetization and B2B Ingredient Platforms

As B2B SaaS models, ingredient-intelligence platforms that consolidate regulatory status, efficacy data, and sourcing costs across hundreds of botanicals are emerging. Companies have the ability to monetize proprietary formulation databases, which allows contract manufacturers and indie brands to expedite product development in the Herbal Beauty Products Market.


Circular Packaging and Refill Systems

The EU's Packaging and Packaging Waste Regulation (PPWR) mandates reusable packaging targets by 2030, creating an opening for refillable herbal skincare systems that reduce single-use plastic by up to 70% [10]. Early movers establishing refill infrastructure gain brand loyalty and regulatory compliance advantages in the Herbal Beauty Products Market.


Herbal Beauty Products Market Future Outlook

AI-Driven Formulation and Personalization

By 2030, product development cycles will be reduced from 18 months to under 6 months by machine-learning platforms that are capable of screening thousands of botanical compounds against skin-microbiome profiles [3]. The Herbal Beauty Products Market will increasingly favour brands that integrate clinically validated herbal actives with algorithmic formulations, thereby blurring the distinction between dermatological therapeutics and beauty.


Platform Economics and DTC Subscription Models

By 2032, an estimated 35% of herbal skincare revenue in developed markets will flow through subscription and auto-replenishment channels, driven by personalized diagnostic apps that lock in recurring purchases [6]. The Herbal Beauty Products Market will reward platform operators who aggregate ingredient data, customer profiles, and logistics into unified ecosystems.

ESG and Sustainability Reporting as Competitive Differentiators

The EU Corporate Sustainability Reporting Directive (CSRD) will require full supply-chain emissions and biodiversity-impact disclosure from beauty companies operating in Europe by 2028 [10]. Within the Herbal Beauty Products Market, brands with traceable, regeneratively sourced botanical supply chains will convert compliance obligations into marketing advantages.

Regenerative Agriculture and Botanical IP

Regenerative farming practices applied to medicinal herb cultivation can sequester 3–8 tonnes of CO₂ per hectare annually while improving active-compound yields by 15–20% [18]. Companies that secure long-term regenerative-sourcing agreements and patent proprietary botanical cultivars will build durable moats in the Herbal Beauty Products Market.


Herbal Beauty Products Market Segmentation

By Product Type

Segment Key Metric Primary Demand Driver
Personal Care Products ~87% share (2025) Broad consumer adoption across hair, body, and skincare
Cosmetics/Make-up Products 9.62% CAGR (2026–2035) Botanical-infused color cosmetics gaining mainstream traction


Personal care products anchor the Herbal Beauty Products Market, spanning herbal shampoos, conditioners, body washes, and facial cleansers that have migrated from specialty shelves to mass retail. Established brands like Himalaya and Dabur have built extensive personal-care portfolios that reach price-sensitive consumers across South Asia, Southeast Asia, and Africa.

Cosmetics and make-up products represent the faster-growing frontier within the Herbal Beauty Products Market. Herbal foundations, lip products infused with plant-based pigments, and mineral-botanical hybrid formulations are converting consumers who previously viewed natural cosmetics as underperforming. Clinical studies demonstrating that turmeric-based concealers and centella-infused primers match synthetic alternatives in wear time and coverage have been pivotal [7].

By Category

Segment Key Metric Primary Demand Driver
Mass ~65% share (2025) Emerging-market volume and accessibility
Premium 9.14% CAGR (2026–2035) Clinical-grade formulations and luxury positioning


The mass segment commands the majority of the Herbal Beauty Products Market through affordable herbal products priced for daily use in high-population markets. Premium herbal beauty — defined by organic certifications, clinical efficacy data, and luxury packaging — is growing faster as affluent consumers in North America, Europe, and East Asia treat herbal skincare as a wellness investment rather than a commodity purchase.

By Distribution Channel

Segment Key Metric Primary Demand Driver
Supermarkets/Hypermarkets ~28% share (2025) Impulse purchasing and broad visibility
Health and Beauty Stores ~30% share (2025) Expert curation and trial experiences
Online Retail Stores 8.32% CAGR (2026–2035) DTC brands, social commerce, subscription models
Other Distribution Channels USD 12.22 Billion (2025) Pharmacies, specialty boutiques, direct selling


Online retail is the fastest-growing channel in the Herbal Beauty Products Market, benefiting from ingredient-education content that converts browsers into buyers. Health and beauty stores retain the largest single-channel share thanks to in-store sampling and staff recommendations, which remain critical for herbal product trial.


Regional Market Share Analysis

Region Key Metric Primary Investment Themes
Asia-Pacific 45.0% share (2025) Ayurveda/TCM institutionalization, social commerce
Europe USD 24.46 Billion (2025) Clean-label regulation, premium positioning
North America 18.5% share (2025) MoCRA compliance, clinical-grade botanicals
South America 5.76% CAGR (2026–2035) Biodiversity-sourced actives, sustainable harvesting
Middle East & Africa 8.60% CAGR (2026–2035) Halal certification, youth-driven demand
Total USD 101.90 Billion (2025)

The Herbal Beauty Products Market exhibits distinct regional dynamics shaped by cultural heritage, regulatory environments, and consumer purchasing power. Asia-Pacific remains the clear leader, while the Middle East & Africa region is gaining ground rapidly on the strength of halal beauty demand and youth demographics.


North America

Country Key Metric Key Driver
US 72% of regional share MoCRA-driven reformulation toward botanicals
Canada 6.42% CAGR (2026–2035) Cannabis-infused herbal skincare innovation
Mexico USD 1.82 Billion (2025) Traditional herbal medicine modernization


The US dominates North America's Herbal Beauty Products Market as MoCRA compliance pushes mainstream brands to reformulate with verified botanical actives. Canada's cannabis-adjacent regulatory infrastructure has created a unique corridor for hemp- and CBD-infused herbal beauty products, while Mexico's rich ethnobotanical heritage is being commercialized through partnerships between indigenous cooperatives and international distributors [12][16].

Europe

Country Key Metric Key Driver
Germany 22% of regional share COSMOS/Ecocert certification leadership
UK USD 4.18 Billion (2025) Premium Ayurvedic brand penetration
France 7.15% CAGR (2026–2035) Luxury botanical skincare heritage
Italy 11% of regional share Mediterranean botanical ingredient sourcing
Spain USD 1.67 Billion (2025) Olive- and aloe-based formulation clusters
Nordic Countries 6.92% CAGR (2026–2035) Sustainability-first consumer expectations
Russia 5% of regional share Domestic herbal formulation manufacturing
Rest of Europe USD 2.41 Billion (2025) Emerging clean-beauty retail channels


Europe's regulatory environment — anchored by the EU Cosmetics Regulation and its 2,700+ restricted-substance list — has made the region a global benchmark for herbal product quality within the Herbal Beauty Products Market [1]. Germany's certification ecosystem and France's luxury positioning create complementary demand pillars, while the UK has emerged as a gateway for Ayurvedic brands entering Western markets.

Asia-Pacific

Country Key Metric Key Driver
China 31% of regional share TCM modernization and domestic beauty nationalism
India 8.94% CAGR (2026–2035) AYUSH-backed Ayurvedic export infrastructure
Japan USD 5.12 Billion (2025) Fermented botanical skincare innovation
South Korea 14% of regional share K-beauty herbal ingredient fusion
ASEAN 7.58% CAGR (2026–2035) Cross-border e-commerce and halal beauty demand
Rest of Asia-Pacific USD 2.89 Billion (2025) Traditional medicine commercialization


Asia-Pacific's leadership in the Herbal Beauty Products Market reflects millennia of traditional medicine practice now converging with modern manufacturing scale. China's "beauty nationalism" movement has elevated domestic herbal brands to premium status, while India's AYUSH certification framework is transforming cottage-industry Ayurvedic production into export-grade operations [2][5].

South America

Country Key Metric Key Driver
Brazil 68% of regional share Amazon biodiversity-sourced botanicals
Argentina USD 0.72 Billion (2025) Patagonian herb cultivation
Rest of South America 6.18% CAGR (2026–2035) Andean botanical ingredient development


Brazil's unparalleled botanical biodiversity — the Amazon basin contains over 80,000 plant species — gives the country a structural advantage in the Herbal Beauty Products Market. Natura & Co has demonstrated that vertically integrated, sustainably sourced herbal supply chains can achieve global premium positioning, a model now being replicated by emerging Brazilian beauty startups [17].

Middle East & Africa

Country Key Metric Key Driver
Saudi Arabia 28% of regional share Vision 2030 beauty-sector investment
UAE USD 1.24 Billion (2025) Luxury halal beauty retail hub
South Africa 7.42% CAGR (2026–2035) Indigenous botanical IP commercialization
Egypt 12% of regional share Traditional herbal remedy modernization
Rest of MEA USD 1.86 Billion (2025) Youth-driven herbal beauty adoption


The Middle East & Africa region is the fastest-growing geography in the Herbal Beauty Products Market, driven by a median population age below 25 and expanding halal-certification infrastructure [9]. Saudi Arabia's Vision 2030 initiative has allocated significant funding to domestic cosmetics manufacturing, while the UAE serves as a regional re-export hub for herbal beauty brands targeting Gulf and African consumers.


Herbal Beauty Products Market By Region, 2025-2035

Competitive Benchmarking

The Herbal Beauty Products Market exhibits low concentration, with the top five players holding an estimated 18–24% combined revenue share. The Herfindahl-Hirschman Index (HHI) sits below 500, confirming a fragmented competitive structure where regional champions, indie startups, and diversified multinationals coexist. Brand authenticity, ingredient traceability, and regulatory-certification portfolios serve as the primary competitive differentiators.

Company Est. Revenue Share Range Key Offerings Strategic Positioning
Himalaya Wellness ~4–6% Neem, turmeric, and Ayurvedic skincare lines Mass-market leader in South Asia with expanding global footprint
Dabur India Ltd. ~3–5% Vatika, Gulabari, herbal oral care Integrated Ayurvedic FMCG conglomerate
Patanjali Ayurved ~3–5% Saundarya, Aloe Vera gel, herbal hair care Value positioning with domestic-nationalism appeal
Natura & Co ~2–4% The Body Shop, Aesop, botanical body care Sustainability-led portfolio with Amazon-sourced botanicals
L'Occitane en Provence ~2–3% Shea butter, lavender, immortelle skincare French luxury positioning with traceable ingredient sourcing
Burt's Bees (Clorox Co.) ~2–3% Lip balms, facial cleansers, body lotions Natural mass-market entry point in North America
Shiseido Company ~1–3% WASO, botanical-infused J-beauty lines Premium R&D-driven formulations with Asian herb expertise
Forest Essentials ~1–2% Luxury Ayurvedic facial care, body oils Ultra-premium Ayurvedic positioning in India and UK
Khadi Natural ~1–2% Herbal shampoos, face washes, essential oils Affordable traditional herbal care in emerging markets
Weleda Group ~1–2% Skin Food, biodynamic plant-extract products European organic certification leader with anthroposophic heritage


Recent News & Developments

  • Himalaya Wellness (March 2025): Launched a clinical-testing center in Bengaluru dedicated to validating the dermatological efficacy of 15 proprietary botanical compounds, signaling a shift toward evidence-based herbal skincare marketing [19].


  • EU Commission (September 2024): Published final guidance on the botanical-ingredient safety assessment framework under the updated Cosmetics Regulation, establishing standardized testing protocols that reduce approval timelines for new herbal actives by 30% [1].
  • Shiseido (October 2023): Announced a USD 120 million investment in botanical-fermentation R&D across its Osaka and Shanghai innovation centers, targeting next-generation biofermented herbal actives for the premium segment [22].
  • India AYUSH Ministry (July 2023): Launched the Ayush Export Promotion Council with a mandate to double herbal-product exports to USD 1.5 Billion by 2027, supported by quality-testing infrastructure upgrades at 12 regional laboratories [2].


Herbal Beauty Products Market Report Scope

Parameter Detail
Market Scope Global Herbal Beauty Products Market covering personal care products, cosmetics/make-up products across mass and premium categories
Study Period 2021–2035
CAGR (Forecast Period) 6.80% (2026–2035)
Market Size (2025) USD 101.90 Billion
Market Size (2035) USD 196.54 Billion
Fastest Growing Segment Cosmetics/Make-up Products (by product type); Premium (by category); Online Retail (by channel)
Companies Profiled Himalaya Wellness, Dabur, Patanjali Ayurved, Natura & Co, L'Occitane, Burt's Bees, Shiseido, Forest Essentials, Khadi Natural, Weleda Group
Valuation Currency USD Billion


FAQs

How do shelf-life limitations affect herbal beauty product pricing strategies?
Shorter shelf life increases per-unit logistics costs by 10–15% compared to synthetic products, pushing brands toward smaller batch sizes and premium pricing. Airless-pump packaging and cold-chain distribution partially offset spoilage risk [13].
What third-party certifications matter most when evaluating herbal beauty brands?
COSMOS Organic, Ecocert, USDA Organic, and halal certification carry the strongest consumer trust signals across Western and Islamic markets. Brands holding at least two of these typically command 20–30% price premiums [9].
How does the Herbal Beauty Products Market address ingredient adulteration risks?
Leading manufacturers deploy DNA barcoding and HPTLC fingerprinting to authenticate botanical raw materials at intake. Blockchain-based traceability platforms are emerging as an additional verification layer [5].
What role do contract manufacturers play in the Herbal Beauty Products Market?
Contract manufacturers enable indie and DTC brands to launch without capital-intensive facility investment. Over 40% of new herbal beauty SKUs in 2024 were produced through third-party manufacturing partnerships [8].
How does the Herbal Beauty Products Market compare in margin profile to conventional beauty?
Gross margins for premium herbal products average 62–68%, roughly 5–8 percentage points above mass-market conventional beauty. Higher raw-material costs are offset by stronger consumer willingness to pay [15].
What intellectual property strategies protect herbal beauty formulations?
Brands increasingly patent extraction methods and biofermentation processes rather than individual herbs. Trade-secret protection of proprietary blending ratios remains the most common defensive strategy [22].
How are subscription models reshaping the Herbal Beauty Products Market?
Personalized herbal skincare subscriptions achieve 25–35% higher customer lifetime value than one-time purchases. AI-driven diagnostics that adjust formulations quarterly drive retention [6].    
Author
Author
Author Profile
Snehal Singh LinkedIn
Manager - Research
High acumen in analyzing complex macro & micro markets with more than 6 years of work experience in the field of market research. By implementing her analytical skills in forecasting and estimation into market research reports, she has expertise in Packaging, Construction, and Equipment domains. She handles a team size of 20-25 resources and ensures smooth running of the projects, associated marketing activities, and client servicing.

Research Approach


Secondary Research

The secondary research process involved comprehensive analysis of regulatory databases, peer-reviewed scientific journals, cosmetic chemistry publications, and authoritative health & beauty organizations. Key sources included the US Food & Drug Administration (FDA) Cosmetic Product Regulation, European Commission Directorate-General for Internal Market, Industry, Entrepreneurship and SMEs (GROW), Cosmetics Europe – The Personal Care Association, Personal Care Products Council (PCPC), International Organization for Standardization (ISO) Technical Committee 217 (Cosmetics), National Center for Complementary and Integrative Health (NCCIH), World Health Organization (WHO) Traditional Medicine Strategy, EU Cosmetics Regulation (EC) No 1223/2009 Database, ASEAN Cosmetic Directive compliance reports, Bureau of Indian Standards (BIS) for Ayurvedic and herbal cosmetics, Ministry of Ayush (India) regulatory frameworks, USDA National Organic Program (NOP) cosmetic standards, COSMOS-standard AISBL certification database, Environmental Working Group (EWG) Skin Deep Database, Mintel Global New Products Database (GNPD), and Euromonitor International Beauty and Personal Care market intelligence. These sources were used to collect formulation standards, regulatory compliance data, herbal ingredient safety profiles, consumer trend analysis, and competitive landscape mapping for skincare, haircare, makeup, fragrance, and body care segments utilizing herbal and botanical extracts.


Primary Research

Qualitative and quantitative insights were obtained by interviewing supply-side and demand-side stakeholders during the primary research process. The supply-side sources comprised CEOs, Chief Innovation Officers, heads of Research & Development, procurement directors for botanical raw materials, and sustainability officers from herbal beauty product manufacturers, Ayurvedic and traditional medicine companies, clean beauty startups, and contract manufacturers. Demand-side sources included Ayurvedic practitioners, dermatologists with expertise in botanical ingredients, retail buyers from specialty beauty retailers, e-commerce platform category managers, and procurement leads from premium department stores, natural product retailers, and spa/wellness centers. The primary research validated product category segmentation, confirmed novel herbal formulation pipelines, and gathered insights on the adoption patterns of clean beauty, sustainability certification requirements, pricing premium dynamics, and direct-to-consumer channel strategies.

Primary Respondent Breakdown:

By Designation: C-level Primaries (40%), Director Level (25%), Others (35%)

By Region: North America (38%), Europe (25%), Asia-Pacific (27%), Rest of World (10%)


Market Size Estimation

Global market valuation was derived through revenue mapping and consumption volume analysis. The methodology included:

Identification of 55+ key manufacturers and heritage herbal brands across North America, Europe, Asia-Pacific, Latin America, and Middle East & Africa

Product mapping

Download Free Sample

Kindly complete the form below to receive a free sample of this Report

Download PDF ×

We do not share your information with anyone. However, we may send you emails based on your report interest from time to time. You may contact us at any time to opt-out.
















