Segmentation Quick Reference
| Dimension | Sub-Segments | Dominant Segment | Fastest Growing Segment |
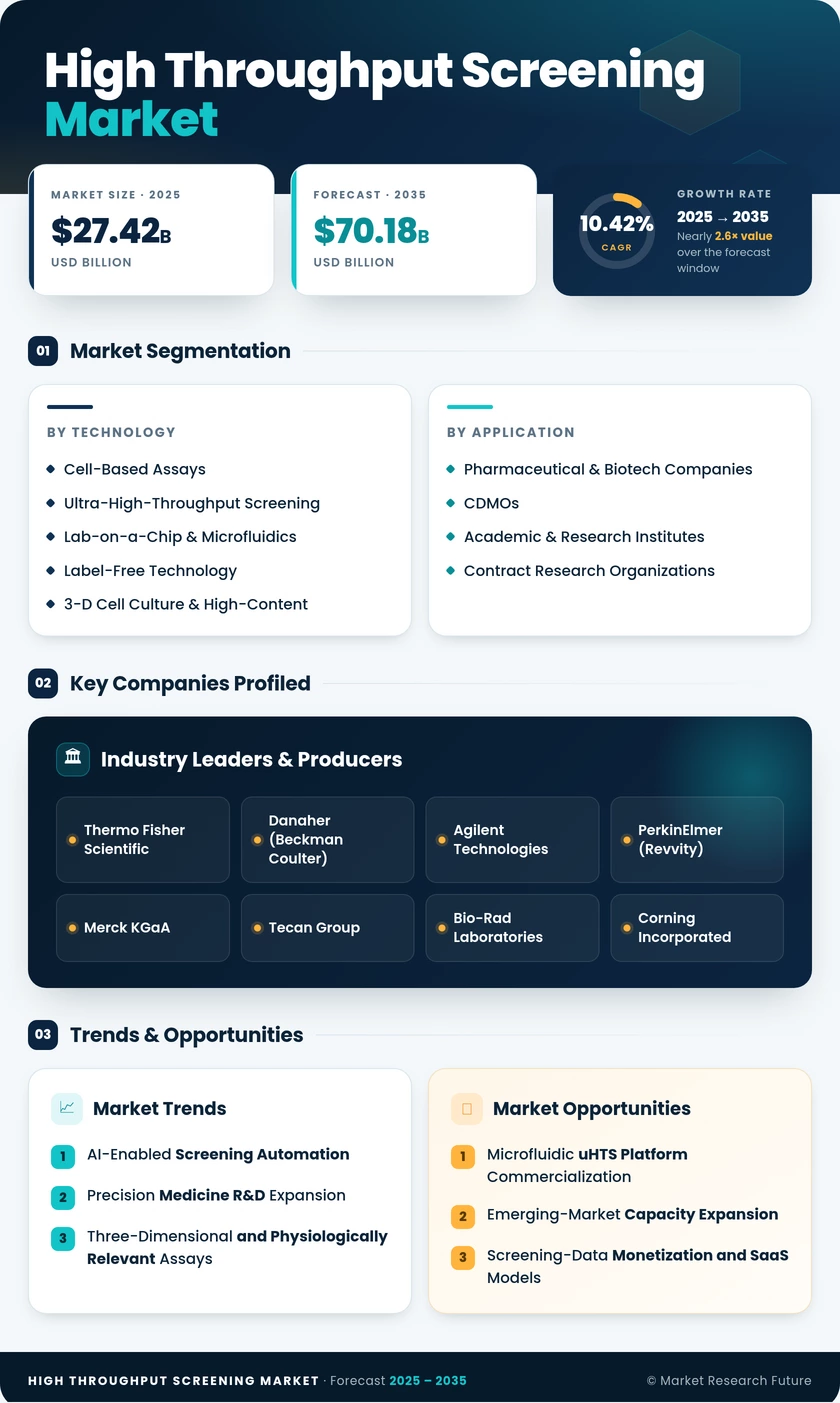
| By Technology | Cell-Based Assays, Ultra-High-Throughput Screening, Lab-on-a-Chip & Microfluidics, Label-Free Technology, 3-D Cell Culture & High-Content | Cell-Based Assays | Lab-on-a-Chip & Microfluidics |
| By Application | Primary & Secondary Screening, Target Identification, Toxicology & ADME, Hit-to-Lead Optimization | Primary & Secondary Screening | Toxicology & ADME |
| By End User | High Throughput Screening Market & Biotech Companies, CDMOs, Academic & Research Institutes, Contract Research Organizations | High Throughput Screening Market & Biotech Companies | CDMOs |
Market Segmentation Overview
By Technology
| Sub-Segment | Key Trend |
| Cell-Based Assays | Shift toward physiologically relevant living-cell readouts |
| Ultra-High-Throughput Screening | Nanoliter assays expanding compound coverage. |
| Lab-on-a-Chip & Microfluidics | Miniaturization cuts reagent cost and footprint. |
| Label-Free Technology | Growing use where label interference compromises data |
| 3-D Cell Culture & High-Content | Organoid and spheroid imaging gaining regulatory favor |
Technology segmentation reflects a market moving from simple biochemical formats toward biologically richer, miniaturized systems. Cell-based assays dominate because they predict therapeutic response more reliably, while microfluidic platforms grow fastest as laboratories prioritize reagent efficiency and decentralized capability.
By Application
| Sub-Segment | Key Trend |
| Primary & Secondary Screening | Core high-volume filter of discovery pipelines |
| Target Identification | Precision medicine is expanding the molecular target scope. |
| Toxicology & ADME | Non-animal testing regulation is accelerating adoption. |
| Hit-to-Lead Optimization | AI-guided candidate refinement is gaining traction. |
Application segmentation shows primary and secondary screening as the unavoidable foundation of discovery work, sustaining its lead. Toxicology and ADME applications grow fastest, driven directly by regulatory momentum favoring non-animal safety assessment methods.
By End User
| Sub-Segment | Key Trend |
| High Throughput Screening Market & Biotech Companies | Sustained in-house screening for proprietary pipelines |
| CDMOs | Rapid growth as sponsors outsource screening workloads. |
| Academic & Research Institutes | Grant-funded basic and translational research |
| Contract Research Organizations | Sponsor-driven demand for specialized screening |
End-user segmentation confirms pharmaceutical and biotech companies as the demand anchor, given their large internal discovery programs. CDMOs represent the fastest-expanding buyer group as outsourcing of screening becomes a standard strategic choice across the industry.