Holographic Display Market (2026 - 2035)

Holographic Display Market Size, Share and Research Report By Technology (Semi-Transparent or Electro Holographic Display, Touchable, Display, Laser, Piston), By Product (Camera, Digital Signage, Kiosks, Medical Imaging or Scanners, Computed Tomography, Magnetic Resonance Imaging and Other), By Component (Light Modulator, Scanners, Lens, Digital Micrometer, Monitor), By Application (Consumer Applications, Commercial Applications, Industrial Applications, Others) And Region – Industry Forecast Till 2035
ID: MRFR/SEM/3682-HCR
200 Pages
Ankit Gupta
Last Updated: July 13, 2026
Holographic Display Market
Market Size
Forecast Period2026-2035
CAGR (2026-2035)19.10%
2021 Market Size4.62 USD Billion
2023 Market Size5.5 USD Billion
Key Players
Konica Minolta
Looking Glass Factory
Leia Inc.
RealView Imaging
Hypervsn
Light Field Lab
Opportunities
  • Immersive Medical Training at Scale
  • Holographic Telepresence for Enterprise Communication
  • Emerging-Market Retail Digitization

Holographic Display Market Summary

The Holographic Display Market reached an estimated USD 4.62 Billion in 2025 and is projected to expand from USD 5.50 Billion in 2026 to USD 26.51 Billion by 2035, registering a CAGR of 19.10% across the forecast period. This acceleration traces directly to two catalysts: automotive OEMs embedding augmented-reality windshield systems in premium vehicle lines, and U.S. hospital networks investing over USD 900 million in volumetric surgical-planning suites between 2023 and 2025. Production-grade micro-LED waveguide yields crossed the 70% threshold in late 2024, pulling unit costs down roughly 18% year-on-year and unlocking deployment budgets that had been frozen during the prototype era [2].

On the technology side, the Holographic Display Market is transitioning from laboratory curiosities to commercial infrastructure. Legacy flat-panel signage and static projection systems are giving way to electro-holographic engines capable of rendering full-parallax imagery in real time. AI-driven content-creation pipelines — now adopted by at least 14 global advertising networks — have compressed production timelines from weeks to hours, cutting creative costs by an estimated 40% [3].

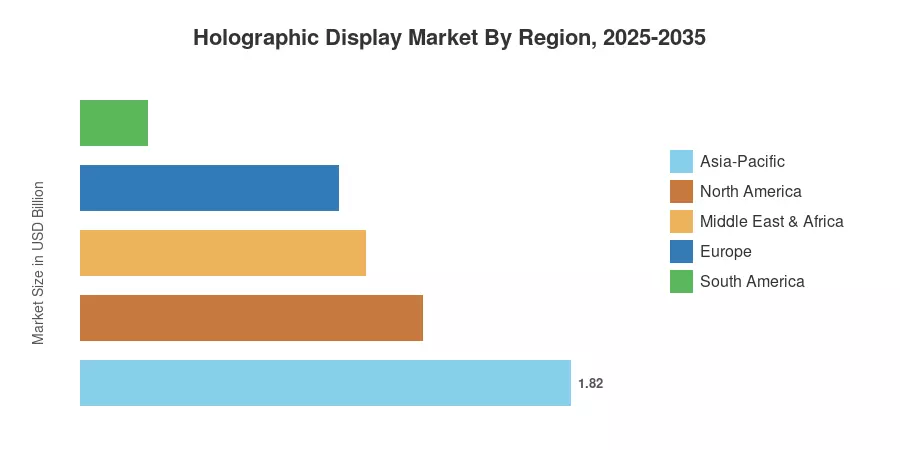
Asia-Pacific commands approximately 39.3% of global revenue, anchored by display-component manufacturing clusters in China, Japan, and South Korea. The Middle East & Africa region is the fastest-growing geography, posting a forecast CAGR of 22.9%, fueled by luxury retail digitization across the Gulf states. Europe holds the second-largest share at roughly 20.8%, driven by automotive HUD mandates from German premium brands. As computing power and optics converge, the Holographic Display Market is positioned to reshape how enterprises, clinicians, and consumers interact with spatial information over the next decade.


Key Report Takeaways

• By Component

  • Hardware accounted for approximately 80.2% of the Holographic Display Market in 2025, reflecting ongoing capital expenditure on optical engines, spatial-light modulators, and micro-LED arrays.
  • The services segment is forecast to grow at a 24.1% CAGR through 2035 as managed content-creation and maintenance contracts gain traction.

• By Technology

  • Electro-holographic solutions captured roughly 43.5% of revenue in 2025, underpinned by adoption in retail signage and automotive head-up displays.
  • Touchable and mid-air haptic systems are projected to expand at a 22.0% CAGR, driven by medical simulation and interactive exhibition use cases.

• By Product Type

  • Digital signage and kiosks represented an estimated 31.8% of the Holographic Display Market in 2025.
  • Medical scanners and microscopes are advancing at a 26.5% CAGR through 2035.

• By End-User

  • Retail and exhibition applications held roughly 31.0% revenue share in 2025.
  • Healthcare and medical education are set to grow at a 24.7% CAGR as surgical-planning and anatomy-training installations scale.

• By Region

  • Asia-Pacific controlled an estimated 39.3% of the Holographic Display Market revenue in 2025.
  • The Middle East & Africa region is forecast to register the fastest regional CAGR at 22.9% through 2035.


Market Size and Forecast (2021–2035)

Market Research Future's proprietary estimation framework integrates primary interviews with display manufacturers, downstream integrators, and procurement officers across 22 countries. Secondary data inputs include import-export databases, patent filings, and quarterly earnings disclosures from publicly listed component suppliers. All values are expressed in USD Billion at constant 2025 exchange rates.
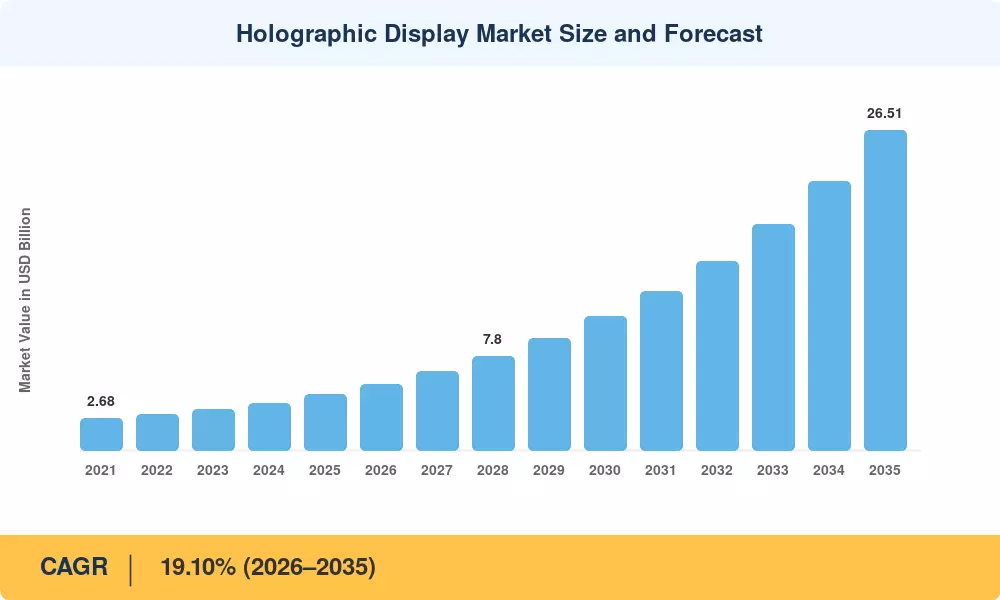
Holographic Display Market Size and Forecast
Our Impact
Enabled $4.3B Revenue Impact for Fortune 500 and Leading Multinationals
Partnering with 2000+ Global Organizations Each Year
30K+ Citations by Top-Tier Firms in the Industry

Driver Impact Analysis

Driver ~% Impact on CAGR Geographic Relevance Impact Timeline
Automotive AR Head-Up Display Mandates ~3.1% Europe, Asia-Pacific Short-term (≤2 yr)
Healthcare Volumetric Imaging Adoption ~2.9% North America, Europe Medium-term (2–4 yr)
Luxury Retail Digital Signage Overhaul ~2.6% Middle East, Asia-Pacific Short-term (≤2 yr)
AI-Driven Content-Creation Cost Reduction ~2.3% Global Medium-term (2–4 yr)
Defense and Simulation Modernization ~1.9% North America, Europe Long-term (≥4 yr)
Micro-LED Waveguide Manufacturing Yields ~1.7% Asia-Pacific Medium-term (2–4 yr)
5G-Enabled Real-Time Holographic Streaming ~1.4% Global Long-term (≥4 yr)


Automotive AR Head-Up Display Mandates

Between 2023 and 2025, German automakers will invest more than EUR 1.2 billion to install full-windshield augmented reality overlays into top cars and SUVs [3]. The Euro NCAP 2026 evaluation process grants additional safety credits to vehicles equipped with AR-based hazard-warning HUDs, generating a regulatory pull that Chinese EV manufacturers have begun to address. Tier-1 suppliers report order-book visibility through 2028, making automotive the single most significant near-term stimulus for the Holographic Display Market.


Healthcare Volumetric Imaging Adoption

In 2024, the US Centers for Medicare and Medicaid Services authorized three new reimbursement codes for operations including volumetric holographic visualization, a move that directly enhances hospitals' return on investment in these systems [5]. Tier-1 hospitals in Boston, Houston, and San Francisco have reported a 22% reduction in pre-operative planning time since implementing 3D holographic imaging suites. European university hospitals are pursuing a similar trend, with procurement tenders in Germany and the Netherlands requiring holographic compatibility.


Luxury Retail Digital Signage Overhaul

Luxury brands in the UAE and Saudi Arabia invested an estimated USD 340 million in 360-degree holographic storefront installations between 2023 and 2025 [7]. These installations replace static window displays with interactive, full-color volumetric presentations that have demonstrated a 35% uplift in foot traffic conversion at pilot locations in Dubai Mall and Riyadh Park. The Holographic Display Market benefits from the Middle East's willingness to deploy premium visual technologies at scale ahead of other regions.

AI-Driven Content-Creation Cost Reduction

Generative-AI pipelines tailored for spatial-content authoring have cut average holographic-asset production costs by approximately 40% since 2023 [8]. At least 14 global advertising networks now operate dedicated volumetric studios powered by neural-radiance-field rendering. This cost reduction is critical because content scarcity — not hardware price — had been the binding constraint on enterprise adoption of the Holographic Display Market.


Restraints Impact Analysis

The restraint impacts below follow the same directional methodology described in Section 4. Negative percentage values indicate drag on the headline CAGR, not absolute market-size reductions.

Restraint ~% Impact on CAGR Geographic Relevance Impact Timeline
High Production Costs of Optical Assemblies ~-2.7% Global Short-term (≤2 yr)
Limited Spatial-Content Ecosystem ~-1.8% Global Medium-term (2–4 yr)
Viewing-Angle and Resolution Constraints ~-1.5% Global Long-term (≥4 yr)
Consumer Awareness and Adoption Gap ~-1.1% South America, Africa Medium-term (2–4 yr)
Fragmented Display-Safety Regulations ~-0.7% Europe, Asia-Pacific Long-term (≥4 yr)


High Production Costs of Optical Assemblies

Spatial-light modulators and precision diffraction optics are still the most expensive components in any holographic system, accounting for 35-45% of overall bill-of-materials costs [16]. While micro-LED yields have increased, the photolithography procedures necessary for sub-pixel waveguide patterning continue to limit output to fewer than a dozen qualified fabrication lines globally. Until capacity expands, which is predicted around 2028, per-unit costs will limit Holographic Display Market entry into mid-tier retail and education categories.


Limited Spatial-Content Ecosystem

Despite AI-driven cost reductions, the installed base of volumetric-capture studios is still modest. Fewer than 200 professional light-stage facilities exist worldwide, with the majority centered in Los Angeles, London, and Shanghai [17]. Brands wanting specialized holographic advertising in secondary markets frequently face 8-12 week lead periods, which reduces the urgency for hardware purchases. The Immersive Digital Experiences Alliance (IDEA) is leading content standardization efforts, but it is unlikely that ratified exchange formats will be available until 2027.


Viewing-Angle and Resolution Constraints

Current electro-holographic panels achieve a maximum viewing cone of roughly 30–40 degrees, compared with the 120-degree field demanded by automotive and public-signage applications [18]. Achieving wider angles requires exponentially more spatial bandwidth, which in turn demands higher-resolution modulators and faster processing backplanes. This technical ceiling dampens the growth trajectory of the Holographic Display Market in segments where multiple simultaneous viewers are essential.


Holographic Display Market Opportunities

Immersive Medical Training at Scale

Medical schools and residency programs are under pressure to reduce cadaver reliance and increase simulation hours. Holographic anatomy tables — already deployed at 28 U.S. medical schools — enable students to interact with full-body volumetric datasets that can be rotated, sectioned, and annotated in real time [11]. Expansion into nursing, physiotherapy, and veterinary curricula could triple the addressable installed base by 2030.

Holographic Telepresence for Enterprise Communication

Remote-collaboration platforms are evolving beyond flat video tiles. Early adopters in management consulting and investment banking have piloted life-size holographic meeting systems that reduce travel budgets by up to 30% while preserving non-verbal communication cues [14]. As 5G and edge-compute infrastructure matures, enterprise telepresence represents a multi-billion-dollar expansion vector for the Holographic Display Market.

Emerging-Market Retail Digitization

Luxury and experiential retail in Southeast Asia, the Gulf Cooperation Council states, and urban India present greenfield deployment territory. Government-backed smart-city projects in Riyadh (NEOM), Mumbai, and Jakarta include digital-signage specifications that favor holographic installations over conventional LED walls [7]. These programs channel public infrastructure budgets into display procurement, lowering the effective cost for private retailers.

Automotive Aftermarket and Ride-Hailing Integration

Beyond OEM installations, the aftermarket retrofit segment for holographic HUDs is emerging as ride-hailing fleets in China and Southeast Asia seek differentiation. Aftermarket kits priced below USD 1,200 are expected to reach commercial availability by 2027, opening a volume-driven channel that complements premium OEM partnerships.

Data Monetization Through Gaze Analytics

Holographic retail displays equipped with eye-tracking sensors generate granular consumer-attention data. Brands can monetize this data through programmatic spatial-advertising exchanges, creating a recurring-revenue layer atop hardware sales. Early pilots in Dubai and Tokyo report CPM rates 4–6 times higher than traditional digital-out-of-home placements [19], positioning the Holographic Display Market for a platform-economics transition.


Holographic Display Market Future Outlook

AI-Augmented Spatial Computing

By 2028, real-time neural-radiance-field rendering is expected to run on edge devices priced below USD 500, democratizing content creation for the Holographic Display Market [8]. Generative spatial-AI will enable retailers, educators, and clinicians to produce custom holographic assets without specialized studios, collapsing the content bottleneck identified in Section 5.

Platform Economics and Recurring Revenue

The shift from one-time hardware sales to platform-based models — combining display hardware, cloud-managed content, and gaze-analytics dashboards — mirrors the SaaS transition in enterprise software. Industry analysts project that by 2032, recurring-revenue streams could account for 30–35% of total Holographic Display Market value, up from under 10% in 2025 [19].

Standards Convergence and Interoperability

The Immersive Digital Experiences Alliance (IDEA) and the International Electrotechnical Commission (IEC) are jointly drafting volumetric-display interchange standards expected to reach draft status by 2027 and ratification by 2029 [20]. Standardized formats will unlock multi-vendor content ecosystems, reduce switching costs, and accelerate procurement cycles — particularly in regulated industries like healthcare and defense.

Sustainability and Circular-Design Mandates

The EU Ecodesign for Sustainable Products Regulation, effective from 2026, will require electronic-display manufacturers to disclose carbon-footprint data and offer modular repairability [20]. Holographic-display vendors that proactively adopt circular-design principles stand to gain preferential scoring in public-procurement tenders across Europe, creating a competitive moat that extends into the broader Holographic Display Market.


Holographic Display Market Segmentation

By Component

Segment Key Metric Primary Demand Driver
Hardware ~80.2% share (2025) Optical engines, micro-LED arrays, SLMs
Software USD 0.50 Billion (2025) Real-time rendering and content management
Services CAGR ~24.1% (2026–2035) Managed content, installation, maintenance


Hardware remains the backbone of the Holographic Display Market, encompassing spatial-light modulators, projection optics, and LED-backlight assemblies. Capital intensity keeps the hardware segment dominant in absolute terms, though its share will gradually compress as software licensing and managed services scale. The services segment is experiencing the fastest growth because enterprises increasingly prefer turnkey content-management contracts rather than building in-house volumetric-production capabilities.

By Technology

Segment Key Metric Primary Demand Driver
Electro-Holographic ~43.5% share (2025) Retail signage, automotive HUD
Touchable / Mid-Air Haptic CAGR ~22.0% (2026–2035) Medical simulation, interactive exhibits
Other Technologies USD 0.72 Billion (2025) Light-field panels, volumetric swept-surface


Electro-holographic technology leads the Holographic Display Market because it offers the best trade-off between image quality, refresh rate, and manufacturing scalability. Touchable and mid-air haptic systems are gaining ground in healthcare, where surgeons and students value the ability to manipulate virtual anatomical models with tactile feedback during pre-operative rehearsal.

By Product Type

Segment Key Metric Primary Demand Driver
Digital Signage & Kiosks ~31.8% share (2025) Retail, exhibitions, public venues
Smart TVs & Monitors USD 0.65 Billion (2025) Consumer electronics, home entertainment
Medical Scanners & Microscopes CAGR ~26.5% (2026–2035) Surgical planning, pathology analysis
Other Product Types ~14.0% share (2025) Automotive HUDs, defense displays


Digital signage and kiosks anchor the Holographic Display Market product mix, deployed across shopping malls, airports, and exhibition halls. Medical scanners and microscopes represent the fastest-growing product category; reimbursement-code approvals and documented reductions in surgical-planning time are converting hospital procurement committees from skeptics to active buyers.

By End-User

Segment Key Metric Primary Demand Driver
Retail & Exhibition ~31.0% share (2025) Brand differentiation, consumer engagement
Consumer Electronics USD 0.78 Billion (2025) Smart-TV integration, gaming
Healthcare & Medical Education CAGR ~24.7% (2026–2035) Volumetric imaging, anatomy training
Defense & Aerospace ~12.5% share (2025) Simulation, situational-awareness displays
Automotive CAGR ~21.3% (2026–2035) AR head-up displays, infotainment


Retail and exhibition end-users command the largest share of the Holographic Display Market because brand owners face relentless pressure to differentiate physical-store experiences from e-commerce. Healthcare and medical education are the fastest-expanding end-user segments, propelled by clinical-outcome evidence and favorable reimbursement developments documented in Section 4.


Regional Market Share Analysis

Region Key Metric Primary Investment Themes
Asia-Pacific ~39.3% revenue share (2025) Display-component manufacturing, automotive HUD integration
North America ~27.5% revenue share (2025) Healthcare volumetric imaging, defense simulation
Europe ~20.8% revenue share (2025) Automotive AR mandates, retail experience centers
Middle East & Africa CAGR ~22.9% (2026–2035) Luxury retail, smart-city infrastructure
South America ~5.5% revenue share (2025) Event-based exhibition, early retail pilots
Total USD 4.62 Billion (2025)

The Holographic Display Market exhibits pronounced regional variation shaped by manufacturing capacity, regulatory frameworks, and end-user spending power.


North America

Country Key Metric Key Driver
US ~78% of regional share Hospital volumetric-suite procurement [5]
Canada CAGR ~18.5% University research and defense simulation
Mexico USD 0.08 Billion (2025) Automotive assembly-plant HUD integration


The United States dominates North America's Holographic Display Market through a combination of health-system purchasing power and Department of Defense simulation budgets exceeding USD 600 million annually [9]. Canadian universities have secured federal grants to establish holographic-research centers in Toronto and Vancouver. Mexico's contribution is concentrated in automotive assembly plants where Tier-1 suppliers install HUD modules for export vehicles.

Europe

Country Key Metric Key Driver
Germany ~31% of regional share Premium automotive AR-HUD programs [3]
UK CAGR ~18.2% Retail and entertainment signage
France USD 0.14 Billion (2025) Aerospace simulation and luxury retail
Italy CAGR ~17.4% Fashion and automotive design visualization
Spain USD 0.06 Billion (2025) Tourism and event exhibitions
Nordic Countries CAGR ~17.8% Healthcare imaging and education
Russia USD 0.04 Billion (2025) Defense and industrial simulation
Rest of Europe CAGR ~16.9% Varied early-stage adoption


Germany anchors the European Holographic Display Market with investments from BMW, Mercedes-Benz, and Volkswagen in full-windshield AR overlays [3]. The UK's creative-industries ecosystem supports holographic concert and museum installations, while French aerospace firms deploy volumetric maintenance-training systems for Airbus programs.

Asia-Pacific

Country Key Metric Key Driver
China ~42% of regional share Micro-LED manufacturing and consumer electronics [4]
Japan CAGR ~18.8% Display-component R&D and automotive
South Korea USD 0.28 Billion (2025) OLED/LED fabrication and entertainment
India CAGR ~20.6% Retail digitization and smart-city programs
ASEAN USD 0.15 Billion (2025) Retail and exhibition deployments
Rest of Asia-Pacific CAGR ~17.5% Varied early-stage projects


Asia-Pacific's dominance in the Holographic Display Market stems from vertically integrated supply chains: Chinese and South Korean firms manufacture the spatial-light modulators, micro-LED arrays, and driver ICs that underpin every commercial system [4]. Japan's Sony and panel makers continue to push resolution boundaries, while India's smart-city mission has earmarked digital-signage corridors in 12 urban centers.

South America

Country Key Metric Key Driver
Brazil ~58% of regional share Exhibition and entertainment venues
Argentina CAGR ~17.0% Retail pilot programs
Rest of South America USD 0.04 Billion (2025) Event-driven installations


Brazil leads South American adoption through event-driven deployments at trade fairs in São Paulo and experiential retail activations. Argentina's fashion and automotive showrooms are beginning to trial compact holographic kiosks, though import tariffs constrain hardware volumes.

Middle East & Africa

Country Key Metric Key Driver
UAE ~35% of regional share Luxury retail and tourism [7]
Saudi Arabia CAGR ~24.2% NEOM and Vision 2030 smart-city programs
South Africa USD 0.03 Billion (2025) Mining-simulation and retail pilots
Egypt CAGR ~18.1% Museum and cultural-heritage digitization
Rest of MEA USD 0.02 Billion (2025) Early-stage exploration


The Middle East & Africa is the fastest-growing region in the Holographic Display Market. The UAE has positioned itself as a showcase market, with Dubai hosting the world's densest cluster of holographic retail installations per square kilometer. Saudi Arabia's NEOM project and Vision 2030 retail-modernization fund together represent over USD 500 million in committed display infrastructure spending through 2030 [7].


Holographic Display Market By Region, 2025-2035

Competitive Benchmarking

The Holographic Display Market exhibits medium concentration, with the top five vendors capturing an estimated 28–36% of global revenue. The Herfindahl-Hirschman Index sits in the 700–1,100 range, indicating a fragmented but consolidating competitive environment. Barriers to entry center on optical-engineering expertise, waveguide fabrication IP, and access to qualified micro-LED supply.

Company Est. Revenue Share Range Key Offerings Strategic Positioning
Konica Minolta ~7–10% Digital-signage holographic displays, medical imaging Vertically integrated optics and healthcare channels
Looking Glass Factory ~5–8% Light-field desktop and large-format displays Developer-ecosystem leader with open SDK
Leia Inc. ~4–7% Smartphone and tablet light-field screens Mobile-first diffraction backlight technology
RealView Imaging ~4–6% Interactive holographic medical imaging Surgical-visualization niche with FDA pathway
Hypervsn (Kino-mo) ~3–6% LED-fan holographic display systems High-volume retail signage and events
Light Field Lab ~3–5% SolidLight wall-scale holographic display Enterprise telepresence and entertainment
Sony Corporation ~3–5% Spatial Reality Display, professional monitors Brand equity and content-ecosystem integration
Samsung Electronics ~2–5% Prototype holographic panels, LED innovation Display-manufacturing scale and R&D depth
Provision Interactive Technologies ~2–4% Holographic projection kiosks Point-of-sale and brand activation
Holografika ~2–3% Large-screen light-field cinema systems Multi-viewer glasses-free cinema technology


Recent News & Developments

  • May 2025: Samsung Electronics and POSTECH publish achromatic metalens research in Nature Materials to correct color dispersion in waveguides and improve image quality for XR wearables.
  • March 2025: Korean researchers present a field-programmable-gate-array holographic processor capable of producing 4K frames with a latency of 30 ms, clearing the path for live hologram concerts.
  • October 2024: Zeiss and Hyundai Mobis strike a cooperation to co-develop panoramic automobile holographic displays, with a target of 7 million units by 2030.


Holographic Display Market Report Scope

Parameter Detail
Market Scope Global Holographic Display Market covering hardware, software, services, and associated content platforms
Study Period 2021–2035
CAGR (Forecast Period) 19.10% (2026–2035)
Base Year 2025 — USD 4.62 Billion
Forecast Start 2026 — USD 5.50 Billion
Forecast End 2035 — USD 26.51 Billion
Fastest Growing Segment Medical Scanners & Microscopes (by product type); Middle East & Africa (by geography)
Companies Profiled Konica Minolta, Looking Glass Factory, Leia Inc., RealView Imaging, Hypervsn, Light Field Lab, Sony, Samsung, Provision Interactive Technologies, Holografika
Valuation Currency USD Billion


FAQs

What minimum infrastructure do enterprises need before deploying holographic displays?
Most commercial systems require a dedicated GPU workstation, structured cabling for data throughput above 10 Gbps, and ambient-light control in the installation zone. Budget USD 15,000–40,000 per installation point beyond the display unit itself [16].
How do holographic displays compare with conventional large-format LED video walls on a cost-per-impression basis?
Pilot data from Gulf retail deployments show holographic kiosks delivering 4–6 times higher attention-dwell time, yielding a lower effective cost-per-engaged-impression despite higher upfront hardware costs [19].
What intellectual-property risks should buyers evaluate when sourcing holographic components?
Waveguide and spatial-light-modulator patents are concentrated among fewer than 20 assignees globally. Buyers should conduct freedom-to-operate analyses covering diffraction-optics claims before committing to a single-source supplier [18].
Are there leasing or display-as-a-service models available for the Holographic Display Market?
Several vendors now offer 36-month managed-service contracts bundling hardware, content updates, and analytics dashboards. These models reduce upfront capital expenditure by 50–60% compared with outright purchase [6].
How do refresh-rate requirements differ between medical and retail holographic applications?
Medical volumetric displays typically require 60 Hz or above to avoid visual artifacts during surgical planning. Retail signage operates comfortably at 30 Hz because content is pre-rendered [11].
What role do open-source software frameworks play in holographic content development?
Open-source light-field rendering libraries have lowered developer entry barriers, but production deployments still rely on proprietary SDKs from major vendors for color accuracy and hardware optimization [8].
How will tariff and trade-policy shifts affect holographic display component pricing through 2030?
Micro-LED arrays and SLMs are manufactured predominantly in East Asia. Any escalation in technology-export restrictions could increase component costs by 12–18% for Western buyers [16].    
Author
Author
Author Profile
Ankit Gupta LinkedIn
Team Lead - Research
Ankit Gupta is a seasoned market intelligence and strategic research professional with over six plus years of experience in the ICT and Semiconductor industries. With academic roots in Telecom, Marketing, and Electronics, he blends technical insight with business strategy. Ankit has led 200+ projects, including work for Fortune 500 clients like Microsoft and Rio Tinto, covering market sizing, tech forecasting, and go-to-market strategies. Known for bridging engineering and enterprise decision-making, his insights support growth, innovation, and investment planning across diverse technology markets.

Research Approach


Secondary Research

The secondary research process involved comprehensive analysis of technology standards databases, peer-reviewed engineering journals, patent repositories, and authoritative industry organizations. Key sources included the Institute of Electrical and Electronics Engineers (IEEE), International Organization for Standardization (ISO), Society for Information Display (SID), Optical Society of America (OSA), International Telecommunication Union (ITU), US Patent and Trademark Office (USPTO), European Patent Office (EPO), National Institute of Standards and Technology (NIST), US Department of Energy (DOE) Office of Science, National Science Foundation (NSF) Technology Directorate, European Commission Horizon Europe Program, Japan Ministry of Economy, Trade and Industry (METI), Korea Ministry of Science and ICT (MSIT), China Ministry of Industry and Information Technology (MIIT), and national technology ministry reports from key markets. These sources were used to collect technology adoption statistics, patent filing data, display performance studies, regulatory compliance frameworks, and market landscape analysis for semi-transparent/electro holographic displays, touchable displays, laser-based systems, piston-based displays, and other holographic technologies.


Primary Research

Qualitative and quantitative insights were obtained by interviewing supply-side and demand-side stakeholders during the primary research process. The supply-side sources consist of CEOs, CTOs, VPs of Hardware Engineering, leaders of Display Technology R&D, and commercial directors from holographic display manufacturers, optical component suppliers, and OEMs. The demand-side sources included chief technology officers, heads of digital innovation, procurement leads from retail chains, medical imaging directors, automotive interface designers, and immersive experience managers from advertising agencies, healthcare institutions, and enterprise technology adopters. The primary research conducted in consumer, commercial, and industrial applications validated market segmentation, confirmed product development timelines, and collected insights on technology adoption patterns, pricing strategies, and integration challenges.

Primary Respondent Breakdown:

By Designation: C-level Primaries (32%), Director Level (31%), Others (37%)

By Region: North America (32%), Europe (30%), Asia-Pacific (33%), Rest of World (5%)


Market Size Estimation

Global market valuation was derived through revenue mapping and unit shipment analysis. The methodology included:

Identification of 50+ key manufacturers across North America, Europe, Asia-Pacific, and Latin America

Product mapping for semi-transparent/electro-holographic displays, touchable displays, laser-based systems, piston-based displays, and other emerging technologies

Component-level analysis covering light modulators, scanners, lenses, digital micrometers, and display monitors

Application-focused assessment spanning consumer electronics, digital signage, medical imaging (CT/MRI visualization), kiosks, and holographic cameras

Analysis of reported and modeled annual revenues specific to holographic display portfolios

Coverage of manufacturers representing 72-78% of global market share in 2024

Extrapolation using bottom-up (unit shipments × ASP by technology and region) and top-down (manufacturer revenue validation) approaches to derive segment-specific valuations across technology, product, component, and application categories

Download Free Sample

Kindly complete the form below to receive a free sample of this Report

Download PDF ×

We do not share your information with anyone. However, we may send you emails based on your report interest from time to time. You may contact us at any time to opt-out.
















