×
Hero Background
English
Chinese
French
Japanese
Korean
German
Spanish

Hydrate Inhibitors Market Analysis

ID: MRFR/CnM/7322-CR
111 Pages
Anshula Mandaokar
October 2022

Hydrate Inhibitors Market Research Research Report Information By Type (Thermodynamic Inhibitors (THIs), Low-Dosage Hydrate Inhibitors (LDHIs)) Application (Onshore Operations, Offshore Operations) Forecast 2030

Share:
Download PDF ×

We do not share your information with anyone. However, we may send you emails based on your report interest from time to time. You may contact us at any time to opt-out.

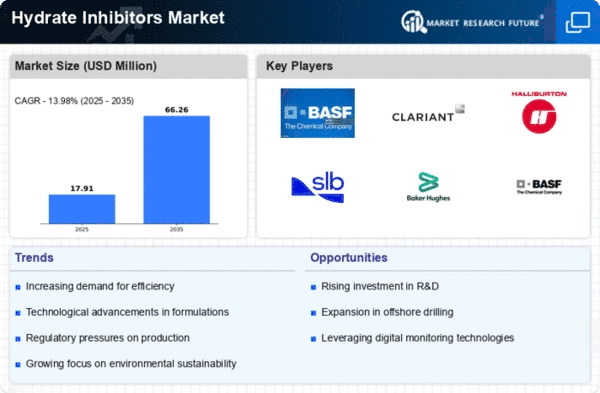
Hydrate Inhibitors Market Infographic
Purchase Options

Market Analysis

In-depth Analysis of Hydrate Inhibitors Market Industry Landscape

The marketplace for hydrate inhibitors is changing rapidly because of their importance within the oil and gas sector, especially when it comes to preventing the formation of hydrates. Among the problems posed by these ice-like crystals formed by water interacting with hydrocarbons under specific temperature and pressure conditions include pipeline blockages and flow assurance challenges, among others faced by oil and gas operations. One major factor driving the dynamics of this particular market is the increasing demand for hydrate inhibitors during subsea as well as deep-water exploration & production activities within the oil & gas sector. The natural gas industry's growth heavily influences developments within hydrates inhibitors' markets since there exist huge risks associated with natural-gas transportation besides processing due to possible forms of its hydrides known as hydrates occurring throughout transportation operations or/and production processes prior to finalizing processing activities on such gases from wells through different plants. Natural gas pipelines and processing facilities make use of hydrate inhibitors to prevent hydrate formation, thereby ensuring the uninterrupted flow of natural gas. Additionally, the current trends are determined by progress in unconventional oil and gas extraction, such as shale gas and tight oil. In particular, these methods of resource development often involve difficult operating conditions like those where the formation of hydrocarbons may take place. The dynamics of the hydrate inhibitors market are also influenced by exploration and production activities in cold climates; low temperatures increase the risk of hydrate formation. Hydrate inhibitors are used in Arctic and subarctic regions to minimize problems with hydrates for the oil & gas industry. As more reserves start to be surveyed in polar areas, demand for effective hydrate inhibitors designed for coping with low-temperature challenges should grow. However, some challenges that need addressing include continuous innovations, cost factors, and environmental issues, among others, within the market. Finding a good balance between effectiveness, economics, and ecological compatibility is one of the essential tasks that this branch faces today while striving to create new types of efficient yet affordable environmentally friendly systems preventing the deposition of solid fracking particles inside drill pipes during hydraulic fracturing operations. Different forms include developing novel chemistries for such compounds, improving current formulations, or/ looking at sustainable alternatives, among others, especially when it comes to R&D efforts that have impacted the changing nature of this sector over time. Enhancing overall efficiency as well as reliability across various operational environments is what technological innovations aimed at improving inhibitor deployment systems encompassed into smart injection techniques or constant monitoring devices allow doing.

Author
Anshula Mandaokar
Team Lead - Research

Anshula Mandaokar holds an academic degree in Chemical Engineering and has been contributing to the field for more than 5 years. She has expertise in Market Research and Business Consulting and serves as a Team Lead for a reputed Market Research firm under the Chemicals and Materials domain spectrum. She has worked on multiple projects, generating explicit results in a quick turnaround time. Her understanding of data interpretation justifies her role as a leader.

Leave a Comment

FAQs

What growth rate Global Hydrate inhibitors Market would register in the future?

The global hydrate inhibitors market would register a growth of 6.27%.

Which industry will play a crucial role in taking the Hydrate inhibitors market ahead?

Oil & Gas Industry will play a crucial role in taking the Hydrate inhibitors market ahead.

What is the key restraining factor for the global Hydrate inhibitors market?

Environmental issues associated with the use of Anti-agglomerate (AA) LDHI, is the key restraining factor for the global hydrate inhibitors market.

Market Summary

The Global Hydrate Inhibitors Market is projected to grow from 14.3 USD Billion in 2024 to 29.2 USD Billion by 2035.

Key Market Trends & Highlights

Hydrate Inhibitors Market Key Trends and Highlights

  • The market is expected to experience a compound annual growth rate (CAGR) of 6.68 percent from 2025 to 2035.
  • By 2035, the market valuation is anticipated to reach 29.2 USD Billion, indicating robust growth potential.
  • In 2024, the market is valued at 14.3 USD Billion, reflecting a strong foundation for future expansion.
  • Growing adoption of hydrate inhibitors due to increasing offshore oil and gas exploration is a major market driver.

Market Size & Forecast

2024 Market Size 14.3 (USD Million)
2035 Market Size 29.2 (USD Million)
CAGR (2025-2035) 6.68%
Largest Regional Market Share in 2024 south_america)

Major Players

Schlumberger Limited (US), Baker Hughes, a GE Company LLC (US), BASF SE (Germany), Halliburton (US), Ecolab (US), Huntsman International LLC (US), Ashland (US), ARKEMA (France), Evonik Industries AG (Germany), Finoric LLC (US), Omni industrial solutions (US), Tetra Technologies, Inc. (US)

Market Trends

Hydrate Inhibitors Market Market Drivers

Rising Demand for Energy

The Global Hydrate Inhibitors Market Industry is experiencing a surge in demand driven by the increasing need for energy resources. As global energy consumption rises, particularly in developing nations, the oil and gas sector is under pressure to enhance production efficiency. Hydrate inhibitors play a crucial role in preventing the formation of gas hydrates in pipelines, thereby ensuring uninterrupted flow. This demand is reflected in the market's projected growth, with an estimated value of 14.3 USD Billion in 2024 and a forecasted increase to 29.2 USD Billion by 2035. Such growth suggests a compound annual growth rate of 6.68% from 2025 to 2035.

Market Segment Insights

Regional Insights

Key Companies in the Hydrate Inhibitors Market market include

Industry Developments

Future Outlook

Hydrate Inhibitors Market Future Outlook

The Hydrate Inhibitors Market is projected to grow at a 6.68% CAGR from 2024 to 2035, driven by increasing offshore oil and gas exploration and technological advancements in inhibitor formulations.

New opportunities lie in:

  • Develop eco-friendly hydrate inhibitors to meet regulatory demands.
  • Invest in R&D for advanced inhibitor technologies targeting deepwater applications.
  • Expand market presence in emerging economies with rising energy needs.

By 2035, the Hydrate Inhibitors Market is expected to achieve robust growth, reflecting evolving industry dynamics.

Market Segmentation

Report Overview

Intended Audience
  • Industrial sector
  • Pharmaceutical sector
  • Oil and gas sector
  • Agrochemical industries

Report Scope

Report Attribute/Metric Details
  Market Size    2030: USD 21,561.8 Million
  CAGR    6.27% CAGR (2022-2030)
  Base Year    2021
  Forecast Period   2022 to 2030
  Historical Data   2019 & 2020
  Forecast Units   Value (USD Million)
  Report Coverage   Revenue Forecast, Competitive Landscape, Growth Factors, and Trends
  Segments Covered   Type and Application
  Geographies Covered   North America ,Europe, Asia-Pacific, Latin America, Middle East & Africa
  Key Vendors   Schlumberger Limited (US), Baker Hughes, a GE Company LLC (US), BASF SE (Germany), Halliburton (US), Ecolab (US), Huntsman International LLC (US), Ashland (US), ARKEMA (France), Evonik Industries AG (Germany), Finoric LLC (US), Omni industrial solutions (US), and Tetra Technologies, Inc. (US)
  Key Market Opportunities   Increasing investments in oil & gas exploration activities in developing economies
  Key Market Drivers   Increasing demand for low-dosage hydrate inhibitors in the oil & gas industry

FAQs

What growth rate Global Hydrate inhibitors Market would register in the future?

The global hydrate inhibitors market would register a growth of 6.27%.

Which industry will play a crucial role in taking the Hydrate inhibitors market ahead?

Oil & Gas Industry will play a crucial role in taking the Hydrate inhibitors market ahead.

What is the key restraining factor for the global Hydrate inhibitors market?

Environmental issues associated with the use of Anti-agglomerate (AA) LDHI, is the key restraining factor for the global hydrate inhibitors market.

  1. GLOBAL HYDRATE INHIBITORS MARKET, BY TYPE 26
  2. GLOBAL HYDRATE INHIBITORS
  3. MARKET, BY APPLICATION 27
  4. GLOBAL HYDRATE INHIBITORS MARKET, BY REGION 28
  5. MARKET INTRODUCTION 29
    1. DEFINITION 29
    2. SCOPE OF THE STUDY
    3. MARKET
    4. STRUCTURE 30
    5. RESEARCH METHODOLOGY 31
    6. RESEARCH PROCESS 31
    7. PRIMARY RESEARCH 32
    8. SECONDARY RESEARCH 33
    9. MARKET SIZE ESTIMATION 34
    10. FORECAST MODEL 35
    11. LIST OF ASSUMPTIONS 36
  6. MARKET INSIGHTS 37
  7. MARKET DYNAMICS 42
    1. INTRODUCTION 42
    2. DRIVERS 43
      1. INCREASING DEMAND FOR LOW-DOSAGE HYDRATE INHIBITORS
      2. ADVANCEMENTS IN THE DRILLING OF GAS HYDRATES 43
      3. DRIVERS IMPACT ANALYSIS
    3. IN THE OIL & GAS INDUSTRY 43
    4. RESTRAINTS
      1. ENVIRONMENTAL
      2. RESTRAINTS IMPACT ANALYSIS
    5. ISSUES ASSOCIATED WITH THE USE OF ANTI-AGGLOMERATE (AA) LDHI 44
    6. OPPORTUNITIES
      1. INCREASING
      2. RESEARCH &
    7. INVESTMENTS IN OIL & GAS EXPLORATION ACTIVITIES IN DEVELOPING ECONOMIES 45
    8. DEVELOPMENT OF ECO-FRIENDLY HYDRATE INHIBITORS 46
    9. CHALLENGES 47
      1. REQUIREMENT OF HIGH DOSAGE OF THERMODYNAMIC
    10. INHIBITORS 47
    11. AVAILABILITY OF DEPRESSURIZATION METHOD FOR CONTROLLING HYDRATE FORMATION 47
    12. TRENDS 47
      1. SHIFT TOWARD RENEWABLE
      2. ECONOMIC IMPACT ON THE OVERALL INDUSTRY 48
      3. IMPACT ON PRODUCTION 48
      4. IMPACT ON HYDRATE
      5. IMPACT ON PRICING 49
      6. IMPACT ON WORLD TRADE 49
    13. SOURCES OF ENERGY 47
    14. COVID 19 IMPACT ANALYSIS 48
    15. INHIBITORS INDUSTRY 48
    16. IMPACT ON SUPPLY CHAIN 48
    17. CASH FLOW CONSTRAINTS 49
  8. MARKET FACTOR ANALYSIS 50
    1. SUPPLY CHAIN ANALYSIS 50
      1. RAW MATERIALS SUPPLIERS 51
      2. DISTRIBUTION CHANNEL 52
      3. APPLICATIONS 52
    2. FOR THERMODYNAMIC INHIBITORS (THIS) 51
    3. (LDHIS) 51
    4. HYDRATE INHIBITOR PRODUCERS 51
    5. PORTER’S FIVE FORCES MODEL 53
      1. THREAT OF NEW ENTRANTS
      2. THREAT
      3. BARGAINING POWER OF BUYERS 54
      4. INTENSITY OF COMPETITIVE RIVALRY 54
    6. OF SUBSTITUTES 54
    7. BARGAINING POWER OF SUPPLIERS 54
    8. PRICING ANALYSIS
    9. – BY REGION (USD/TON), 2021 55
    10. GLOBAL MANUFACTURERS MARKET CONCENTRATION RATIO 55
  9. GLOBAL HYDRATE INHIBITORS
  10. MARKET, BY TYPE 56
    1. INTRODUCTION 56
    2. THERMODYNAMIC INHIBITORS (THI) 58
    3. LOW-DOSAGE HYDRATE INHIBITORS (LDHI) 60
  11. GLOBAL HYDRATE INHIBITORS MARKET, BY APPLICATION
    1. INTRODUCTION
    2. OFFSHORE
    3. OPERATIONS 64
    4. ONSHORE OPERATIONS 65
  12. GLOBAL HYDRATE INHIBITORS
  13. MARKET, BY REGION 66
    1. OVERVIEW 66
    2. NORTH AMERICA 70
    3. US 74
    4. CANADA 78
    5. EUROPE 82
    6. GERMANY 87
    7. UK 91
    8. FRANCE 95
    9. ITALY 99
    10. RUSSIA 103
    11. NORWAY 107
    12. NETHERLANDS 111
    13. POLAND 115
    14. DENMARK 119
    15. REST OF EUROPE 123
    16. ASIA-PACIFIC 127
    17. CHINA 132
    18. JAPAN 136
    19. INDIA 140
    20. AUSTRALIA & NEW ZEALAND 144
    21. MIDDLE EAST AND AFRICA 185
  14. INDONESIA 148
  15. SOUTH KOREA 152
  16. THAILAND 156
  17. REST OF ASIA-PACIFIC 160
    1. LATIN AMERICA 164
      1. BRAZIL 169
      2. MEXICO 173
      3. ARGENTINA 177
      4. REST OF LATIN AMERICA
    2. THE
      1. GCC 190
      2. NIGERIA 194
      3. IRAN 198
      4. IRAQ 202
      5. EGYPT 206
      6. REST OF THE MIDDLE EAST AND AFRICA 210
  18. COMPETITIVE LANDSCAPE 214
    1. COMPETITIVE OVERVIEW 214
    2. GLOBAL MARKET STRATEGY ANALYSIS 214
    3. COMPETITIVE BENCHMARKING
    4. COMPETITION
      1. COMPANY OVERVIEW 220
      2. FINANCIAL OVERVIEW 221
      3. PRODUCT OFFERINGS 221
      4. KEY DEVELOPMENTS 222
      5. SWOT ANALYSIS 222
      6. KEY STRATEGIES 222
    5. DASHBOARD 216
    6. COMPANY PROFILES 217
    7. SCHLUMBERGER 217
    8. COMPANY OVERVIEW 217
    9. FINANCIAL OVERVIEW 218
    10. PRODUCT OFFERINGS 218
    11. KEY DEVELOPMENTS 218
    12. SWOT ANALYSIS 219
    13. KEY STRATEGIES 219
    14. BAKER HUGHES, A GE COMPANY LLC 220
    15. BASF SE 223
      1. COMPANY OVERVIEW 223
      2. FINANCIAL OVERVIEW 224
      3. PRODUCT OFFERINGS 224
      4. KEY DEVELOPMENTS 225
      5. SWOT ANALYSIS 225
      6. KEY STRATEGIES 225
    16. HALLIBURTON 226
      1. COMPANY OVERVIEW 226
      2. FINANCIAL OVERVIEW 226
      3. PRODUCT OFFERINGS 227
      4. KEY DEVELOPMENTS 227
      5. SWOT ANALYSIS 227
      6. KEY STRATEGIES 227
  19. COMPANY PROFILES 228
    1. HUNTSMAN INTERNATIONAL LLC 228
      1. COMPANY OVERVIEW 228
      2. FINANCIAL OVERVIEW
      3. COMPANY OVERVIEW 237
      4. FINANCIAL OVERVIEW 238
      5. PRODUCT OFFERINGS 238
      6. KEY DEVELOPMENTS 239
      7. SWOT ANALYSIS 239
      8. KEY STRATEGIES 239
    2. PRODUCT OFFERINGS 229
    3. KEY DEVELOPMENTS 230
    4. SWOT ANALYSIS 230
    5. KEY STRATEGIES 230
    6. ASHLAND 231
    7. COMPANY OVERVIEW 231
    8. FINANCIAL OVERVIEW 232
    9. PRODUCT OFFERINGS 232
    10. KEY DEVELOPMENTS 233
    11. SWOT ANALYSIS 233
    12. KEY STRATEGIES 233
    13. ARKEMA 234
    14. COMPANY OVERVIEW 234
    15. FINANCIAL OVERVIEW 235
    16. PRODUCT OFFERINGS 235
    17. KEY DEVELOPMENTS 236
    18. SWOT ANALYSIS 236
    19. KEY STRATEGIES 236
    20. EVONIK INDUSTRIES AG 237
    21. HUNTSMAN INTERNATIONAL LLC 240
      1. COMPANY OVERVIEW 240
      2. FINANCIAL OVERVIEW
    22. PRODUCT OFFERINGS 241
    23. KEY DEVELOPMENTS 242
    24. SWOT ANALYSIS 242
    25. KEY STRATEGIES 242
    26. ASHLAND 243
      1. COMPANY OVERVIEW
      2. COMPANY OVERVIEW 249
      3. FINANCIAL OVERVIEW 250
      4. PRODUCT OFFERINGS 250
      5. KEY DEVELOPMENTS 251
      6. SWOT ANALYSIS 251
      7. KEY STRATEGIES 251
    27. FINANCIAL OVERVIEW 244
    28. PRODUCT OFFERINGS 244
    29. KEY DEVELOPMENTS 245
    30. SWOT ANALYSIS 245
    31. KEY STRATEGIES 245
    32. ARKEMA 246
    33. COMPANY OVERVIEW 246
    34. FINANCIAL OVERVIEW 247
    35. PRODUCT OFFERINGS 247
    36. KEY DEVELOPMENTS 248
    37. SWOT ANALYSIS 248
    38. KEY STRATEGIES 248
    39. EVONIK INDUSTRIES AG 249
    40. ECOLAB 252
      1. COMPANY OVERVIEW 252
      2. FINANCIAL OVERVIEW 253
      3. PRODUCTS OFFERED 253
      4. KEY DEVELOPMENTS 254
      5. SWOT ANALYSIS 254
      6. KEY STRATEGIES 254
    41. FINORIC LLC 255
      1. COMPANY OVERVIEW 255
      2. FINANCIAL OVERVIEW 255
      3. PRODUCTS OFFERED 255
      4. KEY DEVELOPMENTS
    42. SWOT ANALYSIS 256
    43. KEY STRATEGIES 256
    44. OMNI INDUSTRIAL
      1. COMPANY OVERVIEW 259
      2. FINANCIAL OVERVIEW 260
      3. PRODUCTS OFFERED 260
      4. KEY DEVELOPMENTS
    45. SOLUTIONS 257
    46. COMPANY OVERVIEW 257
    47. FINANCIAL OVERVIEW 257
    48. PRODUCTS OFFERED 257
    49. KEY DEVELOPMENTS 257
    50. SWOT ANALYSIS 258
    51. KEY STRATEGIES 258
    52. TETRA TECHNOLOGIES, INC. 259
    53. SWOT ANALYSIS 261
    54. KEY STRATEGIES 261
    55. APPENDIX 262
    56. REFERENCES 262
    57. RELATED REPORTS 263
  20. LIST OF TABLES
  21. LIST OF ASSUMPTIONS
    1. TABLE 2
  22. MANUFACTURERS MARKET CONCENTRATION RATIO, BY REGION 55
  23. GLOBAL HYDRATE INHIBITORS, BY TYPE, 2019–2030
    1. (USD THOUSAND) 56
    2. TABLE
  24. GLOBAL HYDRATE INHIBITORS MARKET, BY TYPE, 2019–2030 (TONS) 57
  25. GLOBAL HYDRATE
  26. INHIBITORS MARKET FOR THERMODYNAMIC INHIBITORS (THI), BY TYPE, 2019–2030 (USD
    1. THOUSAND) 58
    2. TABLE
  27. GLOBAL HYDRATE INHIBITORS MARKET FOR THERMODYNAMIC INHIBITORS (THI), BY TYPE,
  28. GLOBAL HYDRATE INHIBITORS MARKET FOR THERMODYNAMIC INHIBITORS
    1. (THI), BY REGION, 2019–2030
    2. (USD THOUSAND) 59
  29. GLOBAL HYDRATE INHIBITORS MARKET FOR THERMODYNAMIC
    1. INHIBITORS (THI), BY REGION, 2019–2030 (TONS) 59
  30. GLOBAL HYDRATE INHIBITORS MARKET FOR LOW-DOSAGE
    1. HYDRATE INHIBITORS (LDHI), BY TYPE, 2019–2030
    2. (USD THOUSAND) 60
  31. GLOBAL HYDRATE INHIBITORS MARKET FOR LOW-DOSAGE
    1. HYDRATE INHIBITORS (LDHI), BY TYPE, 2019–2030 (TONS) 60
  32. GLOBAL HYDRATE INHIBITORS
  33. MARKET FOR LOW-DOSAGE HYDRATE INHIBITORS (LDHI), BY REGION, 2019–2030
    1. (USD THOUSAND) 61
  34. GLOBAL HYDRATE
  35. INHIBITORS MARKET FOR LOW-DOSAGE HYDRATE INHIBITORS (LDHI), BY REGION, 2019–2030
    1. (TONS) 61
    2. TABLE
  36. GLOBAL HYDRATE INHIBITORS, BY APPLICATION, 2019–2030 (USD THOUSAND) 62
  37. GLOBAL HYDRATE
  38. INHIBITORS MARKET, BY APPLICATION, 2019–2030 (TONS) 63
  39. GLOBAL HYDRATE INHIBITORS MARKET FOR OFFSHORE
    1. OPERATIONS, BY REGION, 2019–2030 (USD THOUSAND) 64
  40. GLOBAL HYDRATE INHIBITORS MARKET FOR OFFSHORE
    1. OPERATIONS, BY REGION, 2019–2030 (TONS) 64
  41. GLOBAL HYDRATE INHIBITORS MARKET FOR ONSHORE
    1. OPERATIONS, BY REGION, 2019–2030 (USD THOUSAND) 65
  42. GLOBAL HYDRATE INHIBITORS MARKET FOR ONSHORE
    1. OPERATIONS, BY REGION, 2019–2030 (TONS) 65
  43. GLOBAL HYDRATE INHIBITORS MARKET, BY REGION,
  44. GLOBAL HYDRATE INHIBITORS MARKET, BY REGION, 2022-2030(TONS)
    1. TABLE 21
  45. GLOBAL HYDRATE INHIBITORS MARKET, BY TYPE, 2022-2030(USD THOUSAND) 69
  46. GLOBAL HYDRATE
  47. INHIBITORS MARKET, BY TYPE, 2022-2030(TONS) 69
  48. GLOBAL HYDRATE INHIBITORS MARKET, BY APPLICATION,
  49. GLOBAL HYDRATE INHIBITORS MARKET, BY APPLICATION, 2022-2030(TONS)
    1. TABLE 25
  50. NORTH AMERICA HYDRATE INHIBITORS MARKET, BY COUNTRY, 2019–2030 (USD THOUSAND)
    1. TABLE 26
  51. NORTH AMERICA HYDRATE INHIBITORS MARKET, BY COUNTRY, 2019–2030 (TONS) 70
  52. NORTH AMERICA
  53. HYDRATE INHIBITORS MARKET, BY TYPE, 2019–2030 (USD THOUSAND) 70
  54. NORTH AMERICA
  55. HYDRATE INHIBITORS MARKET, BY TYPE, 2019–2030 (TONS) 70
  56. NORTH AMERICA HYDRATE
  57. INHIBITORS MARKET FOR THERMODYNAMIC INHIBITORS (THI), BY TYPE, 2019–2030
    1. (USD THOUSAND) 71
  58. NORTH AMERICA
  59. HYDRATE INHIBITORS MARKET FOR THERMODYNAMIC INHIBITORS (THI), BY TYPE, 2019–2030
    1. (TONS) 71
    2. TABLE
  60. NORTH AMERICA HYDRATE INHIBITORS MARKET FOR LOW-DOSAGE HYDRATE INHIBITORS (LDHI),
    1. BY TYPE, 2019–2030
    2. (USD THOUSAND) 72
  61. NORTH AMERICA HYDRATE INHIBITORS MARKET FOR LOW-DOSAGE HYDRATE
    1. INHIBITORS (LDHI), BY TYPE, 2019–2030
    2. (TONS) 72
  62. NORTH AMERICA HYDRATE INHIBITORS MARKET, BY APPLICATION,
  63. NORTH AMERICA HYDRATE INHIBITORS MARKET, BY APPLICATION, 2019–2030
    1. (TONS) 73
    2. TABLE
  64. US HYDRATE INHIBITORS MARKET, BY TYPE, 2019–2030 (USD THOUSAND) 74
  65. US HYDRATE INHIBITORS
  66. MARKET, BY TYPE, 2019–2030 (TONS) 74
  67. US HYDRATE INHIBITORS MARKET FOR THERMODYNAMIC
    1. INHIBITORS (THI), BY TYPE, 2019–2030 (USD THOUSAND) 75
  68. US HYDRATE INHIBITORS MARKET FOR THERMODYNAMIC
    1. INHIBITORS (THI), BY TYPE, 2019–2030 (TONS) 75
  69. US HYDRATE INHIBITORS MARKET FOR LOW-DOSAGE
    1. HYDRATE INHIBITORS (LDHI), BY TYPE, 2019–2030
    2. (USD THOUSAND) 76
  70. US HYDRATE INHIBITORS MARKET FOR LOW-DOSAGE
    1. HYDRATE INHIBITORS (LDHI), BY TYPE, 2019–2030 (TONS) 76
  71. US HYDRATE INHIBITORS
  72. MARKET, BY APPLICATION, 2019–2030 (USD THOUSAND) 77
  73. US HYDRATE INHIBITORS MARKET, BY APPLICATION,
  74. CANADA HYDRATE INHIBITORS MARKET, BY TYPE, 2019–2030
    1. (USD THOUSAND) 78
    2. TABLE
  75. CANADA HYDRATE INHIBITORS MARKET, BY TYPE, 2019–2030 (TONS) 78
  76. CANADA HYDRATE
  77. INHIBITORS MARKET FOR THERMODYNAMIC INHIBITORS (THI), BY TYPE, 2019–2030 (USD
    1. THOUSAND) 79
    2. TABLE
  78. CANADA HYDRATE INHIBITORS MARKET FOR THERMODYNAMIC INHIBITORS (THI), BY TYPE,
  79. CANADA HYDRATE INHIBITORS MARKET FOR LOW-DOSAGE HYDRATE INHIBITORS
    1. (LDHI), BY TYPE, 2019–2030
    2. (USD THOUSAND) 80
  80. CANADA HYDRATE INHIBITORS MARKET FOR LOW-DOSAGE HYDRATE INHIBITORS
    1. (LDHI), BY TYPE, 2019–2030 (TONS) 80
  81. CANADA HYDRATE INHIBITORS MARKET, BY APPLICATION,
  82. CANADA HYDRATE INHIBITORS MARKET, BY APPLICATION, 2019–2030
    1. (TONS) 81
    2. TABLE
  83. EUROPE HYDRATE INHIBITORS MARKET, BY COUNTRY, 2019–2030 (USD THOUSAND)
    1. TABLE 52
  84. EUROPE HYDRATE INHIBITORS MARKET, BY COUNTRY, 2019–2030 (TONS) 82
  85. EUROPE HYDRATE
  86. INHIBITORS MARKET, BY TYPE, 2019–2030 (USD THOUSAND) 83
  87. EUROPE HYDRATE INHIBITORS
  88. MARKET, BY TYPE, 2019–2030 (TONS) 83
  89. EUROPE HYDRATE INHIBITORS MARKET FOR THERMODYNAMIC
    1. INHIBITORS (THI), BY TYPE, 2019–2030 (USD THOUSAND) 84
    2. style="font-family: arial, helvetic

Hydrate inhibitors Market Segmentation

Market Segmentation Overview

  • Detailed segmentation data will be available in the full report
  • Comprehensive analysis by multiple parameters
  • Regional and country-level breakdowns
  • Market size forecasts by segment
Infographic

Free Sample Request

Kindly complete the form below to receive a free sample of this Report

Get Free Sample

Customer Strories

“I am very pleased with how market segments have been defined in a relevant way for my purposes (such as "Portable Freezers & refrigerators" and "last-mile"). In general the report is well structured. Thanks very much for your efforts.”

Victoria Milne

Founder

Compare Licence

×
Features License Type
Single User Multiuser License Enterprise User
Price $4,950 $5,950 $7,250
Maximum User Access Limit 1 User Upto 10 Users Unrestricted Access Throughout the Organization
Free Customization
Direct Access to Analyst
Deliverable Format
Platform Access
Discount on Next Purchase 10% 15% 15%
Printable Versions