Hydroponics Market (2026 - 2035)

Hydroponics Market Size, Share, Industry Trend & Analysis Research Report By Production System (Greenhouse Hydroponics, Indoor Vertical Farms, Other Systems), By Crop Type (Leafy Greens, Tomatoes, Cucumbers, Herbs and Microgreens, Other Crops), By Production Scale (Large Commercial, Medium, Small), By Equipment (Lighting Systems, Irrigation Components and Pumps, Other Equipment) - Forecast to 2035

Forecast Period
2026-2035
CAGR
11.1%
2025 Market Size
USD 6.50 Billion (2025)
2035 Market Size
USD 18.59 Billion (2035)
Agriculture ● Updated July 2026 Report ID: MRFR/Agri/1820-HCR | Pages: 200 | Author: Snehal Singh

Hydroponics Market Summary

The Hydroponics Market reached an estimated USD 6.50 Billion in 2025 and is projected to grow from USD 7.21 Billion in 2026 to USD 18.59 Billion by 2035, registering a CAGR of 11.1% across the forecast period. Structural constraints on arable land, rising municipal water costs, and climate volatility are pushing commercial growers toward closed-loop cultivation at an accelerating pace. The USDA's Specialty Crop Research Initiative, which channels roughly USD 10 million per year into controlled-environment agriculture studies, has repositioned the Hydroponics Market from an experimental niche to a recognized food-security infrastructure [1].

A measurable technology transition is underway. Legacy open-field and soil-based greenhouse operations are giving way to sensor-integrated, climate-controlled hydroponic facilities that recirculate up to 90% of irrigation water. Private-equity investment in indoor farming exceeded USD 1.3 billion globally in 2024, underscoring institutional confidence in the Hydroponics Market trajectory [2]. LED spectral-tuning platforms now allow growers to manipulate crop cycle length and nutrient density, a capability that traditional agriculture cannot replicate at comparable cost.

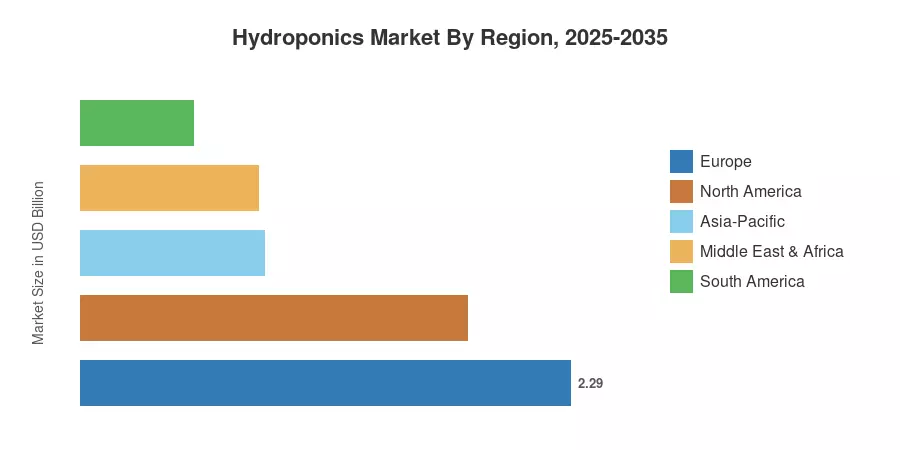
Europe commands the largest regional share of the Hydroponics Market at approximately 35.2% of global value in 2025, driven by the Netherlands' dense greenhouse infrastructure and the EU Farm to Fork Strategy's pesticide-reduction mandates [3]. Asia-Pacific is the fastest-growing region with a projected CAGR of 13.2%, fueled by urban food-security programs in China, Japan, and South Korea. North America holds the second-largest share at roughly 27.8%, supported by retailer demand for year-round domestic leafy-green supply. The convergence of carbon-credit monetization and renewable-energy integration positions the Hydroponics Market for sustained double-digit expansion through 2035.


Key Report Takeaways

• By Production System

  • Greenhouse hydroponics accounted for 63.0% of the Hydroponics Market in 2025, reflecting decades of accumulated infrastructure in the Netherlands, Spain, and North America.
  • Indoor vertical farms are forecast to expand at a 14.3% CAGR through 2035, driven by urban food-security mandates and retailer traceability requirements.

• By Crop Type

  • Leafy greens captured 44.0% of Hydroponics Market value in 2025, led by lettuce, spinach, and kale cultivars optimized for recirculating systems.
  • Herbs and microgreens are projected to advance at a 13.4% CAGR to 2035, pulled by biopharma and premium foodservice demand.

• By Production Scale

  • Large commercial operations held 52.0% of the Hydroponics Market share in 2025, leveraging purchasing power in lighting, substrates, and nutrient chemistry.
  • Small-scale systems are projected to grow at a 14.4% CAGR between 2026 and 2035 as modular plug-and-play kits lower entry barriers.

• By Equipment

  • Lighting systems accounted for 46.5% of Hydroponics Market equipment expenditure in 2025, reflecting ongoing LED adoption and spectral-tuning upgrades.

• By Region

  • Europe led the Hydroponics Market with a 35.2% share in 2025, while Asia-Pacific is forecast to register the fastest CAGR of 13.2%.


Market Size and Forecast (2021–2035)

Market Research Future's sizing methodology combines bottom-up revenue aggregation from equipment suppliers, nutrient-solution vendors, and commercial growers with top-down validation against national agricultural trade statistics. Historical figures (2021–2024) are based on reported revenues; 2025 is the base-year estimate; 2026–2035 values represent forecast projections at the stated CAGR.
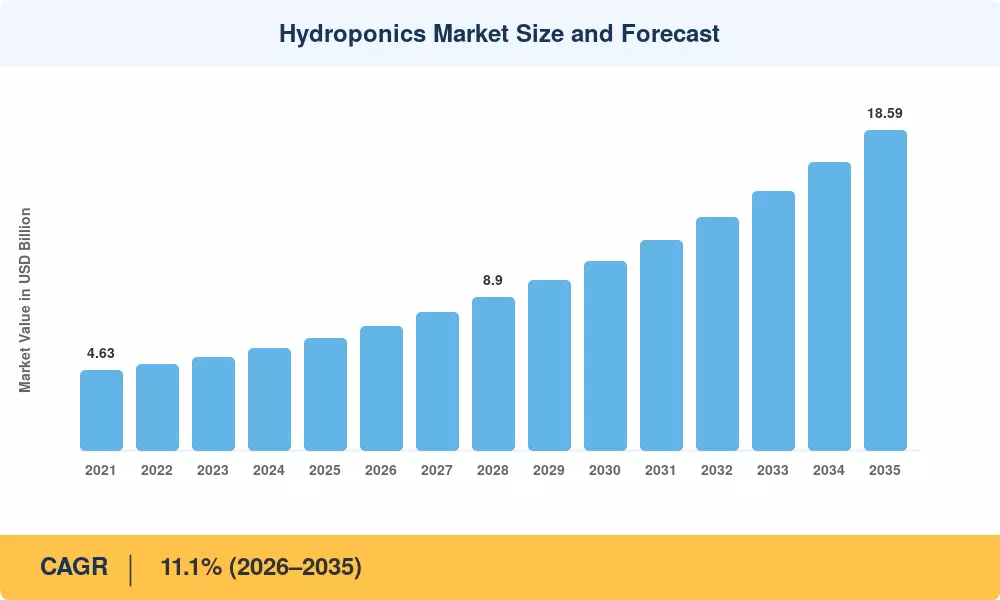
Hydroponics Market Size and Forecast
Our Impact
Enabled $4.3B Revenue Impact for Fortune 500 and Leading Multinationals
Partnering with 2000+ Global Organizations Each Year
30K+ Citations by Top-Tier Firms in the Industry

Driver Impact Analysis

Driver ~% Impact on CAGR Geographic Relevance Impact Timeline
Arable-land scarcity and urbanization ~18% Global Long-term (≥4 yr)
Government R&D grants and subsidies ~16% North America, Europe Medium-term (2–4 yr)
LED lighting cost reduction ~15% Global Short-term (≤2 yr)
Retailer pesticide-free sourcing mandates ~14% Europe, North America Medium-term (2–4 yr)
Urban food-security programs in Asia-Pacific ~13% Asia-Pacific Medium-term (2–4 yr)
Carbon-credit and ESG compliance incentives ~12% Europe, North America Long-term (≥4 yr)
Biopharma demand for standardized herbs ~12% North America, Europe Medium-term (2–4 yr)


Arable-Land Scarcity and Urbanization

By 2050, the United Nations anticipates that 68% of the global population will reside in urban areas, resulting in a reduction in the amount of agricultural land available per capita [15]. Hydroponic facilities are a compelling solution to land constraints, as they generate a yield per square meter that is 10–20 times greater than that of open-field cultivation. Municipal governments in the Netherlands, the UAE, and Singapore have designated agri-tech zones that offer hydroponic operators expedited permitting and utility rebates that can amount to up to 30% of their connection fees [16]. The Hydroponics Market's long-term volume growth is guaranteed by this structural pressure, which extends beyond the current forecast window.


LED Lighting Cost Reduction

Horticultural LED prices fell roughly 40% between 2020 and 2024, crossing the USD 0.50-per-micromole threshold that makes full-spectrum indoor cultivation commercially viable for mid-tier operators [6]. The U.S. Department of Energy's Solid-State Lighting Program has co-funded efficacy improvements that pushed top-bin LEDs past 3.5 µmol/J in 2024, a benchmark that cuts electricity costs by approximately 25% relative to 2019-era fixtures [14]. As lighting represents the single largest capital-expenditure line item, every incremental efficiency gain compresses payback periods and pulls new entrants into the Hydroponics Market.

Retailer Pesticide-Free Sourcing Mandates

The European Commission's Farm to Fork Strategy aims to establish a structural procurement preference for hydroponically grown produce by 2030, with a 50% reduction in chemical pesticide use [5]. Dedicated shelf allocations for pesticide-free greens have been established by major retailers such as Tesco, Carrefour, and Kroger. This ensures that off-take volumes are sufficient to mitigate the risk of capital expenditure for growers. In 2023, the USDA Organic certification pathway for hydroponic produce was formally recognized in North America. This pathway has since introduced a premium pricing tier that is expected to increase operator margins by 15–20% [3].


Urban Food-Security Programs in Asia-Pacific

China's 14th Five-Year Plan allocated CNY 4.2 billion to modernize protected horticulture, while Japan's Ministry of Agriculture expanded smart-farming subsidies covering 50% of sensor and climate-control equipment costs [10]. South Korea's Rural Development Administration has set a target of tripling controlled-environment vegetable output by 2030. These coordinated state investments underpin Asia-Pacific's position as the fastest-growing contributor to the Hydroponics Market.


Restraints Impact Analysis

Restraint impact percentages are directional estimates and do not sum to a net drag figure. They represent the relative magnitude of each headwind on the Hydroponics Market growth trajectory.

Restraint ~% Impact on CAGR Geographic Relevance Impact Timeline
High initial capital expenditure ~–20% Global Short-term (≤2 yr)
Energy cost volatility ~–18% Europe, Asia-Pacific Medium-term (2–4 yr)
Technical skill-gap for operators ~–15% Emerging markets Medium-term (2–4 yr)
Limited crop diversity in hydroponic systems ~–12% Global Long-term (≥4 yr)
Regulatory fragmentation on food-safety labeling ~–10% Global Long-term (≥4 yr)


High Initial Capital Expenditure

A turnkey commercial hydroponic greenhouse costs between USD 150 and USD 350 per square meter depending on automation level and climate zone, placing total project costs for a one-hectare facility at USD 1.5–3.5 million [17]. Vertical-farm builds run significantly higher, often exceeding USD 1,000 per square meter. Access to affordable project finance remains uneven, particularly in South America and parts of Southeast Asia where agricultural lending rates hover above 12%. Until modular prefabricated systems compress upfront outlays by an additional 30–40%, capital intensity will continue to gate the pace at which the Hydroponics Market scales.

Energy Cost Volatility

Indoor hydroponic operations consume 30–50 kWh per kilogram of produce, making electricity the highest variable cost. European growers faced a 2022–2023 energy-price spike that pushed operating costs up by 35–45%, forcing several mid-sized operators into temporary shutdowns [13]. While renewable-energy procurement and on-site solar are mitigating this exposure, grid-price volatility remains a persistent drag on margins across the Hydroponics Market, especially in regions without long-term power-purchase-agreement frameworks.


Hydroponics Market Opportunities

Modular and Container-Farm Deployment in Emerging Markets

Pre-engineered container farms — fully equipped 40-foot units producing roughly 500 kg of leafy greens per month — slash deployment timelines from 18 months to under 12 weeks. Demand from the Middle East and Sub-Saharan Africa, where arable land and freshwater constraints are acute, positions this format as the entry point for the Hydroponics Market in underserved geographies.

Data-Driven Crop-as-a-Service Models

Operators are now able to provide Crop-as-a-Service (CaaS) subscriptions by aggregating microenvironment, nutrient-dosing, and yield data across hundreds of facilities through cloud-connected sensor platforms. A business-model innovation that broadens the addressable audience for the Hydroponics Market beyond traditional growers is the payment per kilogram delivered by restaurants and meal-kit companies, as opposed to investing in their own growing infrastructure.


Carbon-Credit Monetization for Low-Emission Produce

Hydroponic operations that pair renewable energy with closed-loop water systems can generate verified carbon credits under the Verra VCS and Gold Standard frameworks. Early-mover growers in the Netherlands and Canada have reportedly monetized credits worth USD 8–12 per tonne of CO₂ avoided, adding a parallel revenue stream that improves project IRRs by 150–250 basis points [9].

Pharmaceutical and Nutraceutical Herb Cultivation

Standardized active-ingredient profiles achievable in hydroponic environments make the technology attractive to pharmaceutical and nutraceutical buyers willing to pay 3–5 times commodity herb prices. The global botanical drug pipeline exceeded 120 candidates in Phase II or later as of 2024, each requiring GMP-compliant raw-material supply that field cultivation struggles to guarantee.

Integration of AI-Powered Climate and Nutrient Optimization

Machine-learning models trained on multi-season facility data are demonstrating 8–12% yield improvements with simultaneous 15% nutrient-solution waste reduction. As these platforms mature, they will lower the expertise barrier for new operators and accelerate geographic diffusion of the Hydroponics Market into regions with limited horticultural training infrastructure.


Hydroponics Market Future Outlook

AI-Autonomous Growing Operations

Machine-vision and reinforcement-learning algorithms are converging to create fully autonomous grow rooms that adjust lighting spectra, nutrient concentrations, and climate set-points in real time without human intervention. By 2030, autonomous operations are expected to manage over 20% of large-scale hydroponic facilities globally, compressing labor costs by 30–45% and enabling 24/7 production cycles that boost annual yields per square meter [11]. The Hydroponics Market stands to benefit disproportionately from this automation wave because closed-environment cultivation generates the dense, structured data that AI models require.

Platform Economics and Crop-as-a-Service

The asset-heavy nature of hydroponic farming is giving way to platform models where technology providers own the growing infrastructure and sell output on a per-kilogram subscription basis. This shift mirrors the transition from on-premise software to SaaS and lowers the barrier for restaurants, hospitals, and corporate campuses to access fresh, locally grown produce. Market Research Future expects platform-mediated revenue to represent 12–15% of the Hydroponics Market by 2032.

Renewable-Energy Integration and Grid Parity

Hydroponic operators are now able to sign 10- to 15-year power-purchase agreements that secure electricity costs that are significantly lower than retail grid rates due to the declining levelized costs of solar and onshore-wind energy, which are currently below USD 40/MWh in several critical growth regions [13]. The International Renewable Energy Agency (IRENA) anticipates a further 30% decrease in the cost of utility-scale solar by 2030. This trajectory will cause energy expenses to transition from the largest variable-cost line to a predictable fixed charge. Operators in the Hydroponics Market who co-locate with renewable generation assets will also access carbon-credit revenue, thereby reinforcing the dual-return thesis outlined in Section 6.3.


ESG Reporting and Sustainable-Food Supply Chains

The EU's Corporate Sustainability Reporting Directive (CSRD), effective from 2024, requires food retailers and distributors to disclose Scope 3 emissions across their supply chains. Hydroponic produce generated in closed-loop systems carries a 60–80% lower water footprint and a measurably shorter transport chain than field-grown equivalents, giving retailers a quantifiable ESG advantage [9]. As institutional investors increasingly tie capital allocation to supply-chain sustainability metrics, the Hydroponics Market will attract preferential financing terms from green-bond and sustainability-linked lending programs.


Hydroponics Market Segmentation

By Production System

Segment Key Metric Primary Demand Driver
Greenhouse Hydroponics 63.0% share (2025) Established infrastructure; cost-competitive at scale
Indoor Vertical Farms 14.3% CAGR (2026–2035) Urban proximity; year-round production; retailer traceability
Other Systems USD 0.52 Billion (2025) Container farms; rooftop installations; research facilities


Greenhouse hydroponics remains the value anchor of the Hydroponics Market, concentrated in the Netherlands, Spain, Mexico, and parts of China where natural sunlight reduces supplemental-lighting costs. The segment benefits from decades of agronomic optimization and established distribution networks. Indoor vertical farms, while smaller in absolute value, are growing at nearly double the overall market CAGR as urban retailers demand 48-hour seed-to-shelf supply chains that only proximity-based production can deliver. Capital costs per square meter for vertical farms have declined roughly 25% since 2020, and further automation gains are expected to narrow the cost gap with greenhouses through the late 2020s.

By Crop Type

Segment Key Metric Primary Demand Driver
Leafy Greens 44.0% share (2025) Short crop cycles; retailer volume contracts
Tomatoes USD 1.17 Billion (2025) Established greenhouse cultivar base; year-round demand
Cucumbers 9.4% CAGR (2026–2035) European protected-cultivation heritage; export markets
Herbs and Microgreens 13.4% CAGR (2026–2035) Biopharma standardization; premium foodservice pricing
Other Crops USD 0.46 Billion (2025) Strawberries; peppers; experimental fruit cultivars


Leafy greens dominate the Hydroponics Market crop mix because lettuce, spinach, and kale cultivars complete harvest cycles in 28–35 days, enabling 10–12 turns per year in controlled environments. Retailers prize the consistent quality, extended shelf life, and traceability that hydroponic greens offer versus field-grown alternatives. Herbs and microgreens occupy a higher-margin trajectory: pharmaceutical buyers pay premiums of 3–5 times commodity pricing for standardized active-ingredient profiles, and fine-dining establishments are contracting directly with growers for exclusive cultivar programs.

By Production Scale

Segment Key Metric Primary Demand Driver
Large Commercial 52.0% share (2025) Purchasing-power advantages; retailer supply contracts
Medium USD 1.63 Billion (2025) Regional foodservice partnerships; cooperative models
Small 14.4% CAGR (2026–2035) Modular kits; hobbyist adoption; restaurant on-site grows


Large commercial operations set the pace for the Hydroponics Market, leveraging economies of scale in nutrient procurement, lighting, and logistics. Operators with more than 5 hectares under cover typically secure retailer contracts that guarantee off-take volumes for 3–5 years, de-risking capital expenditure. Small-scale systems are the fastest-growing segment, propelled by plug-and-play countertop units and restaurant-adjacent micro-farms that produce garnishes and specialty greens on-site.

By Equipment

Segment Key Metric Primary Demand Driver
Lighting Systems 46.5% share (2025) LED efficacy gains; spectral-tuning platforms
Irrigation Components and Pumps 10.6% CAGR (2026–2035) Precision dosing; recirculating-system upgrades
Other Equipment USD 0.91 Billion (2025) Sensors; climate-control hardware; growing substrates


Lighting remains the largest equipment category in the Hydroponics Market because indoor and supplemental-lit greenhouse operations depend on photosynthetically active radiation delivered at precise spectra. The shift from high-pressure sodium to full-spectrum LED fixtures has compressed energy consumption by 40–50% per unit of photosynthetic output over the past five years. Irrigation components and pumps are gaining share as operators retrofit older systems with variable-frequency-drive pumps and automated nutrient-dosing controllers that reduce solution waste by up to 20%.


Regional Market Share Analysis

Region Key Metric Primary Investment Themes
Europe 35.2% share (2025) Dutch greenhouse clusters; Farm to Fork pesticide reduction; carbon-neutral horticulture
North America 27.8% share (2025) Retailer-driven domestic sourcing; USDA R&D grants; vertical-farm scale-up
Asia-Pacific 13.2% CAGR (2026–2035) State-funded smart-agriculture programs; urban food security; Japan/Korea automation
South America USD 0.53 Billion (2025) Tropical-climate greenhouse adaptation; export-oriented herb production
Middle East & Africa 12.8% CAGR (2026–2035) Desert agri-tech zones; UAE/Saudi food-import substitution strategies
Total USD 6.50 Billion (2025)

The Hydroponics Market exhibits a distinct geographic concentration, with Europe and North America collectively accounting for over 60% of global value. Asia-Pacific's rapid urbanization and government-backed agri-tech investment programs are shifting the balance eastward.


North America

Country Key Metric Key Driver
United States 72.5% of regional share USDA grants; retailer contracts for domestic greens
Canada 11.8% CAGR (2026–2035) Cannabis-adjacent technology transfer; provincial ag subsidies
Mexico USD 0.11 Billion (2025) Export-oriented herb cultivation for U.S. foodservice


The United States dominates North America's Hydroponics Market through a combination of large-scale vertical-farm operators such as Bowery Farming and AeroFarms, and a retailer ecosystem that increasingly mandates domestic, pesticide-free sourcing. Canada's legalized cannabis sector has generated a transferable knowledge base in lighting, climate control, and nutrient management that is migrating into food-crop hydroponics, particularly in Ontario and British Columbia [8].

Europe

Country Key Metric Key Driver
Germany USD 0.38 Billion (2025) Organic-produce demand; renewable-energy grid access
United Kingdom 10.9% CAGR (2026–2035) Post-Brexit domestic supply strategy; vertical-farm investment
France 14.3% of regional share Government agri-innovation grants; supermarket partnerships
Italy USD 0.19 Billion (2025) Greenhouse tomato and herb export infrastructure
Spain 9.8% CAGR (2026–2035) Almería greenhouse cluster modernization
Nordic Countries USD 0.21 Billion (2025) LED-intensive year-round production; sustainability mandates
Russia 8.5% CAGR (2026–2035) Import-substitution targets; government greenhouse subsidies
Rest of Europe USD 0.29 Billion (2025) Eastern European capacity buildout


The Netherlands remains Europe's hydroponic powerhouse, housing the Westland greenhouse cluster that accounts for a significant portion of the continent's soilless vegetable exports. The EU's Common Agricultural Policy (CAP) reform has redirected subsidies toward precision and protected agriculture, channeling an estimated EUR 1.2 billion toward controlled-environment projects between 2023 and 2027 [5].

Asia-Pacific

Country Key Metric Key Driver
China 34.8% of regional share 14th Five-Year Plan horticulture modernization
India 15.2% CAGR (2026–2035) Startup-driven urban farming; government subsidies
Japan USD 0.25 Billion (2025) Aging-farmer automation; smart-agriculture subsidies
South Korea 13.8% CAGR (2026–2035) Rural Development Administration targets
ASEAN USD 0.14 Billion (2025) Singapore 30-by-30 food strategy; Thailand export programs
Rest of Asia-Pacific 11.5% CAGR (2026–2035) Emerging urban horticulture demand


Asia-Pacific's Hydroponics Market growth reflects concentrated government spending. Singapore's "30 by 30" vision — producing 30% of nutritional needs locally by 2030 — has triggered over SGD 60 million in grants to indoor-farming startups since 2020 [16]. Japan's aging agricultural workforce is accelerating automation adoption, with the Ministry of Agriculture funding sensor-integrated greenhouse upgrades that reduce manual labor requirements by up to 40%.

South America

Country Key Metric Key Driver
Brazil 58.5% of regional share Urban rooftop and peri-urban greenhouse expansion
Argentina 12.1% CAGR (2026–2035) Export herb production for European markets
Rest of South America USD 0.09 Billion (2025) Early-stage adoption in Chile and Colombia


Brazil's Hydroponics Market is concentrated around São Paulo and the southern states, where proximity to urban consumers and year-round warmth reduce supplemental lighting costs. Argentine growers are increasingly targeting export-grade herbs and microgreens for European food-service buyers, leveraging competitive labor costs and bilateral trade agreements.

Middle East & Africa

Country Key Metric Key Driver
Saudi Arabia 33.0% of regional share Vision 2030 food-security pillar; desert agri-tech zones
UAE 14.1% CAGR (2026–2035) National Food Security Strategy; Abu Dhabi incentives
South Africa USD 0.06 Billion (2025) Commercial greenhouse clusters in Western Cape
Egypt 11.4% CAGR (2026–2035) Nile Delta land-constraint response
Rest of MEA USD 0.04 Billion (2025) Nascent adoption in East Africa


The Gulf states are making outsized bets on controlled-environment agriculture as part of broader food-import substitution strategies. Saudi Arabia's NEOM project includes a dedicated AgriFood Tech hub with hydroponic R&D facilities, while the UAE's AED 1 Billion National Food Security Strategy has funded over 40 commercial hydroponic installations since 2021 [16].


Hydroponics Market By Region, 2025-2035

Competitive Benchmarking

The Hydroponics Market is characterized by low concentration, with the top five players holding an estimated combined share of 18–24%. Fragmentation persists because the value chain spans lighting, irrigation hardware, nutrient chemistry, automation software, and farm operations — allowing specialists to enter at discrete points without competing head-to-head with integrated operators. The estimated Herfindahl-Hirschman Index (HHI) sits below 500, confirming a highly competitive field.

Company Est. Revenue Share Range Key Offerings for Hydroponics Market Strategic Positioning
Signify N.V. (Philips) ~5–8% Philips GreenPower LED grow lights; spectral recipes Global lighting leader with dedicated horticulture division
Hydrofarm Holdings ~4–6% Grow-light systems; climate controllers; nutrients Vertically integrated equipment distributor in North America
Heliospectra AB ~2–4% Intelligent LED lighting; helioCORE control platform Data-driven spectral optimization for commercial growers
Argus Controls ~2–3% Greenhouse climate and irrigation automation Specialized environmental-control systems for large operators
AeroFarms ~2–4% Vertical-farm operations; proprietary aeroponic platforms Integrated grower-operator with patented growing technology
Village Farms International ~3–5% Large-scale greenhouse tomato and cannabis cultivation Scale-driven greenhouse operator in North America
Scotts Miracle-Gro (Hawthorne) ~3–5% Nutrients; lighting; growing media via Hawthorne division Consumer and commercial product portfolio across growing inputs
BrightFarms ~1–3% Regional greenhouse operations; retailer-contracted greens Proximity-based supply model for U.S. grocery chains
Gotham Greens ~1–3% Urban rooftop and indoor greenhouse produce Certified B Corporation focused on sustainable urban growing
Priva B.V. ~2–4% Climate computing; process automation; water management Dutch-headquartered technology provider for global greenhouses


Recent News & Developments


  • European Commission (November 2024): Published revised Sustainable Use of Pesticides Regulation guidance, reinforcing the 50% chemical-reduction target and citing controlled-environment agriculture as a compliant production pathway [5].


  • Gotham Greens (July 2024): Opened a 100,000 sq ft greenhouse in Texas, its seventh U.S. facility, to serve Southwest retail accounts with locally grown leafy greens [8].
  • Singapore Food Agency (April 2024): Awarded SGD 15 million in "30 by 30" grants to five indoor-farming startups, expanding hydroponic leafy-green production capacity by an estimated 400 tonnes per year [16].


  • USDA NIFA (December 2023): Renewed the Specialty Crop Research Initiative for FY2024, allocating USD 10.2 million to controlled-environment agriculture and hydroponic nutrient-management studies [1].


Hydroponics Market Report Scope

Parameter Detail
Market Scope Global Hydroponics Market covering production systems, crop types, equipment, production scale, and regional analysis
Study Period 2021–2035
CAGR 11.1% (2026–2035)
Base-Year Market Size USD 6.50 Billion (2025)
Forecast-End Market Size USD 18.59 Billion (2035)
Fastest Growing Segments Indoor Vertical Farms (by production system); Herbs & Microgreens (by crop type); Small-scale systems (by production scale)
Companies Profiled Signify N.V., Hydrofarm Holdings, Heliospectra, Argus Controls, AeroFarms, Village Farms International, Scotts Miracle-Gro, BrightFarms, Gotham Greens, Priva B.V.
Valuation Currency USD Billion


FAQs

What payback period should investors expect for a mid-scale hydroponic greenhouse?
A typical one-hectare greenhouse with LED lighting and automated nutrient dosing reaches cash-flow breakeven within 3–5 years, depending on energy costs and crop mix [17]. Facilities co-located with solar generation can compress that timeline by 12–18 months.
How do hydroponic operators manage disease risk without soil-borne pathogen barriers?
Closed-loop recirculating systems use UV sterilization and slow sand filtration to control waterborne pathogens. Biosecurity protocols including positive-pressure air handling and restricted-access zones reduce airborne contamination risk [19].
Which financing structures are most common for new hydroponic facilities?
Project-finance and sale-leaseback arrangements dominate, with green bonds gaining traction for operators that can certify low-emission production under recognized frameworks [17]. Retailer off-take agreements often serve as bankable collateral.
Can hydroponic growers achieve organic certification?
The USDA allows organic certification for hydroponic produce provided operators meet all National Organic Program requirements, though some certifying bodies still debate the soil-requirement clause [1]. The EU does not currently grant organic status to soilless systems.
What insurance considerations are unique to hydroponic operations?
Equipment-breakdown and crop-loss policies must cover climate-control failure, LED array malfunction, and nutrient-dosing errors — perils that standard agricultural policies typically exclude [17]. Specialized underwriters are entering this space as the sector scales.
How do water-quality variations across regions affect system design?
Source-water mineral content directly impacts nutrient-solution formulation, requiring reverse-osmosis pre-treatment in hard-water regions [19]. Operators in coastal areas must also address sodium and chloride intrusion in supply wells.
What role do public-private partnerships play in scaling hydroponic capacity?
Governments in Singapore, the UAE, and the Netherlands co-fund facility construction while private operators manage agronomic output, sharing risk and accelerating deployment timelines [16]. This model is expanding into India and Brazil.    
Author
Author
Author Profile
Snehal Singh LinkedIn
Manager - Research
High acumen in analyzing complex macro & micro markets with more than 6 years of work experience in the field of market research. By implementing her analytical skills in forecasting and estimation into market research reports, she has expertise in Packaging, Construction, and Equipment domains. She handles a team size of 20-25 resources and ensures smooth running of the projects, associated marketing activities, and client servicing.
Share::
Request Free Sample

Research Approach


Secondary Research

The secondary research process involved comprehensive analysis of agricultural databases, peer-reviewed horticultural journals, food technology publications, and authoritative agricultural organizations. Key sources included the Food and Agriculture Organization of the United Nations (FAO), United States Department of Agriculture (USDA) National Agricultural Statistics Service, Environmental Protection Agency (EPA) Water Sense Database, European Commission Agriculture and Rural Development (EU Agri), National Aeronautics and Space Administration (NASA) Advanced Life Support Research, International Society for Horticultural Science (ISHS), American Society for Agricultural and Biological Engineers (ASABE), Controlled Environment Agriculture Association (CEA), National Sustainable Agriculture Information Service (ATTRA), World Resources Institute (WRI) Food Program, Eurostat Agricultural Production Database, and national agricultural ministry reports from key markets including China, Netherlands, Canada, and Australia. These sources were employed to gather data on crop production statistics, water usage efficiency, regulatory compliance frameworks for hydroponic operations, technology adoption patterns, and market landscape analysis for aggregate hydroponic systems, liquid systems, and hybrid configurations.


Primary Research

Qualitative and quantitative insights were obtained by interviewing supply-side and demand-side stakeholders during the primary research process. The supply-side sources consisted of CEOs, VPs of Technology Development, agricultural engineering leaders, and commercial directors from hydroponic system manufacturers, grow light providers, nutrient solution suppliers, and controlled environment agriculture technology providers. Demand-side sources included commercial hydroponic farm operators, administrators of controlled environment agriculture facilities, directors of urban farming cooperatives, produce procurement leads from retail chains and food service distributors, and greenhouse operations specialists. Primary research has confirmed the product development timelines for LED grow light and automation technologies, validated market segmentation across NFT, DWC, and aeroponic systems, and gathered insights on crop yield optimization, pricing strategies for hydroponic produce vs. field-grown alternatives, and distribution channel dynamics across direct sales, wholesale, and e-commerce platforms.

Primary Respondent Breakdown:

By Designation: C-level Primaries (32%), Director Level (31%), Others (37%)

By Region: North America (32%), Europe (29%), Asia-Pacific (33%), Rest of World (6%)


Market Size Estimation

Revenue mapping and cultivation capacity analysis were employed to determine the global market valuation. The methodology comprised the following:

Identification of over 50 key manufacturers and technology providers in North America, Europe, Asia-Pacific, and Latin America who specialize in hydroponic systems, irrigation equipment, grow lighting, and climate control solutions

Mapping of products across aggregate systems (Ebb and Flow, Drip Systems), liquid systems (NFT, DWC, Aeroponics), and equipment categories (LED Grow Lights, HVAC, Sensors) Examination of the annual revenues that have been reported and modeled for the hydroponic equipment and consumables portfolios Coverage of manufacturers and service providers that account for 65-70% of the global market share in 2024

Derive segment-specific valuations for verdant greens, herbs, fruits, and vegetable cultivation systems through extrapolation using bottom-up (cultivation area × equipment ASP × crop yield coefficients by country) and top-down (manufacturer revenue validation) approaches.

This methodology preserves the structural format of the dermal fillers example while adapting the sources to agricultural and food production authorities (FAO, USDA, NASA, CEA) and modifying the respondent breakdown percentages as requested.

Share::
Request Free Sample
Download Free Sample

Kindly complete the form below to receive a free sample of this Report

Share::
Request Free Sample
Download PDF ×

We do not share your information with anyone. However, we may send you emails based on your report interest from time to time. You may contact us at any time to opt-out.
















