Vertical Farming Market Summary
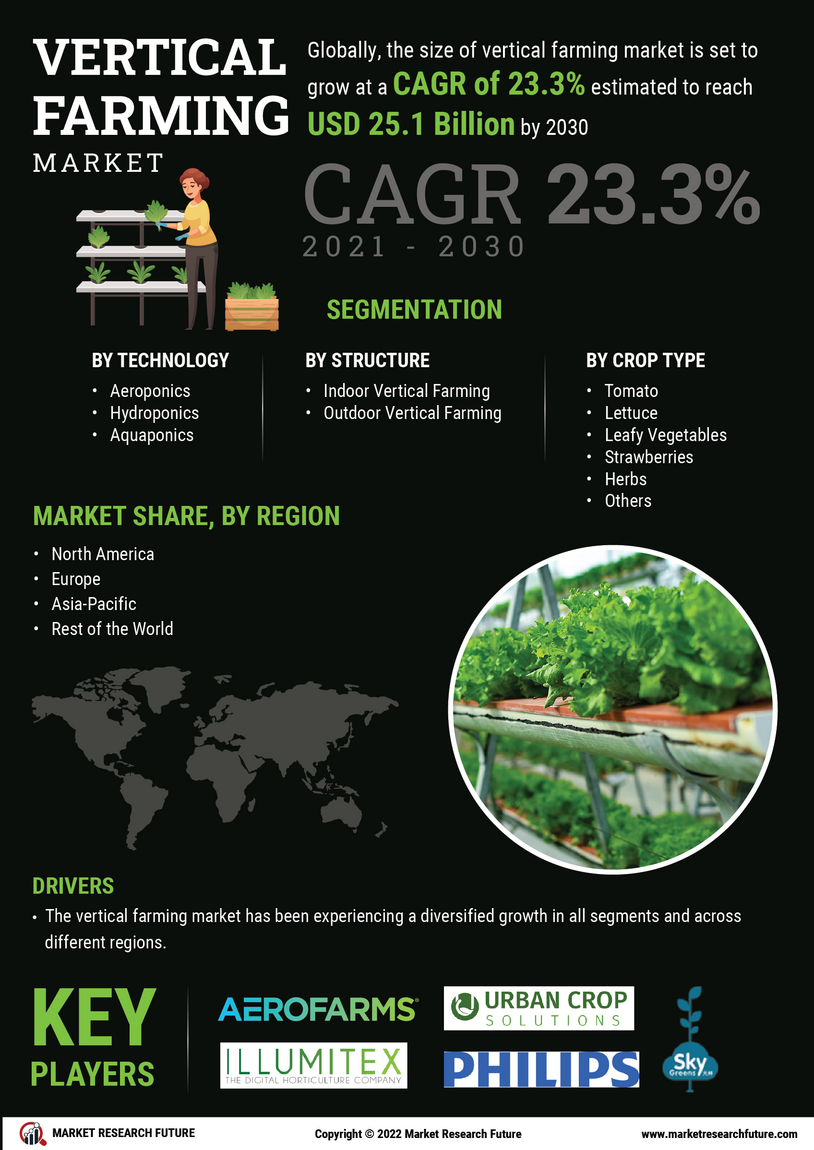
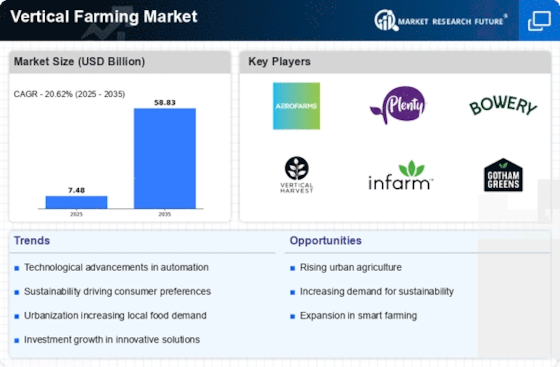
As per MRFR Analysis, the global vertical farming market was valued at USD 6.2 Billion in 2023 and is projected to reach USD 58.79 Billion by 2035, growing at a CAGR of 20.61% from 2025 to 2035. The market is driven by increasing population demands, higher yields compared to conventional farming, and the need for sustainable agricultural practices. Vertical farming offers year-round crop production, reduced environmental impact, and efficient use of space, making it a viable solution to global food challenges. Key technologies include hydroponics, aeroponics, and advanced climate control systems, with container-based farms leading the market structure. North America is expected to dominate the market, followed by Europe and Asia-Pacific, where rapid urbanization and technological advancements are fueling growth.
Key Market Trends & Highlights
The vertical farming market is witnessing significant growth due to various technological and environmental factors.
- Market Size in 2023: USD 6.2 Billion
- Projected Market Size by 2035: USD 58.79 Billion
- CAGR from 2025 to 2035: 20.61%
- Container-based vertical farms accounted for 53.32% of the market in 2022
Market Size & Forecast
2023 Market Size: USD 6.2 Billion
2024 Market Size: USD 7.48 Billion
2035 Market Size: USD 58.79 Billion
Largest Regional Market Share in 2024: North America
Major Players
Vertical Harvest, BrightFarms, Urban Crop Solutions, Gotham Greens, Plenty, Sky Greens, Green Spirit Farms, AeroFarms, Bowery Farming, Mirai Foods, Iron Ox, CropOne Holdings, Kalera, Farm.One, Nongshim
Key Vertical Farming Market Trends Highlighted
The Vertical Farming Market is undergoing major market trends, which are being driven by increased urbanization and a growing desire for fresh, locally sourced products. As more people move to cities, conventional farming confronts issues such as space constraints and soil erosion. Vertical farming tackles these difficulties by using controlled settings to grow crops in urban locations where traditional agriculture is impracticable. Furthermore, the sustainability focus is a crucial market driver, as both consumers and governments prioritize lowering carbon footprints and saving water resources. Vertical farming systems, such as hydroponics and aeroponics, need substantially less water than traditional agricultural methods while producing better yields.
There are several opportunities in the global landscape, particularly in terms of technological integration. Advances in LED lighting, sensor technology, and automation systems offer substantial opportunities for vertical farms to increase yields while decreasing operational costs. Innovative startups and established enterprises are looking into smart farming technologies to improve crop monitoring and resource management. Furthermore, collaborations between technology businesses and agricultural corporations might result in the creation of novel solutions that address global food security challenges. Recent trends also reveal shifting customer tastes, with a greater emphasis on organic and pesticide-free foods.
This transition offers a favorable climate for vertical farms, which may provide fresh fruit free of hazardous pesticides. As environmental restrictions tighten, vertical farming can provide compliance solutions that meet consumer and government needs for safe and sustainable food supplies. Overall, the Vertical Farming Market is expected to increase as it responds to these dynamic trends and market factors by offering creative solutions to current agricultural concerns.

Source: Primary Research, Secondary Research, MRFR Database and Analyst Review
Vertical Farming Market Drivers
Rising Urban Population Driving Demand for Fresh Produce
The Vertical Farming Market Industry is experiencing growth primarily due to the rapid increase in urban populations. According to data from the United Nations, by 2050, approximately 68% of the global population is expected to live in urban areas, leading to increased demand for locally sourced and fresh produce. As cities expand, traditional farming methods face significant challenges such as limited arable land and environmental constraints.
Organizations like the Food and Agriculture Organization (FAO) are advocating for innovative solutions such as vertical farms, which provide fresh produce using significantly smaller land footprints. Furthermore, city planners and local governments are starting to recognize vertical farming as a viable solution to ensure food security in densely populated areas. This growing recognition and support for urban agriculture initiatives are likely to propel the vertical farming market forward.
Technological Advancements Enhancing Yield and Efficiency
Significant advancements in agricultural technologies are revolutionizing the Vertical Farming Market Industry. The adoption of smart farming technologies, including Internet of Things (IoT) solutions and automated systems, significantly improves crop yield and resource efficiency. For instance, using hydroponics and aeroponics systems allows for higher yields per square meter compared to traditional farming methods. As per recent studies, these technologies can double agricultural productivity while utilizing 90% less water.
Such efficiency improvements have caught the attention of major agricultural corporations, pushing them to invest more in Research and Development (R&D) for vertical farming solutions. This trend not only enhances the profitability of vertical farms but also makes them a more sustainable option for future food production.
Sustainable Farming Practices Encouraged by Environmental Policies
The Vertical Farming Market Industry is supported by a growing emphasis on sustainable agricultural practices due to increasing environmental concerns. Numerous governments globally are implementing policies aimed at reducing carbon emissions and promoting sustainable food production. For instance, in regions like the European Union, the Green Deal outlines specific measures targeting carbon neutrality by 2050, encouraging urban farming strategies as part of the solution.
Vertical farming, being a low-emission form of agriculture that reduces transportation needs and carbon footprint, fits well into these sustainability policies. This transition is supported by organizations like the World Economic Forum, which have recognized vertical farming as a key component in achieving global sustainability goals. Consequently, this regulatory support is likely to drive investment and innovation within the vertical farming sector.
Growing Consumer Awareness and Demand for Organic Products
Consumer preferences are increasingly shifting towards organic and pesticide-free produce, significantly impacting the Vertical Farming Market Industry. In recent surveys conducted by industry associations, approximately 80% of consumers expressed a strong preference for organic products, perceiving them as healthier options. This trend is further fueled by growing awareness of food quality and safety, leading to a surge in demand for agriculture practices that prioritize sustainability and health.
Established players in the market, such as AeroFarms, have recognized this trend and are actively promoting their products as organic and non-GMO, thereby appealing to health-conscious consumers. As consumer awareness continues to grow, it is expected that vertical farming, with its capacity for high-quality and chemical-free produce, will further enhance market growth.
Vertical Farming Market Segment Insights:
Vertical Farming Market Component Insights
The Component segment of the Vertical Farming Market is witnessing substantial growth, driven by the increasing need for efficient food production systems in densely populated urban areas. As of 2024, this segment is a crucial part of the overall market, which is poised to reach a value of 7.48 USD Billion. Among the components, the irrigation component stands out with a valuation of 1.5 USD Billion in 2024 and is projected to surge to 12.0 USD Billion by 2035, reflecting its vital role in ensuring optimal water usage and plant health. Lighting systems hold a significant share as well, starting at 2.2 USD Billion in 2024 and expected to reach 18.0 USD Billion by 2035, underlining the importance of artificial light in enhancing crop yield and energy efficiency.
Additionally, sensors are critical in maintaining ideal growing conditions, contributing 1.0 USD Billion to the market in 2024 with a forecasted value of 6.0 USD Billion in 2035. Climate control technologies will also play a significant role, valued at 1.78 USD Billion in 2024 and anticipated to expand to 14.5 USD Billion by 2035, as they are essential for regulating temperature, humidity, and air circulation. Meanwhile, the building material component is expected to grow from 0.5 USD Billion in 2024 to 8.29 USD Billion in 2035, reflecting the rising demand for sustainable structures that support vertical farming operations.
The Glass Greenhouse and Plastic Greenhouse aspects also contribute to overall market dynamics, as they provide flexible growing environments and are integral in maximizing space and light penetration, although specific market values are less emphasized. Each of these components not only supports the functionality of vertical farms but also drives the trend towards more sustainable agricultural practices globally. The market dynamics within this segment reveal a clear trend towards innovation, as stakeholders strive to adopt technologies that enhance efficiency and reduce footprint, thereby aligning with governmental policies aimed at improving food security and promoting sustainable practices.
The various components of the Vertical Farming Market segmentation highlight the industry's potential for future growth, as urbanization continues to drive demand for innovative farming solutions that can effectively meet food supply challenges.

Source: Primary Research, Secondary Research, MRFR Database and Analyst Review
Vertical Farming Market Structure Insights
The Vertical Farming Market is witnessing significant growth, especially within the Structure segment, which includes Building-based and Container-based Vertical Farms. The market, valued at 7.48 billion USD in 2024, is rapidly evolving to meet the increasing global demand for sustainable food production methods. As urbanization intensifies and arable land decreases, Building-based Vertical Farms are becoming essential, leveraging existing infrastructures to maximize space and resource efficiency. Similarly, Container-based Vertical Farms offer flexibility and mobility, allowing operations to be set up in various locations, thus catering to local markets effectively.
The demand for fresh produce year-round and the need for reduced transportation costs are major drivers propelling the adoption of these farming methods. Additionally, advancements in technology and research are enhancing the efficiency of these farms, thus contributing to substantial market growth. These structures are pivotal not only for providing food security but also for promoting sustainable agriculture practices globally. The Vertical Farming Market segmentation reflects a clear trend towards innovative solutions that prioritize environmental sustainability while addressing the challenges of modern food production.
Vertical Farming Market Growth Mechanism Insights
The Vertical Farming Market is gaining significant traction, particularly through its diverse Growth Mechanism segment, which includes Hydroponics, Aeroponics, and Aquaponics. By 2024, the market is expected to reach a valuation of 7.48 Billion USD, reflecting the rising demand for sustainable food production methods across the globe. Hydroponics remains a leading method, utilizing nutrient-rich solutions to cultivate plants without soil, thus facilitating efficient resource usage. Aeroponics, in which plants are grown in a mist environment, is also prominent due to its capacity for maximizing growth and minimizing water usage, catering to the pressing concerns over water scarcity.
Meanwhile, Aquaponics integrates fish farming with plant cultivation, creating a synergistic ecosystem that utilizes waste produced by fish to nourish plants, thereby promoting sustainable practices. The Vertical Farming Market is driven by urbanization and the need for local food sources; however, challenges such as high initial setup costs and technological complexities persist. Overall, the increasing focus on food security and a shift towards environmentally friendly agriculture create abundant opportunities within the Growth Mechanism segment of the Vertical Farming Market, showcasing its pivotal role in the industry.
Vertical Farming Market Regional Insights
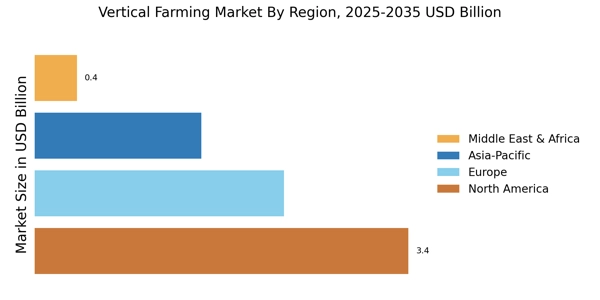
The Vertical Farming Market is poised for significant growth, with its regional segmentation highlighting varying levels of development. In 2024, North America holds a leading position, valued at 2.5 USD Billion, projected to grow to 20.0 USD Billion by 2035, showcasing its majority holding in technological advancement and investment in sustainable agriculture. Europe follows closely, with a valuation of 2.0 USD Billion in 2024 and expanding to 15.0 USD Billion by 2035, driven by stringent regulatory frameworks favoring innovative farming solutions.
The Asia Pacific region is also making strides, currently valued at 1.8 USD Billion with a projection to reach 12.0 USD Billion, reflecting the rising population and urbanization demands for food security. In contrast, South America and the Middle East and Africa represent smaller market segments, valued at 0.7 USD Billion and 0.48 USD Billion in 2024, respectively, but both regions show potential for growth as local governments prioritize food sustainability initiatives. The differences in valuation indicate that while North America and Europe dominate, all regions present unique opportunities and challenges that could reshape the Vertical Farming Market landscape.

Source: Primary Research, Secondary Research, MRFR Database and Analyst Review
Vertical Farming Market Key Players and Competitive Insights:
The competitive insights of the Vertical Farming Market reveal a rapidly evolving landscape characterized by technological advancements, sustainability trends, and a growing emphasis on local food production. Companies operating in this sector are increasingly focusing on innovative farming techniques that maximize yield while minimizing land and resource use. This paradigm shift towards vertical farming is driven by urbanization, climate change, and the need for food security in densely populated areas. Analyzing the competitive dynamics, one can observe the emergence of various players who bring unique capabilities and strategic approaches to harness the potential of vertical farming. These insights provide a nuanced understanding of market positioning, partnerships, and the adoption of cutting-edge technologies that facilitate growth and market penetration.
Vertical Harvest has established a notable presence in the Vertical Farming Market, focusing on urban agriculture to address food accessibility issues. The company centers its operations on sustainable farming practices, often leveraging integrated systems that enhance crop production while reducing resource consumption. Vertical Harvest's strengths lie in its innovative designs for vertical farms, which allow for year-round cultivation of various crops in urban settings. The company's ability to foster community engagement through local partnerships enhances its brand reputation and strengthens its operational model. With an emphasis on high-quality produce, Vertical Harvest aims to not only meet local demand but also serve as a model for urban agriculture, potentially inspiring similar initiatives in diverse urban environments around the globe.
BrightFarms operates within the Vertical Farming Market with a focus on developing sustainable agricultural systems to provide fresh produce to consumers. The company is well-known for its greenhouse facilities that enable year-round farming, allowing it to supply a variety of salads and leaf greens directly to local grocery stores and food retailers. BrightFarms enjoys a competitive edge through its commitment to sustainability, utilizing renewable energy sources and water-efficient practices in its operations. Its strategic partnerships enhance its market presence, as the company continuously seeks to expand its footprint through mergers and acquisitions that bolster its infrastructure and distribution capabilities. By prioritizing local sourcing and reducing transportation emissions, BrightFarms positions itself as a leader in the vertical farming sector, actively contributing to the transition toward more eco-friendly food systems in the Global market.
Key Companies in the Vertical Farming Market Include:
-
Vertical Harvest
-
BrightFarms
-
Urban Crop Solutions
-
Gotham Greens
-
Plenty
-
Sky Greens
-
Green Spirit Farms
-
AeroFarms
-
Bowery Farming
-
Mirai Foods
-
Iron Ox
-
CropOne Holdings
-
Kalera
-
Farm.One
-
Nongshim
Vertical Farming Industry Developments
The Vertical Farming Market is witnessing significant developments, driven by increasing urbanization and a shift towards sustainable agriculture. Vertical Harvest is expanding its operations, focusing on local community needs and enhancing its product offerings. BrightFarms has recently secured additional funding to expand its greenhouse production facilities across the United States, emphasizing the demand for locally sourced vegetables. Urban Crop Solutions continues to enhance its technology for maximizing crop yields and energy efficiency. In terms of mergers and acquisitions, Gotham Greens announced in June 2023 its agreement to be acquired by a larger sustainable food company to leverage shared resources for growth. Plenty also made headlines in July 2023 by raising substantial funding, enabling the company to increase production capacities. Notably, in September 2022, AeroFarms opened a state-of-the-art facility that set new benchmarks for vertical farming efficiency.Â
The market continues to gain traction, with recent investments strengthening the financial viability of companies like Kalera and Bowery Farming, further pushing the boundaries of vertical farming technology and its impact on global food supply chains. The vertical farming industry is predicted to grow at a robust pace, highlighting a shift towards innovative agricultural solutions.
Report Attribute/Metric
|
Details
|
Market Size 2023
|
6.2 (USD Billion)
|
Market Size 2024
|
7.48 (USD Billion)
|
Market Size 2035
|
58.79 (USD Billion)
|
Compound Annual Growth Rate (CAGR)
|
20.61% (2025 - 2035)
|
Report Coverage
|
Revenue Forecast, Competitive Landscape, Growth Factors, and Trends
|
Base Year
|
2024
|
Market Forecast Period
|
2025 - 2035
|
Historical Data
|
2019 - 2024
|
Market Forecast Units
|
USD Billion
|
Key Companies Profiled
|
Vertical Harvest, BrightFarms, Urban Crop Solutions, Gotham Greens, Plenty, Sky Greens, Green Spirit Farms, AeroFarms, Bowery Farming, Mirai Foods, Iron Ox, CropOne Holdings, Kalera, Farm.One, Nongshim
|
Segments Covered
|
Component, Structure, Growth Mechanism, Regional
|
Key Market Opportunities
|
Sustainable food production methods, Urban agriculture integration, Technological advancements in farming, Growing demand for organic produce, Government support for agri-tech initiatives
|
Key Market Dynamics
|
Urbanization and population growth, Technological advancements in agriculture, Sustainability and resource efficiency, Government support and funding, Rising consumer demand for local produce
|
Countries Covered
|
North America, Europe, APAC, South America, MEA
|
Vertical Farming Market Highlights:
Frequently Asked Questions (FAQ) :
The Vertical Farming Market is expected to be valued at 58.79 USD Billion in 2035.
The expected CAGR for the Vertical Farming Market from 2025 to 2035 is 20.61%.
North America is anticipated to dominate the market, projected at 20.0 USD Billion by 2035.
The market size for the irrigation component in the Vertical Farming Market is expected to reach 12.0 USD Billion by 2035.
Major players include Vertical Harvest, AeroFarms, Gotham Greens, and Urban Crop Solutions, among others.
The lighting component of the Vertical Farming Market was valued at 2.2 USD Billion in 2024.
The market size for the Vertical Farming Market in Europe was valued at 2.0 USD Billion in 2024.
The climate control component is expected to reach 14.5 USD Billion in the Vertical Farming Market by 2035.
By 2035, the Asia Pacific region is expected to reach a market size of 12.0 USD Billion in the Vertical Farming Market.
The projected market size for the building material component is anticipated to be 8.29 USD Billion by 2035.
TABLE OF CONTENTS
EXECUTIVE SUMMARY
1.1. Market Overview
1.2. Key Findings
1.3. Market Segmentation
1.4. Competitive Landscape
1.5. Challenges and Opportunities
1.6. Future Outlook
MARKET INTRODUCTION
2.1. Definition
2.2. Scope of the study
2.2.1. Research Objective
2.2.2. Assumption
2.2.3. Limitations
RESEARCH METHODOLOGY
3.1. Overview
3.2. Data Mining
3.3. Secondary Research
3.4. Primary Research
3.4.1. Primary Interviews and Information Gathering Process
3.4.2. Breakdown of Primary Respondents
3.5. Forecasting Model
3.6. Market Size Estimation
3.6.1. Bottom-Up Approach
3.6.2. Top-Down Approach
3.7. Data Triangulation
3.8. Validation
MARKET DYNAMICS
4.1. Overview
4.2. Drivers
4.3. Restraints
4.4. Opportunities
MARKET FACTOR ANALYSIS
5.1. Value chain Analysis
5.2. Porter's Five Forces Analysis
5.2.1. Bargaining Power of Suppliers
5.2.2. Bargaining Power of Buyers
5.2.3. Threat of New Entrants
5.2.4. Threat of Substitutes
5.2.5. Intensity of Rivalry
5.3. COVID-19 Impact Analysis
5.3.1. Market Impact Analysis
5.3.2. Regional Impact
5.3.3. Opportunity and Threat Analysis
VERTICAL FARMING MARKET, BY COMPONENT (USD BILLION)
6.1. Irrigation Component
6.2. Lighting
6.3. Sensor
6.4. Climate Control
6.5. Building Material
6.6. Glass Greenhouse
6.7. Plastic Greenhouse
VERTICAL FARMING MARKET, BY STRUCTURE (USD BILLION)
7.1. Building-based Vertical Farms
7.2. Container-based Vertical Farms
VERTICAL FARMING MARKET, BY GROWTH MECHANISM (USD BILLION)
8.1. Hydroponics
8.2. Aeroponics
8.3. Aquaponics
VERTICAL FARMING MARKET, BY REGIONAL (USD BILLION)
9.1. North America
9.1.1. US
9.1.2. Canada
9.2. Europe
9.2.1. Germany
9.2.2. UK
9.2.3. France
9.2.4. Russia
9.2.5. Italy
9.2.6. Spain
9.2.7. Rest of Europe
9.3. APAC
9.3.1. China
9.3.2. India
9.3.3. Japan
9.3.4. South Korea
9.3.5. Malaysia
9.3.6. Thailand
9.3.7. Indonesia
9.3.8. Rest of APAC
9.4. South America
9.4.1. Brazil
9.4.2. Mexico
9.4.3. Argentina
9.4.4. Rest of South America
9.5. MEA
9.5.1. GCC Countries
9.5.2. South Africa
9.5.3. Rest of MEA
COMPETITIVE LANDSCAPE
10.1. Overview
10.2. Competitive Analysis
10.3. Market share Analysis
10.4. Major Growth Strategy in the Vertical Farming Market
10.5. Competitive Benchmarking
10.6. Leading Players in Terms of Number of Developments in the Vertical Farming Market
10.7. Key developments and growth strategies
10.7.1. New Product Launch/Service Deployment
10.7.2. Merger & Acquisitions
10.7.3. Joint Ventures
10.8. Major Players Financial Matrix
10.8.1. Sales and Operating Income
10.8.2. Major Players R&D Expenditure. 2023
COMPANY PROFILES
11.1. Vertical Harvest
11.1.1. Financial Overview
11.1.2. Products Offered
11.1.3. Key Developments
11.1.4. SWOT Analysis
11.1.5. Key Strategies
11.2. BrightFarms
11.2.1. Financial Overview
11.2.2. Products Offered
11.2.3. Key Developments
11.2.4. SWOT Analysis
11.2.5. Key Strategies
11.3. Urban Crop Solutions
11.3.1. Financial Overview
11.3.2. Products Offered
11.3.3. Key Developments
11.3.4. SWOT Analysis
11.3.5. Key Strategies
11.4. Gotham Greens
11.4.1. Financial Overview
11.4.2. Products Offered
11.4.3. Key Developments
11.4.4. SWOT Analysis
11.4.5. Key Strategies
11.5. Plenty
11.5.1. Financial Overview
11.5.2. Products Offered
11.5.3. Key Developments
11.5.4. SWOT Analysis
11.5.5. Key Strategies
11.6. Sky Greens
11.6.1. Financial Overview
11.6.2. Products Offered
11.6.3. Key Developments
11.6.4. SWOT Analysis
11.6.5. Key Strategies
11.7. Green Spirit Farms
11.7.1. Financial Overview
11.7.2. Products Offered
11.7.3. Key Developments
11.7.4. SWOT Analysis
11.7.5. Key Strategies
11.8. AeroFarms
11.8.1. Financial Overview
11.8.2. Products Offered
11.8.3. Key Developments
11.8.4. SWOT Analysis
11.8.5. Key Strategies
11.9. Bowery Farming
11.9.1. Financial Overview
11.9.2. Products Offered
11.9.3. Key Developments
11.9.4. SWOT Analysis
11.9.5. Key Strategies
11.10. Mirai Foods
11.10.1. Financial Overview
11.10.2. Products Offered
11.10.3. Key Developments
11.10.4. SWOT Analysis
11.10.5. Key Strategies
11.11. Iron Ox
11.11.1. Financial Overview
11.11.2. Products Offered
11.11.3. Key Developments
11.11.4. SWOT Analysis
11.11.5. Key Strategies
11.12. CropOne Holdings
11.12.1. Financial Overview
11.12.2. Products Offered
11.12.3. Key Developments
11.12.4. SWOT Analysis
11.12.5. Key Strategies
11.13. Kalera
11.13.1. Financial Overview
11.13.2. Products Offered
11.13.3. Key Developments
11.13.4. SWOT Analysis
11.13.5. Key Strategies
11.14. Farm.One
11.14.1. Financial Overview
11.14.2. Products Offered
11.14.3. Key Developments
11.14.4. SWOT Analysis
11.14.5. Key Strategies
11.15. Nongshim
11.15.1. Financial Overview
11.15.2. Products Offered
11.15.3. Key Developments
11.15.4. SWOT Analysis
11.15.5. Key Strategies
APPENDIX
12.1. References
12.2. Related Reports
LIST OF TABLES
TABLE 1. LIST OF ASSUMPTIONS
TABLE 2. NORTH AMERICA: MARKET SIZE ESTIMATES & FORECAST, BY COMPONENT, 2019-2035 (USD BILLIONS)
TABLE 3. NORTH AMERICA: MARKET SIZE ESTIMATES & FORECAST, BY STRUCTURE, 2019-2035 (USD BILLIONS)
TABLE 4. NORTH AMERICA: MARKET SIZE ESTIMATES & FORECAST, BY GROWTH MECHANISM, 2019-2035 (USD BILLIONS)
TABLE 5. NORTH AMERICA: MARKET SIZE ESTIMATES & FORECAST, BY REGIONAL, 2019-2035 (USD BILLIONS)
TABLE 6. US: MARKET SIZE ESTIMATES & FORECAST, BY COMPONENT, 2019-2035 (USD BILLIONS)
TABLE 7. US: MARKET SIZE ESTIMATES & FORECAST, BY STRUCTURE, 2019-2035 (USD BILLIONS)
TABLE 8. US: MARKET SIZE ESTIMATES & FORECAST, BY GROWTH MECHANISM, 2019-2035 (USD BILLIONS)
TABLE 9. US: MARKET SIZE ESTIMATES & FORECAST, BY REGIONAL, 2019-2035 (USD BILLIONS)
TABLE 10. CANADA: MARKET SIZE ESTIMATES & FORECAST, BY COMPONENT, 2019-2035 (USD BILLIONS)
TABLE 11. CANADA: MARKET SIZE ESTIMATES & FORECAST, BY STRUCTURE, 2019-2035 (USD BILLIONS)
TABLE 12. CANADA: MARKET SIZE ESTIMATES & FORECAST, BY GROWTH MECHANISM, 2019-2035 (USD BILLIONS)
TABLE 13. CANADA: MARKET SIZE ESTIMATES & FORECAST, BY REGIONAL, 2019-2035 (USD BILLIONS)
TABLE 14. EUROPE: MARKET SIZE ESTIMATES & FORECAST, BY COMPONENT, 2019-2035 (USD BILLIONS)
TABLE 15. EUROPE: MARKET SIZE ESTIMATES & FORECAST, BY STRUCTURE, 2019-2035 (USD BILLIONS)
TABLE 16. EUROPE: MARKET SIZE ESTIMATES & FORECAST, BY GROWTH MECHANISM, 2019-2035 (USD BILLIONS)
TABLE 17. EUROPE: MARKET SIZE ESTIMATES & FORECAST, BY REGIONAL, 2019-2035 (USD BILLIONS)
TABLE 18. GERMANY: MARKET SIZE ESTIMATES & FORECAST, BY COMPONENT, 2019-2035 (USD BILLIONS)
TABLE 19. GERMANY: MARKET SIZE ESTIMATES & FORECAST, BY STRUCTURE, 2019-2035 (USD BILLIONS)
TABLE 20. GERMANY: MARKET SIZE ESTIMATES & FORECAST, BY GROWTH MECHANISM, 2019-2035 (USD BILLIONS)
TABLE 21. GERMANY: MARKET SIZE ESTIMATES & FORECAST, BY REGIONAL, 2019-2035 (USD BILLIONS)
TABLE 22. UK: MARKET SIZE ESTIMATES & FORECAST, BY COMPONENT, 2019-2035 (USD BILLIONS)
TABLE 23. UK: MARKET SIZE ESTIMATES & FORECAST, BY STRUCTURE, 2019-2035 (USD BILLIONS)
TABLE 24. UK: MARKET SIZE ESTIMATES & FORECAST, BY GROWTH MECHANISM, 2019-2035 (USD BILLIONS)
TABLE 25. UK: MARKET SIZE ESTIMATES & FORECAST, BY REGIONAL, 2019-2035 (USD BILLIONS)
TABLE 26. FRANCE: MARKET SIZE ESTIMATES & FORECAST, BY COMPONENT, 2019-2035 (USD BILLIONS)
TABLE 27. FRANCE: MARKET SIZE ESTIMATES & FORECAST, BY STRUCTURE, 2019-2035 (USD BILLIONS)
TABLE 28. FRANCE: MARKET SIZE ESTIMATES & FORECAST, BY GROWTH MECHANISM, 2019-2035 (USD BILLIONS)
TABLE 29. FRANCE: MARKET SIZE ESTIMATES & FORECAST, BY REGIONAL, 2019-2035 (USD BILLIONS)
TABLE 30. RUSSIA: MARKET SIZE ESTIMATES & FORECAST, BY COMPONENT, 2019-2035 (USD BILLIONS)
TABLE 31. RUSSIA: MARKET SIZE ESTIMATES & FORECAST, BY STRUCTURE, 2019-2035 (USD BILLIONS)
TABLE 32. RUSSIA: MARKET SIZE ESTIMATES & FORECAST, BY GROWTH MECHANISM, 2019-2035 (USD BILLIONS)
TABLE 33. RUSSIA: MARKET SIZE ESTIMATES & FORECAST, BY REGIONAL, 2019-2035 (USD BILLIONS)
TABLE 34. ITALY: MARKET SIZE ESTIMATES & FORECAST, BY COMPONENT, 2019-2035 (USD BILLIONS)
TABLE 35. ITALY: MARKET SIZE ESTIMATES & FORECAST, BY STRUCTURE, 2019-2035 (USD BILLIONS)
TABLE 36. ITALY: MARKET SIZE ESTIMATES & FORECAST, BY GROWTH MECHANISM, 2019-2035 (USD BILLIONS)
TABLE 37. ITALY: MARKET SIZE ESTIMATES & FORECAST, BY REGIONAL, 2019-2035 (USD BILLIONS)
TABLE 38. SPAIN: MARKET SIZE ESTIMATES & FORECAST, BY COMPONENT, 2019-2035 (USD BILLIONS)
TABLE 39. SPAIN: MARKET SIZE ESTIMATES & FORECAST, BY STRUCTURE, 2019-2035 (USD BILLIONS)
TABLE 40. SPAIN: MARKET SIZE ESTIMATES & FORECAST, BY GROWTH MECHANISM, 2019-2035 (USD BILLIONS)
TABLE 41. SPAIN: MARKET SIZE ESTIMATES & FORECAST, BY REGIONAL, 2019-2035 (USD BILLIONS)
TABLE 42. REST OF EUROPE: MARKET SIZE ESTIMATES & FORECAST, BY COMPONENT, 2019-2035 (USD BILLIONS)
TABLE 43. REST OF EUROPE: MARKET SIZE ESTIMATES & FORECAST, BY STRUCTURE, 2019-2035 (USD BILLIONS)
TABLE 44. REST OF EUROPE: MARKET SIZE ESTIMATES & FORECAST, BY GROWTH MECHANISM, 2019-2035 (USD BILLIONS)
TABLE 45. REST OF EUROPE: MARKET SIZE ESTIMATES & FORECAST, BY REGIONAL, 2019-2035 (USD BILLIONS)
TABLE 46. APAC: MARKET SIZE ESTIMATES & FORECAST, BY COMPONENT, 2019-2035 (USD BILLIONS)
TABLE 47. APAC: MARKET SIZE ESTIMATES & FORECAST, BY STRUCTURE, 2019-2035 (USD BILLIONS)
TABLE 48. APAC: MARKET SIZE ESTIMATES & FORECAST, BY GROWTH MECHANISM, 2019-2035 (USD BILLIONS)
TABLE 49. APAC: MARKET SIZE ESTIMATES & FORECAST, BY REGIONAL, 2019-2035 (USD BILLIONS)
TABLE 50. CHINA: MARKET SIZE ESTIMATES & FORECAST, BY COMPONENT, 2019-2035 (USD BILLIONS)
TABLE 51. CHINA: MARKET SIZE ESTIMATES & FORECAST, BY STRUCTURE, 2019-2035 (USD BILLIONS)
TABLE 52. CHINA: MARKET SIZE ESTIMATES & FORECAST, BY GROWTH MECHANISM, 2019-2035 (USD BILLIONS)
TABLE 53. CHINA: MARKET SIZE ESTIMATES & FORECAST, BY REGIONAL, 2019-2035 (USD BILLIONS)
TABLE 54. INDIA: MARKET SIZE ESTIMATES & FORECAST, BY COMPONENT, 2019-2035 (USD BILLIONS)
TABLE 55. INDIA: MARKET SIZE ESTIMATES & FORECAST, BY STRUCTURE, 2019-2035 (USD BILLIONS)
TABLE 56. INDIA: MARKET SIZE ESTIMATES & FORECAST, BY GROWTH MECHANISM, 2019-2035 (USD BILLIONS)
TABLE 57. INDIA: MARKET SIZE ESTIMATES & FORECAST, BY REGIONAL, 2019-2035 (USD BILLIONS)
TABLE 58. JAPAN: MARKET SIZE ESTIMATES & FORECAST, BY COMPONENT, 2019-2035 (USD BILLIONS)
TABLE 59. JAPAN: MARKET SIZE ESTIMATES & FORECAST, BY STRUCTURE, 2019-2035 (USD BILLIONS)
TABLE 60. JAPAN: MARKET SIZE ESTIMATES & FORECAST, BY GROWTH MECHANISM, 2019-2035 (USD BILLIONS)
TABLE 61. JAPAN: MARKET SIZE ESTIMATES & FORECAST, BY REGIONAL, 2019-2035 (USD BILLIONS)
TABLE 62. SOUTH KOREA: MARKET SIZE ESTIMATES & FORECAST, BY COMPONENT, 2019-2035 (USD BILLIONS)
TABLE 63. SOUTH KOREA: MARKET SIZE ESTIMATES & FORECAST, BY STRUCTURE, 2019-2035 (USD BILLIONS)
TABLE 64. SOUTH KOREA: MARKET SIZE ESTIMATES & FORECAST, BY GROWTH MECHANISM, 2019-2035 (USD BILLIONS)
TABLE 65. SOUTH KOREA: MARKET SIZE ESTIMATES & FORECAST, BY REGIONAL, 2019-2035 (USD BILLIONS)
TABLE 66. MALAYSIA: MARKET SIZE ESTIMATES & FORECAST, BY COMPONENT, 2019-2035 (USD BILLIONS)
TABLE 67. MALAYSIA: MARKET SIZE ESTIMATES & FORECAST, BY STRUCTURE, 2019-2035 (USD BILLIONS)
TABLE 68. MALAYSIA: MARKET SIZE ESTIMATES & FORECAST, BY GROWTH MECHANISM, 2019-2035 (USD BILLIONS)
TABLE 69. MALAYSIA: MARKET SIZE ESTIMATES & FORECAST, BY REGIONAL, 2019-2035 (USD BILLIONS)
TABLE 70. THAILAND: MARKET SIZE ESTIMATES & FORECAST, BY COMPONENT, 2019-2035 (USD BILLIONS)
TABLE 71. THAILAND: MARKET SIZE ESTIMATES & FORECAST, BY STRUCTURE, 2019-2035 (USD BILLIONS)
TABLE 72. THAILAND: MARKET SIZE ESTIMATES & FORECAST, BY GROWTH MECHANISM, 2019-2035 (USD BILLIONS)
TABLE 73. THAILAND: MARKET SIZE ESTIMATES & FORECAST, BY REGIONAL, 2019-2035 (USD BILLIONS)
TABLE 74. INDONESIA: MARKET SIZE ESTIMATES & FORECAST, BY COMPONENT, 2019-2035 (USD BILLIONS)
TABLE 75. INDONESIA: MARKET SIZE ESTIMATES & FORECAST, BY STRUCTURE, 2019-2035 (USD BILLIONS)
TABLE 76. INDONESIA: MARKET SIZE ESTIMATES & FORECAST, BY GROWTH MECHANISM, 2019-2035 (USD BILLIONS)
TABLE 77. INDONESIA: MARKET SIZE ESTIMATES & FORECAST, BY REGIONAL, 2019-2035 (USD BILLIONS)
TABLE 78. REST OF APAC: MARKET SIZE ESTIMATES & FORECAST, BY COMPONENT, 2019-2035 (USD BILLIONS)
TABLE 79. REST OF APAC: MARKET SIZE ESTIMATES & FORECAST, BY STRUCTURE, 2019-2035 (USD BILLIONS)
TABLE 80. REST OF APAC: MARKET SIZE ESTIMATES & FORECAST, BY GROWTH MECHANISM, 2019-2035 (USD BILLIONS)
TABLE 81. REST OF APAC: MARKET SIZE ESTIMATES & FORECAST, BY REGIONAL, 2019-2035 (USD BILLIONS)
TABLE 82. SOUTH AMERICA: MARKET SIZE ESTIMATES & FORECAST, BY COMPONENT, 2019-2035 (USD BILLIONS)
TABLE 83. SOUTH AMERICA: MARKET SIZE ESTIMATES & FORECAST, BY STRUCTURE, 2019-2035 (USD BILLIONS)
TABLE 84. SOUTH AMERICA: MARKET SIZE ESTIMATES & FORECAST, BY GROWTH MECHANISM, 2019-2035 (USD BILLIONS)
TABLE 85. SOUTH AMERICA: MARKET SIZE ESTIMATES & FORECAST, BY REGIONAL, 2019-2035 (USD BILLIONS)
TABLE 86. BRAZIL: MARKET SIZE ESTIMATES & FORECAST, BY COMPONENT, 2019-2035 (USD BILLIONS)
TABLE 87. BRAZIL: MARKET SIZE ESTIMATES & FORECAST, BY STRUCTURE, 2019-2035 (USD BILLIONS)
TABLE 88. BRAZIL: MARKET SIZE ESTIMATES & FORECAST, BY GROWTH MECHANISM, 2019-2035 (USD BILLIONS)
TABLE 89. BRAZIL: MARKET SIZE ESTIMATES & FORECAST, BY REGIONAL, 2019-2035 (USD BILLIONS)
TABLE 90. MEXICO: MARKET SIZE ESTIMATES & FORECAST, BY COMPONENT, 2019-2035 (USD BILLIONS)
TABLE 91. MEXICO: MARKET SIZE ESTIMATES & FORECAST, BY STRUCTURE, 2019-2035 (USD BILLIONS)
TABLE 92. MEXICO: MARKET SIZE ESTIMATES & FORECAST, BY GROWTH MECHANISM, 2019-2035 (USD BILLIONS)
TABLE 93. MEXICO: MARKET SIZE ESTIMATES & FORECAST, BY REGIONAL, 2019-2035 (USD BILLIONS)
TABLE 94. ARGENTINA: MARKET SIZE ESTIMATES & FORECAST, BY COMPONENT, 2019-2035 (USD BILLIONS)
TABLE 95. ARGENTINA: MARKET SIZE ESTIMATES & FORECAST, BY STRUCTURE, 2019-2035 (USD BILLIONS)
TABLE 96. ARGENTINA: MARKET SIZE ESTIMATES & FORECAST, BY GROWTH MECHANISM, 2019-2035 (USD BILLIONS)
TABLE 97. ARGENTINA: MARKET SIZE ESTIMATES & FORECAST, BY REGIONAL, 2019-2035 (USD BILLIONS)
TABLE 98. REST OF SOUTH AMERICA: MARKET SIZE ESTIMATES & FORECAST, BY COMPONENT, 2019-2035 (USD BILLIONS)
TABLE 99. REST OF SOUTH AMERICA: MARKET SIZE ESTIMATES & FORECAST, BY STRUCTURE, 2019-2035 (USD BILLIONS)
TABLE 100. REST OF SOUTH AMERICA: MARKET SIZE ESTIMATES & FORECAST, BY GROWTH MECHANISM, 2019-2035 (USD BILLIONS)
TABLE 101. REST OF SOUTH AMERICA: MARKET SIZE ESTIMATES & FORECAST, BY REGIONAL, 2019-2035 (USD BILLIONS)
TABLE 102. MEA: MARKET SIZE ESTIMATES & FORECAST, BY COMPONENT, 2019-2035 (USD BILLIONS)
TABLE 103. MEA: MARKET SIZE ESTIMATES & FORECAST, BY STRUCTURE, 2019-2035 (USD BILLIONS)
TABLE 104. MEA: MARKET SIZE ESTIMATES & FORECAST, BY GROWTH MECHANISM, 2019-2035 (USD BILLIONS)
TABLE 105. MEA: MARKET SIZE ESTIMATES & FORECAST, BY REGIONAL, 2019-2035 (USD BILLIONS)
TABLE 106. GCC COUNTRIES: MARKET SIZE ESTIMATES & FORECAST, BY COMPONENT, 2019-2035 (USD BILLIONS)
TABLE 107. GCC COUNTRIES: MARKET SIZE ESTIMATES & FORECAST, BY STRUCTURE, 2019-2035 (USD BILLIONS)
TABLE 108. GCC COUNTRIES: MARKET SIZE ESTIMATES & FORECAST, BY GROWTH MECHANISM, 2019-2035 (USD BILLIONS)
TABLE 109. GCC COUNTRIES: MARKET SIZE ESTIMATES & FORECAST, BY REGIONAL, 2019-2035 (USD BILLIONS)
TABLE 110. SOUTH AFRICA: MARKET SIZE ESTIMATES & FORECAST, BY COMPONENT, 2019-2035 (USD BILLIONS)
TABLE 111. SOUTH AFRICA: MARKET SIZE ESTIMATES & FORECAST, BY STRUCTURE, 2019-2035 (USD BILLIONS)
TABLE 112. SOUTH AFRICA: MARKET SIZE ESTIMATES & FORECAST, BY GROWTH MECHANISM, 2019-2035 (USD BILLIONS)
TABLE 113. SOUTH AFRICA: MARKET SIZE ESTIMATES & FORECAST, BY REGIONAL, 2019-2035 (USD BILLIONS)
TABLE 114. REST OF MEA: MARKET SIZE ESTIMATES & FORECAST, BY COMPONENT, 2019-2035 (USD BILLIONS)
TABLE 115. REST OF MEA: MARKET SIZE ESTIMATES & FORECAST, BY STRUCTURE, 2019-2035 (USD BILLIONS)
TABLE 116. REST OF MEA: MARKET SIZE ESTIMATES & FORECAST, BY GROWTH MECHANISM, 2019-2035 (USD BILLIONS)
TABLE 117. REST OF MEA: MARKET SIZE ESTIMATES & FORECAST, BY REGIONAL, 2019-2035 (USD BILLIONS)
TABLE 118. PRODUCT LAUNCH/PRODUCT DEVELOPMENT/APPROVAL
TABLE 119. ACQUISITION/PARTNERSHIP
LIST OF FIGURES
FIGURE 1. MARKET SYNOPSIS
FIGURE 2. NORTH AMERICA: MARKET ANALYSIS
FIGURE 3. US: MARKET ANALYSIS BY COMPONENT
FIGURE 4. US: MARKET ANALYSIS BY STRUCTURE
FIGURE 5. US: MARKET ANALYSIS BY GROWTH MECHANISM
FIGURE 6. US: MARKET ANALYSIS BY REGIONAL
FIGURE 7. CANADA: MARKET ANALYSIS BY COMPONENT
FIGURE 8. CANADA: MARKET ANALYSIS BY STRUCTURE
FIGURE 9. CANADA: MARKET ANALYSIS BY GROWTH MECHANISM
FIGURE 10. CANADA: MARKET ANALYSIS BY REGIONAL
FIGURE 11. EUROPE: MARKET ANALYSIS
FIGURE 12. GERMANY: MARKET ANALYSIS BY COMPONENT
FIGURE 13. GERMANY: MARKET ANALYSIS BY STRUCTURE
FIGURE 14. GERMANY: MARKET ANALYSIS BY GROWTH MECHANISM
FIGURE 15. GERMANY: MARKET ANALYSIS BY REGIONAL
FIGURE 16. UK: MARKET ANALYSIS BY COMPONENT
FIGURE 17. UK: MARKET ANALYSIS BY STRUCTURE
FIGURE 18. UK: MARKET ANALYSIS BY GROWTH MECHANISM
FIGURE 19. UK: MARKET ANALYSIS BY REGIONAL
FIGURE 20. FRANCE: MARKET ANALYSIS BY COMPONENT
FIGURE 21. FRANCE: MARKET ANALYSIS BY STRUCTURE
FIGURE 22. FRANCE: MARKET ANALYSIS BY GROWTH MECHANISM
FIGURE 23. FRANCE: MARKET ANALYSIS BY REGIONAL
FIGURE 24. RUSSIA: MARKET ANALYSIS BY COMPONENT
FIGURE 25. RUSSIA: MARKET ANALYSIS BY STRUCTURE
FIGURE 26. RUSSIA: MARKET ANALYSIS BY GROWTH MECHANISM
FIGURE 27. RUSSIA: MARKET ANALYSIS BY REGIONAL
FIGURE 28. ITALY: MARKET ANALYSIS BY COMPONENT
FIGURE 29. ITALY: MARKET ANALYSIS BY STRUCTURE
FIGURE 30. ITALY: MARKET ANALYSIS BY GROWTH MECHANISM
FIGURE 31. ITALY: MARKET ANALYSIS BY REGIONAL
FIGURE 32. SPAIN: MARKET ANALYSIS BY COMPONENT
FIGURE 33. SPAIN: MARKET ANALYSIS BY STRUCTURE
FIGURE 34. SPAIN: MARKET ANALYSIS BY GROWTH MECHANISM
FIGURE 35. SPAIN: MARKET ANALYSIS BY REGIONAL
FIGURE 36. REST OF EUROPE: MARKET ANALYSIS BY COMPONENT
FIGURE 37. REST OF EUROPE: MARKET ANALYSIS BY STRUCTURE
FIGURE 38. REST OF EUROPE: MARKET ANALYSIS BY GROWTH MECHANISM
FIGURE 39. REST OF EUROPE: MARKET ANALYSIS BY REGIONAL
FIGURE 40. APAC: MARKET ANALYSIS
FIGURE 41. CHINA: MARKET ANALYSIS BY COMPONENT
FIGURE 42. CHINA: MARKET ANALYSIS BY STRUCTURE
FIGURE 43. CHINA: MARKET ANALYSIS BY GROWTH MECHANISM
FIGURE 44. CHINA: MARKET ANALYSIS BY REGIONAL
FIGURE 45. INDIA: MARKET ANALYSIS BY COMPONENT
FIGURE 46. INDIA: MARKET ANALYSIS BY STRUCTURE
FIGURE 47. INDIA: MARKET ANALYSIS BY GROWTH MECHANISM
FIGURE 48. INDIA: MARKET ANALYSIS BY REGIONAL
FIGURE 49. JAPAN: MARKET ANALYSIS BY COMPONENT
FIGURE 50. JAPAN: MARKET ANALYSIS BY STRUCTURE
FIGURE 51. JAPAN: MARKET ANALYSIS BY GROWTH MECHANISM
FIGURE 52. JAPAN: MARKET ANALYSIS BY REGIONAL
FIGURE 53. SOUTH KOREA: MARKET ANALYSIS BY COMPONENT
FIGURE 54. SOUTH KOREA: MARKET ANALYSIS BY STRUCTURE
FIGURE 55. SOUTH KOREA: MARKET ANALYSIS BY GROWTH MECHANISM
FIGURE 56. SOUTH KOREA: MARKET ANALYSIS BY REGIONAL
FIGURE 57. MALAYSIA: MARKET ANALYSIS BY COMPONENT
FIGURE 58. MALAYSIA: MARKET ANALYSIS BY STRUCTURE
FIGURE 59. MALAYSIA: MARKET ANALYSIS BY GROWTH MECHANISM
FIGURE 60. MALAYSIA: MARKET ANALYSIS BY REGIONAL
FIGURE 61. THAILAND: MARKET ANALYSIS BY COMPONENT
FIGURE 62. THAILAND: MARKET ANALYSIS BY STRUCTURE
FIGURE 63. THAILAND: MARKET ANALYSIS BY GROWTH MECHANISM
FIGURE 64. THAILAND: MARKET ANALYSIS BY REGIONAL
FIGURE 65. INDONESIA: MARKET ANALYSIS BY COMPONENT
FIGURE 66. INDONESIA: MARKET ANALYSIS BY STRUCTURE
FIGURE 67. INDONESIA: MARKET ANALYSIS BY GROWTH MECHANISM
FIGURE 68. INDONESIA: MARKET ANALYSIS BY REGIONAL
FIGURE 69. REST OF APAC: MARKET ANALYSIS BY COMPONENT
FIGURE 70. REST OF APAC: MARKET ANALYSIS BY STRUCTURE
FIGURE 71. REST OF APAC: MARKET ANALYSIS BY GROWTH MECHANISM
FIGURE 72. REST OF APAC: MARKET ANALYSIS BY REGIONAL
FIGURE 73. SOUTH AMERICA: MARKET ANALYSIS
FIGURE 74. BRAZIL: MARKET ANALYSIS BY COMPONENT
FIGURE 75. BRAZIL: MARKET ANALYSIS BY STRUCTURE
FIGURE 76. BRAZIL: MARKET ANALYSIS BY GROWTH MECHANISM
FIGURE 77. BRAZIL: MARKET ANALYSIS BY REGIONAL
FIGURE 78. MEXICO: MARKET ANALYSIS BY COMPONENT
FIGURE 79. MEXICO: MARKET ANALYSIS BY STRUCTURE
FIGURE 80. MEXICO: MARKET ANALYSIS BY GROWTH MECHANISM
FIGURE 81. MEXICO: MARKET ANALYSIS BY REGIONAL
FIGURE 82. ARGENTINA: MARKET ANALYSIS BY COMPONENT
FIGURE 83. ARGENTINA: MARKET ANALYSIS BY STRUCTURE
FIGURE 84. ARGENTINA: MARKET ANALYSIS BY GROWTH MECHANISM
FIGURE 85. ARGENTINA: MARKET ANALYSIS BY REGIONAL
FIGURE 86. REST OF SOUTH AMERICA: MARKET ANALYSIS BY COMPONENT
FIGURE 87. REST OF SOUTH AMERICA: MARKET ANALYSIS BY STRUCTURE
FIGURE 88. REST OF SOUTH AMERICA: MARKET ANALYSIS BY GROWTH MECHANISM
FIGURE 89. REST OF SOUTH AMERICA: MARKET ANALYSIS BY REGIONAL
FIGURE 90. MEA: MARKET ANALYSIS
FIGURE 91. GCC COUNTRIES: MARKET ANALYSIS BY COMPONENT
FIGURE 92. GCC COUNTRIES: MARKET ANALYSIS BY STRUCTURE
FIGURE 93. GCC COUNTRIES: MARKET ANALYSIS BY GROWTH MECHANISM
FIGURE 94. GCC COUNTRIES: MARKET ANALYSIS BY REGIONAL
FIGURE 95. SOUTH AFRICA: MARKET ANALYSIS BY COMPONENT
FIGURE 96. SOUTH AFRICA: MARKET ANALYSIS BY STRUCTURE
FIGURE 97. SOUTH AFRICA: MARKET ANALYSIS BY GROWTH MECHANISM
FIGURE 98. SOUTH AFRICA: MARKET ANALYSIS BY REGIONAL
FIGURE 99. REST OF MEA: MARKET ANALYSIS BY COMPONENT
FIGURE 100. REST OF MEA: MARKET ANALYSIS BY STRUCTURE
FIGURE 101. REST OF MEA: MARKET ANALYSIS BY GROWTH MECHANISM
FIGURE 102. REST OF MEA: MARKET ANALYSIS BY REGIONAL
FIGURE 103. KEY BUYING CRITERIA OF VERTICAL FARMING MARKET
FIGURE 104. RESEARCH PROCESS OF MRFR
FIGURE 105. DRO ANALYSIS OF VERTICAL FARMING MARKET
FIGURE 106. DRIVERS IMPACT ANALYSIS: MARKET
FIGURE 107. RESTRAINTS IMPACT ANALYSIS: VERTICAL FARMING MARKET
FIGURE 108. SUPPLY / VALUE CHAIN: VERTICAL FARMING MARKET
FIGURE 109. VERTICAL FARMING MARKET, BY COMPONENT, 2025 (% SHARE)
FIGURE 110. VERTICAL FARMING MARKET, BY COMPONENT, 2019 TO 2035 (USD Billions)
FIGURE 111. VERTICAL FARMING MARKET, BY STRUCTURE, 2025 (% SHARE)
FIGURE 112. VERTICAL FARMING MARKET, BY STRUCTURE, 2019 TO 2035 (USD Billions)
FIGURE 113. VERTICAL FARMING MARKET, BY GROWTH MECHANISM, 2025 (% SHARE)
FIGURE 114. VERTICAL FARMING MARKET, BY GROWTH MECHANISM, 2019 TO 2035 (USD Billions)
FIGURE 115. VERTICAL FARMING MARKET, BY REGIONAL, 2025 (% SHARE)
FIGURE 116. VERTICAL FARMING MARKET, BY REGIONAL, 2019 TO 2035 (USD Billions)
FIGURE 117. BENCHMARKING OF MAJOR COMPETITORS