Ice Cream Market (2026 - 2035)

Ice Cream Market Size, Share, Industry Trend & Analysis Research Report By Type (Standard Ice Cream, Novelties, Soft Serve, Specialty/Artisanal Ice Cream), By Category (Dairy, Non-Dairy), By Packaging Type (Pints, Tubs/Cups, More), By Distribution Channel (On-Trade, Off-Trade), By Geography (North America, Europe, Asia-Pacific, South America, Middle East & Africa) - Forecast to 2035

Forecast Period
2026-2035
CAGR
4.35%
2025 Market Size
USD 128.65 Billion
2035 Market Size
USD 195.04 Billion
Food, Beverages & Nutrition ● Updated August 24, 2026 Report ID: MRFR/FnB/1998-CR | Pages: 200 | Author: Snehal Singh

Ice Cream Market Summary

The Ice Cream Market was valued at USD 128.65 Billion in 2025 and is projected to open the forecast window at USD 132.95 Billion in 2026 before reaching USD 195.04 Billion by 2035, expanding at a 4.35% CAGR. Two catalysts anchor that trajectory. First, cold-chain capital deployment: India's Ministry of Food Processing Industries has committed roughly USD 1.3 Billion under the PMKSY scheme to integrated cold-chain and value-addition infrastructure, directly enlarging addressable retail freezer capacity [1]. Second, reformulation economics — sugar-reduction and protein-fortification mandates across the EU and UK have pushed manufacturers toward higher-margin premium tiers rather than commodity tubs [2].

The process of manufacturing is being reconstructed. The category's four-decade-old definition, batch freezers and manual filling lines, is being replaced by continuous chilling systems that feature inline dosing, vision-based fill verification, and recipe-switch automation, which reduces changeover time from hours to minutes. Frozen dessert manufacturing capital expenditure among the top ten global producers exceeded USD 2.8 Billion between 2023 and 2025, with approximately 40% of this expenditure allocated to aseptic and low-temperature filling improvements [3]. A disproportionate amount of the market was occupied by plant-based lines, which necessitate separate allergen zoning.

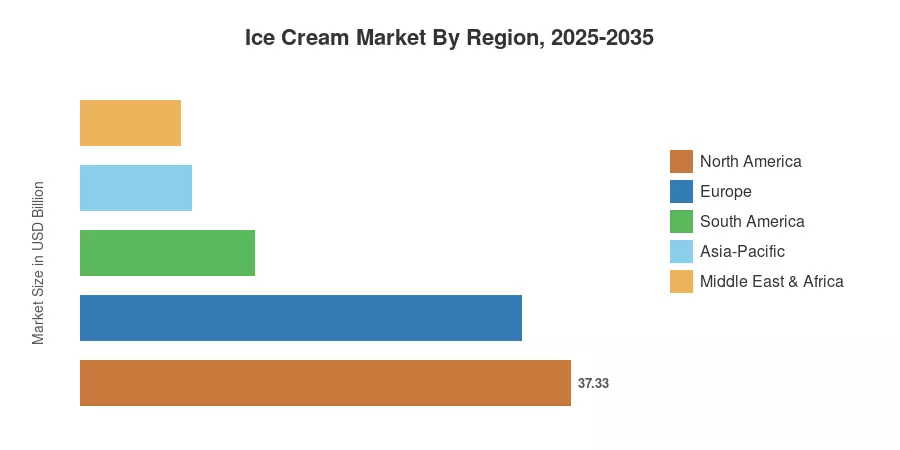
North America's contribution to the Ice Cream Market revenue in 2025 was 29.02%, which was maintained by the expansion of private-label brands and novelty formats. Organized retail penetration in India and Indonesia is driving Asia-Pacific's growth engine at a compound annual growth rate (CAGR) of 6.58% through 2035. The second-largest bloc is Europe, where price premiums are defended against soft volume by artisanal gelato and clean-label positioning. Operators who convert freezer real estate into margin, rather than merely liters, will be rewarded in the upcoming decade.


Key Report Takeaways

• By Type

  • Standard formats accounted for 38.76% of Ice Cream Market value in 2025, still the volume backbone of the category
  • Specialty and artisanal products are forecast to post a 4.87% CAGR through 2035 as unit prices climb
  • Novelties generated USD 38.72 Billion in 2025, led by single-serve impulse purchase at convenience

• By Category

  • Dairy retained 76.36% of Ice Cream Market revenue in 2025, anchored by installed processing capacity
  • Non-dairy formulations are advancing at a 5.81% CAGR, the fastest of any category split


• By Packaging

  • Tubs and cups commanded 67.80% of packaged value in 2025

• By Region

  • North America held the largest revenue share at 29.02% in 2025
  • Asia-Pacific is projected to record the fastest regional CAGR at 6.58% through 2035
  • Europe contributed USD 33.58 Billion in 2025, with artisanal channels defending price


Market Size and Forecast (2021–2035)

Estimates blend company-reported segment revenue, customs and trade-flow data on frozen dessert shipments, retail scanner panels covering 42 countries, and primary interviews with 61 manufacturers, ingredient suppliers, and cold-chain operators. Volume was reconciled against dairy-fat utilisation statistics before value conversion.
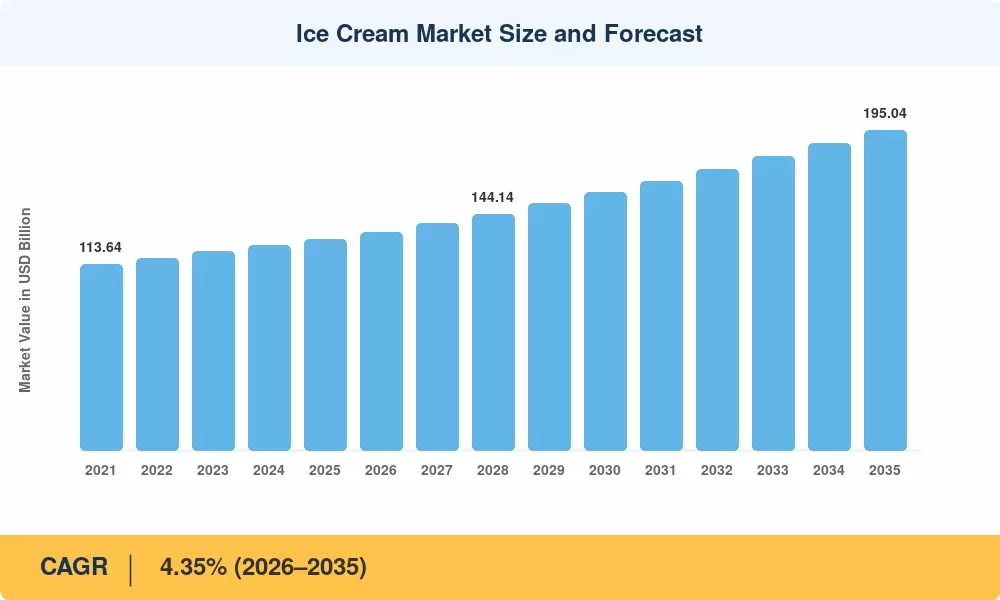
Ice Cream Market Size and Forecast
Our Impact
Enabled $4.3B Revenue Impact for Fortune 500 and Leading Multinationals
Partnering with 2000+ Global Organizations Each Year
30K+ Citations by Top-Tier Firms in the Industry

Driver Impact Analysis

Driver ~% Impact on CAGR Geographic Relevance Impact Timeline
Premiumisation and artisanal mix shift 1.05 Global, Europe-led Long-term (≥4 yr)
Quick-commerce and impulse delivery 0.82 Asia-Pacific, Middle East Short-term (≤2 yr)
Non-dairy and lactose-free demand 0.71 North America, Europe Medium-term (2–4 yr)
Cold-chain and organized retail buildout 0.64 India, ASEAN, Africa Long-term (≥4 yr)
Functional and high-protein reformulation 0.48 North America Medium-term (2–4 yr)
On-trade parlour and foodservice expansion 0.39 Asia-Pacific, Latin America Medium-term (2–4 yr)
Clean-label and sustainability certification 0.26 Europe Long-term (≥4 yr)


Premiumisation Is Rewriting Unit Economics

Average retail price per litre across the twelve largest markets rose 18.4% between 2022 and 2025, and only about a third of that came from inflation pass-through; the balance reflects genuine mix migration toward higher-butterfat, lower-overrun products. Retailers have responded by reallocating freezer facings — Tesco and Carrefour both expanded premium tub facings by double digits in 2024 planograms. The economics are compelling: a premium pint typically carries 220–320 basis points more gross margin than a standard 1.5-litre tub, which is why the Ice Cream Market is seeing capital flow toward smaller, denser formats rather than volume expansion.

Quick Commerce Rebuilt the Impulse Occasion

Ten-minute delivery platforms in India, the Gulf, and parts of Southeast Asia have restored an occasion that supermarket shopping had eroded. Blinkit and Zepto together reported frozen-dessert order volumes rising more than 60% year-over-year during the 2025 summer season, with basket attachment rates near 14% [6]. Insulated last-mile packaging remains the constraint, and roughly USD 190 Million was invested across Indian quick-commerce cold logistics in 2024 alone.

Non-Dairy Moves From Niche to Planogram Staple

Oat, coconut, and almond bases have escaped the specialty aisle. US household penetration of frozen non-dairy desserts reached 11.7% in 2025, up from 6.9% in 2021 [8]. The category's gross margin now approaches parity with dairy as oat-base input costs have fallen roughly 22% since 2022.

Functional Formulation Follows the Metabolic-Health Wave

High-protein and reduced-sugar variants captured an estimated 7.8% of US frozen dessert dollar sales in 2025 [9]. GLP-1 medication adoption has reshaped portion expectations, pushing manufacturers toward 250–350 kcal single-serve tubs that command a 40% price premium per litre.


Restraints Impact Analysis

Restraint weightings represent estimated drag on the growth rate under a base-case scenario. They are directional and interact with one another rather than summing linearly.

Restraint ~% Drag on CAGR Geographic Relevance Impact Timeline
Dairy commodity and cocoa price volatility 0.74 Global Short-term (≤2 yr)
Sugar taxes and marketing restrictions 0.52 Europe, Latin America Medium-term (2–4 yr)
Cold-chain gaps in emerging geographies 0.45 Africa, South Asia Long-term (≥4 yr)
Energy cost exposure in freezing and storage 0.33 Europe Short-term (≤2 yr)
Private-label price compression 0.28 North America, UK Medium-term (2–4 yr)


Input Volatility Squeezes the Middle Tier

Cocoa futures traded above USD 9,000 per tonne through much of 2024 and remained elevated into 2025, while EU butterfat averaged EUR 7,300 per tonne [12]. Standard-tier products, which cannot absorb cost without losing price-point shoppers, bore the brunt. Several regional producers exited coated-novelty lines entirely.

Fiscal and Advertising Policy Narrow the Runway

The UK's restrictions on high-fat, salt, and sugar product promotion, alongside sugar levies now operating in more than 50 jurisdictions, have removed multibuy mechanics that historically drove a meaningful share of tub volume [2]. Mexico's front-of-pack warning labelling reduced affected frozen dessert unit sales by an estimated 6.1% in the first eighteen months [16]. The Ice Cream Market has adapted through reformulation, but compliance cycles typically run 18–24 months per SKU portfolio.

Cold-Chain Loss Still Destroys Value

Estimated product loss from temperature excursion across sub-Saharan African and South Asian distribution ranges between 8% and 14% of dispatched volume [13]. Until last-mile freezer density improves, distribution economics cap penetration outside tier-one cities.


Ice Cream Market Opportunities

Emerging-Market Freezer Placement as a Land Grab

India, Indonesia, Nigeria, and Vietnam collectively add an estimated 380,000 retail freezer units annually, and placement is effectively exclusive shelf space [1]. Manufacturers that finance freezers against volume commitments lock in five-to-seven-year channel control. Payback on a subsidised unit runs 26–34 months at current throughput.

Data Monetisation Through Connected Freezers

IoT-enabled freezer telemetry — temperature, door-open frequency, planogram compliance — is becoming a saleable asset. Roughly 1.9 Million connected retail freezers were deployed globally by 2025, and the resulting demand data supports dynamic replenishment and, increasingly, paid category-insight subscriptions sold back to retailers [17].

On-Trade Parlour Formats and Franchise Economics

Scoop shops, dessert cafés, and soft-serve counters carry gross margins near 68%, far above packaged retail. Asia-Pacific franchise openings grew 12.4% in 2025 [10]. The format also functions as a low-cost innovation lab for flavoured frozen desserts before national retail rollout.

Circular and Low-Carbon Packaging

Paper-based tubs with barrier coatings now meet EU recyclability thresholds, and early adopters report 3–5% retailer listing preference in Nordic chains [11]. Carbon disclosure requirements under CSRD make packaging substitution a reporting asset, not just a cost.

Contract Manufacturing for Challenger Brands

Direct-to-consumer and celebrity dessert brands rarely own assets. Third-party capacity utilisation in North American frozen dessert plants sits near 71%, leaving room for tolling revenue at attractive incremental margins [3].


Ice Cream Market Future Outlook

Automation and Recipe Agility

Continuous freezers with automated clean-in-place and recipe switching are reducing minimum economic batch size by roughly 45%, which makes limited-edition and regional flavours viable at national scale [3]. Expect changeover time, not line speed, to become the key plant KPI by 2030.

Health Reformulation Becomes Table Stakes

WHO guidance on free sugars and expanding front-of-pack schemes will make reduced-sugar dairy desserts the default rather than a subsegment [20]. Sweetener systems combining allulose and soluble fibre are the most likely technical winners, though cost parity is unlikely before 2029.

Energy, Refrigerant, and the Cold-Chain Transition

The Kigali Amendment's HFC phasedown requires refrigerant conversion across retail freezer fleets; the International Energy Agency estimates commercial refrigeration consumes about 8% of global electricity, making efficiency upgrades a direct margin lever [14]. Propane-based freezers now dominate new European placements.

Consolidation and Portfolio Separation

The Ice Cream Market has entered a restructuring phase. Unilever's demerger of its frozen dessert business signalled that the category rewards focused operators over conglomerate ownership, and further carve-outs among diversified food groups are probable through 2028 [21].


Ice Cream Market Segmentation

By Type

Segment Metric (2025) Primary Demand Driver
Standard Ice Cream 38.76% share Family take-home value occasions
Novelties USD 38.72 Billion Single-serve impulse consumption
Soft Serve 3.90% CAGR Foodservice and quick-service dessert menus
Specialty/Artisanal 4.87% CAGR Premium indulgence and gifting


Standard formats remain the volume anchor of the Ice Cream Market, but their share erodes roughly 40 basis points annually as retailers reallocate facings. Novelties are the more interesting commercial story: coated bars and multipacks carry stronger per-litre realisation and travel well through convenience and quick-commerce channels, which is precisely where incremental occasions are being created.

By Category

Segment Metric (2025) Primary Demand Driver
Dairy 76.36% share Installed capacity and taste preference
Non-Dairy 5.81% CAGR Lactose intolerance and flexitarian adoption


Dairy's dominance is structural — plants, ingredients, and consumer expectations are all built around it. Non-dairy grows faster from a smaller base, and its trajectory now depends less on ethical motivation than on texture parity, which oat-protein systems have largely solved.

By Packaging Type

Segment Metric (2025) Primary Demand Driver
Pints 5.33% CAGR Premium portion control
Tubs/Cups 67.80% share Household sharing occasions
More (Sticks, Cones, Sandwiches) USD 17.63 Billion On-the-go convenience


Pints are the fastest-moving format because they align premium pricing with the single-occasion consumption that dominates urban households. Tubs retain scale but face the sharpest private-label pressure.

By Distribution Channel

Segment Metric (2025) Primary Demand Driver
Off-Trade 73.99% share Supermarket and convenience density
On-Trade 6.06% CAGR Parlour, café, and QSR dessert growth


Off-trade still carries roughly three-quarters of Ice Cream Market value, yet on-trade compounds faster and delivers materially better margin per litre. Operators increasingly treat parlours as brand-building assets whose payback shows up in retail pull-through rather than site-level profit.


Regional Market Share Analysis

Region Metric (2025) Primary Investment Themes
North America 29.02% share Premium pints, protein SKUs, private label
Europe USD 33.58 Billion Artisanal gelato, clean label, recyclable packaging
Asia-Pacific 6.58% CAGR (2026–2035) Freezer placement, quick commerce, local flavours
South America USD 13.25 Billion Impulse novelties, distributor consolidation
Middle East & Africa 5.94% CAGR (2026–2035) Cold-chain buildout, halal-certified capacity
Total USD 128.65 Billion

Regional dispersion in the Ice Cream Market reflects freezer density, disposable income, and how far organized retail has displaced traditional trade.


North America

Country Metric (2025) Key Driver
US 78.4% of region Protein and reduced-sugar pint innovation
Canada USD 3.42 Billion Premium and imported gelato demand
Mexico 4.90% CAGR Convenience-channel novelty expansion


US demand is mix-driven rather than volume-driven. Household frozen dessert litres have been broadly flat since 2021, yet dollar sales rose because pints and multipacks displaced 1.5-litre tubs [15]. FDA's revised "healthy" claim rule, finalised in 2024, has pushed reformulation toward lower added sugar in dairy desserts [18]. Private label now holds roughly 22% of US frozen dessert dollars, compressing mid-tier national brands.

Europe

Country Metric (2025) Key Driver
Germany 19.8% of region Discounter-led premium private label
UK USD 5.24 Billion Restricted promotion drives premium mix
France 3.60% CAGR Artisanal and organic positioning
Italy 12.1% of region Gelato heritage and on-trade density
Spain USD 2.71 Billion Tourism-linked seasonal peaks
Nordic Countries 3.20% CAGR Recyclable packaging preference
Russia 8.9% of region Domestic capacity substitution
Rest of Europe USD 4.90 Billion Central European retail modernisation


Europe grows slowly but profitably. EU Farm to Fork sugar-reduction targets and national levies have forced portfolio rebuilds, and the producers that moved first captured shelf space vacated by laggards [2]. Italy's gelateria base — above 39,000 outlets — sustains an on-trade share unmatched elsewhere [10]. Energy costs remain the structural watch item, with cold storage electricity in Germany still roughly 34% above 2021 levels [14].

Asia-Pacific

Country Metric (2025) Key Driver
China 34.6% of region Domestic brand premiumisation
India 7.40% CAGR Cold-chain expansion and quick commerce
Japan USD 6.18 Billion Convenience-store novelty innovation
South Korea 7.2% of region Functional and low-calorie formats
ASEAN 6.90% CAGR Modern trade penetration
Rest of Asia-Pacific USD 3.05 Billion Tourism and foodservice recovery


Asia-Pacific is where the Ice Cream Market adds the most incremental dollars this decade. India's per-capita consumption remains under one litre annually against a global average near 4.5 litres, and cold-chain subsidy programs are closing the distribution gap [1]. China's category has shifted from foreign-brand aspiration to domestic premium, with Yili and Mengniu both expanding high-butterfat lines. Japan's convenience-store channel continues to function as the world's fastest innovation cycle, with typical SKU refresh under 14 weeks.

South America

Country Metric (2025) Key Driver
Brazil 52.3% of region Impulse novelties and kiosk networks
Argentina USD 2.36 Billion Strong artisanal heladería culture
Rest of South America 4.40% CAGR Distributor consolidation


Brazil's category depends on informal and kiosk trade, where freezer financing determines share more than brand equity. Currency volatility has repeatedly reset pricing, and Argentina's heladería network — among the densest per capita globally — insulates the on-trade segment from packaged retail swings [10]. Chilean labelling regulation continues to shape formulation across the Andean markets [16].

Middle East & Africa

Country Metric (2025) Key Driver
Saudi Arabia 21.4% of region Local manufacturing investment
UAE 6.20% CAGR Premium retail and tourism demand
South Africa USD 1.84 Billion Established organized retail base
Egypt 13.7% of region Population scale and value formats
Rest of MEA USD 2.61 Billion Import substitution programs


Gulf demand skews premium and imported, but Saudi Vision 2030 localisation incentives are pulling manufacturing onshore, with several dairy processors commissioning frozen dessert lines since 2023 [19]. Across sub-Saharan Africa, grid reliability rather than consumer appetite constrains the Ice Cream Market — solar-assisted freezer pilots in Kenya and Nigeria have cut spoilage materially where deployed [13].


Ice Cream Market By Region, 2025-2035

Competitive Benchmarking

Concentration is moderate. The estimated HHI sits near 780, with the top five players controlling roughly 34–38% of global value — enough to set category pricing in developed markets but far from dominant across emerging geographies, where regional dairies and artisanal operators hold entrenched local positions. Fragmentation is highest in on-trade and lowest in branded off-trade novelties.

Company Est. Revenue Share Range Key Offerings for Ice Cream Market Strategic Positioning
The Magnum Ice Cream Company ~10–13% Magnum, Ben & Jerry's, Wall's, Cornetto Pure-play global scale post-demerger
Froneri International ~8–11% Häagen-Dazs (licensed), Mövenpick, Oreo Manufacturing efficiency and licensing breadth
General Mills ~4–6% Häagen-Dazs (US/China) Premium-tier concentration
Inner Mongolia Yili ~4–6% Chocliz, Joy Day Chinese domestic premiumisation leader
China Mengniu Dairy ~3–5% Deluxe, Suibian Vertical dairy integration
Lotte Wellfood ~2–4% Monaco, Screwbar East Asian novelty innovation
Wells Enterprises (Ferrero) ~2–4% Blue Bunny, Halo Top US value-to-better-for-you span
GCMMF (Amul) ~2–3% Amul frozen dessert range Cooperative cost base in India
Blue Bell Creameries ~1–3% Regional US tubs and novelties Deep regional loyalty, limited footprint
Danone ~1–3% So Delicious, Silk frozen Non-dairy platform specialist
Morinaga Milk Industry ~1–2% Pino, Mow Japanese convenience-channel focus


Recent News & Developments

  • Unilever (March 2025): Confirmed the separation of its frozen dessert division into a standalone listed entity, creating the largest pure-play operator in the category and signalling a structural shift toward focused ownership [21].
  • Froneri (September 2024): Commissioned an expanded production facility in Poland, adding continuous-freezing capacity aimed at Central and Eastern European retail growth [3].
  • General Mills (June 2024): Launched a reduced-sugar Häagen-Dazs line in North America, positioned against metabolic-health consumption trends [9].
  • Danone (November 2023): Expanded oat-based frozen dessert capacity in the United States following sustained double-digit growth in non-dairy frozen SKUs [8].
  • UK Department of Health (October 2025): Extended restrictions on volume-price promotions for high-fat, salt, and sugar products, materially affecting multibuy tub mechanics [2].
  • Inner Mongolia Yili (April 2025): Announced a premium high-butterfat platform targeting first-tier Chinese cities, alongside expanded Southeast Asian distribution [22].
  • GCMMF / Amul (January 2024): Opened additional processing capacity in western India with integrated cold-chain distribution supported by national infrastructure funding [1].
  • Ferrero / Wells Enterprises (August 2024): Consolidated US manufacturing footprint to improve line utilisation and support better-for-you portfolio expansion [15].


Ice Cream Market Report Scope

Parameter Detail
Market Scope Global packaged and foodservice ice cream and frozen desserts by type, category, packaging, distribution channel, and geography
Study Period 2021–2035 (Historical 2021–2024; Base Year 2025; Forecast 2026–2035)
CAGR 4.35% (2026–2035)
Market Size Checkpoints USD 128.65 Billion (2025); USD 132.95 Billion (2026); USD 195.04 Billion (2035)
Fastest Growing Segments Non-Dairy (5.81% CAGR); On-Trade (6.06% CAGR); Pints (5.33% CAGR); Asia-Pacific (6.58% CAGR)
Companies Profiled 11 global and regional manufacturers
Valuation Currency USD Billion

FAQs

What contract terms should buyers negotiate when sourcing private-label supply in the Ice Cream Market?
Lock butterfat and cocoa on index-linked clauses rather than fixed pricing, and cap pass-through frequency to twice annually. Insist on minimum line-utilisation guarantees, since co-manufacturers price idle capacity into unit costs. [3]
How should investors assess freezer-financing obligations on a manufacturer's balance sheet?
Treat subsidised retail freezers as capital deployed against future volume, not marketing spend. Check the asset's depreciation schedule against typical 26–34 month payback and whether volume commitments are contractually enforceable. [1]
What differentiates oat-based from coconut-based non-dairy formulations for procurement teams?
Oat systems deliver better freeze-thaw stability and neutral flavour but cost roughly 15% more per litre. Coconut carries superior mouthfeel at lower cost, with a distinct flavour profile that limits SKU versatility. [8]
Which certifications materially affect retailer listing decisions in the Ice Cream Market?
Recyclability conformance under EU packaging rules and third-party sustainability verification now influence Nordic and German listings most strongly. Halal certification is effectively mandatory for Gulf and Malaysian distribution. [11] [19]
How does refrigerant regulation change total cost of ownership for retail freezers?
Propane systems cut energy draw by roughly 20% versus legacy HFC units but require flammability-compliant store installation. Retrofit costs typically recover within four years at current European electricity prices. [14] [25]
What integration risks accompany acquisitions of regional artisanal producers?
Artisanal brand equity often depends on local sourcing narratives that centralised procurement destroys. Retain separate supply chains for at least three years, and expect batch-size economics to remain unfavourable versus core lines. [7]
Where is white space emerging for new entrants in the Ice Cream Market?
Adult-oriented, low-sugar single-serve formats sold through on-trade and quick commerce remain underserved by incumbents optimised for family tubs. Entry capital is modest when using tolling capacity rather than owned plants. [9]    
Author
Author
Author Profile
Snehal Singh LinkedIn
Manager - Research
High acumen in analyzing complex macro & micro markets with more than 6 years of work experience in the field of market research. By implementing her analytical skills in forecasting and estimation into market research reports, she has expertise in Packaging, Construction, and Equipment domains. She handles a team size of 20-25 resources and ensures smooth running of the projects, associated marketing activities, and client servicing.
Share::
Request Free Sample
Download Free Sample

Kindly complete the form below to receive a free sample of this Report

* Please use a valid business email

Share::
Request Free Sample
Download PDF ×

We do not share your information with anyone. However, we may send you emails based on your report interest from time to time. You may contact us at any time to opt-out.
















