• Cat-intel
  • MedIntelliX
  • Resources
  • About Us
  • Hero Background
    English
    Chinese
    French
    Japanese
    Korean
    German
    Spanish

    Image Sensor Market Share

    ID: MRFR/SEM/0351-HCR
    100 Pages
    Ankit Gupta
    October 2025

    Image Sensor Market Research Report Information By Technology (CMOS, CCD, And sCMOS), By Linearity (Linear And Non-Linear), By Spectrum (Visible Spectrum And Invisible Spectrum), By Application (Consumer Electronics, Automobile, Surveillance, Medical, And Others) And By Region (North America, Europe, Asia-Pacific, And Rest Of The World) –Industry Size, Share and Trends Till 2032

    Share:
    Download PDF ×

    We do not share your information with anyone. However, we may send you emails based on your report interest from time to time. You may contact us at any time to opt-out.

    Image Sensor Market Infographic
    $ 4,950.0
    $ 5,950.0
    $ 7,250.0

    Market Share

    Image Sensor Market Share Analysis

    The Image Sensor Market is a highly competitive and dynamic industry, witnessing continuous technological advancements and evolving consumer demands. Within this environment, different market share positioning strategies are used by companies to acquire a competitive advantage and increase their market presence. Differentiation is one of the common approaches wherein companies emphasis on providing distinctive and superior functionality in image sensors. This can be in the form of better resolutions, increased sensitivity or new technologies such as back-illuminated sensors. To emphasize these unique features, such companies want to attract those clients who need modern innovations and establish themselves as leaders in some markets. Another important strategy implemented by companies in the Image Sensor Market is cost leadership. Other companies concentrate on improving manufacturing procedures and lowering the price of image sensors for better affordability. This approach seeks to attract a wider group of consumers including in price-sensitive markets and increase the overall market share by making it more affordable. Cost leadership is only achieved through effective supply chain management and attention to the quality of products despite cost limitations. Companies also find a focus strategy, focusing on particular applications or sectors of the broader Image Sensor Market. For instance, a company may focus on manufacturing image sensors for medical imaging systems or automotive applications or as used in security surveillance. However, this selective strategy enables companies to develop products that meet the specific demands of a particular niche by deploying solutions compliant with customer needs. Specializing in particular segments, companies may establish a high-quality reputation and obtain huge market shares for those areas. Market Share Positioning in the Image Sensor market includes collaboration and partnerships. Companies then usually forge strategic partnerships with camera builders, smartphone developers or other high tech competitors to embed their image sensors into an expanded product line. These collaborations result to co-investment projects which guarantee that image sensors are smoothly incorporated in the most recent devices. Through partnerships with major players in the linked industries, firms can capitalize on each other’s strengths and setup a variety of solutions that would broaden market coverage and serve to build up an establishment. Innovation is the soul of Image Sensor Market, and companies who follow R & D become leaders in competition. Keeping these advantages ahead of competition, it is necessary to further advance the sensor technology as well as search for new materials and create smaller, more energy-efficient sensors. Innovations such as 3D sensing, time-of-flight sensors, and stacked sensor architectures contribute to companies' market share by offering solutions that meet emerging industry demands and trends.

    Market Summary

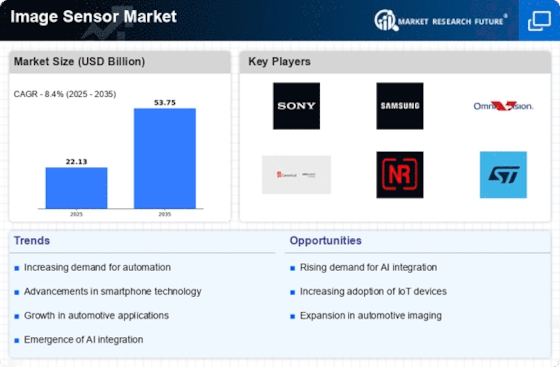
    The Global Image Sensor Market is projected to grow from 22.13 USD Billion in 2024 to 53.75 USD Billion by 2035.

    Key Market Trends & Highlights

    Image Sensor Key Trends and Highlights

    • The market is expected to experience a compound annual growth rate (CAGR) of 8.4 percent from 2025 to 2035. By 2035, the market valuation is anticipated to reach 53.8 USD Billion, indicating robust growth potential. in 2024, the market is valued at 22.13 USD Billion, reflecting a strong foundation for future expansion. Growing adoption of advanced imaging technologies due to increasing demand for high-resolution cameras is a major market driver.

    Market Size & Forecast

    2024 Market Size 22.13 (USD Billion)
    2035 Market Size 53.75 (USD Billion)
    CAGR (2025-2035) 8.40%
    Largest Regional Market Share in 2024 latin_america)

    Major Players

    <p>Sony Corporation Limited, Samsung Semiconductor Limited, OmniVision Technologies Limited, PixArt Imaging Limited, S.K. Hynix Inc., Teledyne Technologies</p>

    Market Trends

    Growing demand for camera-enabled mobile phones is driving the market growth

    Market CAGR for the image sensor market is driven by the rising demand for camera-enabled mobile phones. The consumer electronics sector has benefited from the increased use of cameras with image sensors on smartphones globally. The rising popularity of mobile photography has made it a key factor for smartphone manufacturers when deciding whether to use natural image sensors. These companies create smartphones with up to five cameras in a single device. Digital single-lens reflex (DSLR) cameras, computers, cellphones, and other gadgets.

    Along with the smartphone adoption rate, image capture has expanded dramatically due to smartphones’ inclusion of cameras. The market for image sensors is expected to be driven by these elements. The image sensor size affects the security camera’s field of vision for a definite lens and light sensitivity, which impacts the demand for security cameras. Since most security camera systems use image sensors, which allow faster speed with less power consumption.

    Additionally, traction and steady development of the Internet of Things (IoT) and machine vision applications is another major driving factor. The requirement for image sensors is driven by the increasing use of IoT and machine vision technologies in all sectors, such as healthcare, manufacturing, and security. In manufacturing, IoT and machine vision technologies are used for quality control and monitoring. This procedure needs image sensors for capturing and analyzing images. In the healthcare sector, image sensors in medical equipment, like endoscopes and X-ray machines, aid in the diagnosis by capturing high-resolution images, treatment, and care of patients.

    Thus, driving the Image Sensor market revenue.

    <p>The ongoing advancements in image sensor technology are poised to enhance applications across various sectors, including automotive, healthcare, and consumer electronics, thereby driving a transformative shift in how visual data is captured and utilized.</p>

    U.S. Department of Commerce

    Image Sensor Market Market Drivers

    Market Growth Projections

    The Global Image Sensor Market Industry is poised for substantial growth, with projections indicating a market value of 22.1 USD Billion in 2024 and an anticipated increase to 53.8 USD Billion by 2035. This growth trajectory suggests a compound annual growth rate (CAGR) of 8.4% from 2025 to 2035. Various factors contribute to this expansion, including rising demand across consumer electronics, automotive applications, and security systems. The increasing integration of image sensors in emerging technologies further supports this growth. These projections underscore the dynamic nature of the Global Image Sensor Market Industry, highlighting its potential for innovation and development.

    Advancements in Automotive Technology

    The Global Image Sensor Market Industry is significantly influenced by advancements in automotive technology. The integration of image sensors in vehicles for applications such as advanced driver-assistance systems (ADAS) and autonomous driving is becoming increasingly prevalent. These sensors enhance safety features, including lane departure warnings and collision avoidance systems. As the automotive sector evolves, the demand for high-resolution image sensors is expected to rise. This trend aligns with the projected market growth, as the industry adapts to incorporate these technologies. The automotive segment is likely to contribute substantially to the overall market expansion, reflecting the transformative impact of image sensors in the Global Image Sensor Market Industry.

    Emergence of Internet of Things (IoT)

    The emergence of the Internet of Things (IoT) is reshaping the Global Image Sensor Market Industry. As more devices become interconnected, the need for image sensors in various applications, including smart homes and industrial automation, is increasing. These sensors enable real-time monitoring and data collection, enhancing operational efficiency and user experience. The integration of image sensors in IoT devices is expected to drive market growth, with projections indicating a market value of 53.8 USD Billion by 2035. This trend highlights the potential for innovation and expansion within the Global Image Sensor Market Industry, as manufacturers seek to capitalize on the growing IoT ecosystem.

    Rising Demand for Consumer Electronics

    The Global Image Sensor Market Industry experiences a notable surge in demand driven by the proliferation of consumer electronics. Devices such as smartphones, tablets, and laptops increasingly incorporate advanced imaging capabilities, enhancing user experience. In 2024, the market is projected to reach 22.1 USD Billion, reflecting the growing consumer preference for high-quality imaging. This trend is likely to continue as manufacturers innovate to meet consumer expectations, suggesting a robust growth trajectory. The integration of image sensors in various applications, including augmented reality and virtual reality, further amplifies this demand, indicating a dynamic landscape for the Global Image Sensor Market Industry.

    Technological Innovations in Image Sensing

    Technological innovations in image sensing are pivotal to the evolution of the Global Image Sensor Market Industry. Advancements in sensor technology, such as the development of CMOS sensors and enhanced pixel architectures, are driving improvements in image quality and performance. These innovations enable applications in diverse fields, including healthcare, entertainment, and industrial automation. As technology continues to advance, the market is likely to witness increased adoption of high-performance image sensors. This trend not only supports the growth of existing applications but also opens avenues for new use cases, indicating a vibrant future for the Global Image Sensor Market Industry.

    Growth of Surveillance and Security Systems

    The Global Image Sensor Market Industry sees a considerable boost from the growth of surveillance and security systems. As concerns regarding safety and security escalate globally, there is an increasing demand for high-quality imaging solutions in surveillance applications. Image sensors play a crucial role in enhancing the effectiveness of security cameras and monitoring systems. The market is projected to expand significantly, with a compound annual growth rate (CAGR) of 8.4% anticipated from 2025 to 2035. This growth is indicative of the rising investments in smart city initiatives and public safety measures, suggesting a promising outlook for the Global Image Sensor Market Industry.

    Market Segment Insights

    Image Sensor Technology Insights

    <p>The Image Sensor Market segmentation, based on technology, includes sCMOS, CCD, and CMOS. The <a href="https://www.marketresearchfuture.com/reports/cmos-scmos-image-sensor-market-909">CMOS</a> segment dominated the market, accounting for the maximum market revenue. CMOS image sensors are greatly used because they are smaller, more power-efficient, less expensive, and have higher video frame rates. A higher dynamic range is available, with less current and voltage. CMOS is well suited for high-speed and high-resolution imaging applications because it takes less time to read out image data.</p>

    <p>The Image Sensor Market segmentation, based on optical format, includes non-linear and linear. The linear category generated the maximum market revenue. The linear image sensor is a solid device that transforms an optical image into an analog signal line by line. CMOS and CCD image sensors are different linear image sensor types with unique circuit designs. The line scan camera is used for visual exams (a film, printed matter, fabric etc.), grain color sorters, etc. Bank note recognition systems in banking terminals are applications for which linear image sensors are suited.</p>

    <p>Other used include copier scanning components, image scanners, barcode readers and line scan cameras.</p>

    Image Sensor Spectrum Insights

    <p>The global Image Scanner market segmentation, based on spectrum, includes invisible spectrum and visible spectrum. The invisible spectrum has generated the maximum market revenue due to its low cost and high accuracy. Invisible spectrum used in defense &amp; aerospace, automotive, healthcare, and consumer electronics. The visible spectrum is anticipated to be the fastest-growing category in the projected period.</p>

    Image Sensor Application Insights

    <p>The Image Sensor Market segmentation, based on application, includes medical, surveillance, automobile, consumer electronics and others. The consumer electronics category generated the most income due to the rising sale of smartphones. High sensitivity &amp; low noise DSLR cameras, high-resolution <a href="https://www.marketresearchfuture.com/reports/digital-camera-market-2316">digital cameras</a>, point-and-shoot cameras, smartphones with dual cameras, and tablet PC cameras collectively push the demand for imaging sensors in consumer electronics.</p>

    Get more detailed insights about Image Sensor Market Research Report - Global Forecast till 2032

    Regional Insights

    By region, the study provides market insights into North America, Europe, Asia-Pacific and Rest of the World. The North American Image Sensor market area will dominate this market, owing to an increase in demand for smartphones, laptops, tablets, and other mobile devices. In addition, the growing utilization of image sensors in applications such as drones, cameras, and industrial devices, will boost market growth in this region.

    Further, the major countries studied in the market report are The US, Canada, German, France, the UK, Italy, Spain, China, Japan, India, Australia, South Korea, and Brazil.

    Figure 2: Image Sensor Market SHARE BY REGION 2022 (USD Billion)

    Image Sensor Market SHARE BY REGION 2022

    Source: Secondary Research, Primary Research, MRFR Database and Analyst Review

    Europe's Image Sensor market accounts for the second-largest market share due to the growing popularity of virtual and augmented reality applications. Further, the German Image Sensor market held the largest market share, and the UK Image Sensor market was the fastest-growing market in the European region.

    The Asia-Pacific Image Sensor Market is expected to grow at the fastest CAGR from 2023 to 2032. This is due to the developing economy and increasing disposable income. Moreover, China’s Image Sensor market held the largest market share, and the Indian Image Sensor market was the fastest-growing market in the Asia-Pacific region.

    Key Players and Competitive Insights

    Leading market players are investing heavily in research and development to expand their product lines, which will help the Image Sensor market, grow even more. Market participants are also undertaking several strategic activities to expand their global footprint, with important market developments including new product launches, contractual agreements, mergers and acquisitions, higher investments, and collaboration with other organizations. The Image Sensor industry must offer cost-effective items to expand and survive in a more competitive and rising market climate.

    Manufacturing locally to minimize operational costs is one of the key business tactics manufacturer’s use in the global Image Sensor industry to benefit clients and increase the market sector. In recent years, the Image Sensor industry has offered some of the most significant advantages to technology. Major players in the Image Sensor market, including Sony Corporation Limited (Japan), Samsung Semiconductor Limited (South Korea), OmniVision Technologies Limited, PixArt Imaging Limited (Taiwan), S.K. Hynix Inc. (South Korea), Teledyne Technologies Limited (US), and others, are attempting to increase market demand by investing in research and development operations.

    Samsung Electronics Co. Ltd., Tristar Electronics, is a South Korean multinational electronics firm headquartered in Yeongtong-gu, Suwon, South Korea. For customers including Apple, Sony, HTC, and Nokia, the company is an important producer of electronic components such as lithium-ion batteries, semiconductors, camera modules, image sensors, and displays. It is also the largest semiconductor memory maker in the world. For instance: In June 2022, Samsung Electronics launched 200MP ISOCELL HP3 features the lowest 0.56-micrometer pixels in the industry.

    This sensor fits 200 million pixels into a 1/1.4” optical format, the diameter of the area photographed through the camera lens, which is 12% smaller than the predecessor’s 0.64m. The sensor also includes a Super QPD auto-focusing technology, which gives all of the sensor’s pixels the ability to focus on objects automatically.

    OmniVision Technologies Inc. is an American subsidiary established by Will Semiconductor, a Chinese manufacturer of semiconductor devices and mixed-signal integrated circuits. The business creates and produces digital imaging solutions for use in webcams, security and surveillance cameras, entertainment, automotive, and medical imaging systems, as well as mobile phones, laptops, netbooks, and other computing devices. OmniVision Technologies is based in Santa Clara, California, and has offices across the US, Western Europe, and Asia.

    For Instance: In March 2022, OmniVision revealed the new OS03B10 CMOS image sensor, which features a 3-megapixel (MP), HD, and IP analog cameras with high-quality digital images and high-definition video. This high-performance, economical solution combines front-side illuminations with excellent sensitivity to accurately reproduce colors in bright and dim lighting.

    Key Companies in the Image Sensor Market market include

    Industry Developments

    • Q2 2025: Prophesee and Sony develop stacked ‘event-based’ vision sensor Prophesee and Sony announced the development of a new stacked event-based vision sensor, marking a significant product innovation in the image sensor market.
    • Q2 2025: STMicroelectronics and Metalenz partner to drive metasurface optics adoption STMicroelectronics entered a partnership with Metalenz to accelerate the adoption of metasurface optics in image sensor applications, aiming to enhance sensor performance and miniaturization.
    • Q2 2025: Sony targets automotive cameras with high-definition CMOS image sensor Sony launched a new high-definition CMOS image sensor specifically designed for automotive camera applications, expanding its product portfolio in the automotive sector.
    • Q2 2025: Prophesee's sensors proliferate with industrial partners Prophesee reported increased adoption of its event-based image sensors through new collaborations with multiple industrial partners, supporting broader deployment in machine vision.
    • Q2 2025: SmartSens experienced a dramatic +105.7% YoY revenue increase, breaking into mobile, security, and automotive markets and climbing in global rankings SmartSens achieved a 105.7% year-over-year revenue increase, driven by its expansion into mobile, security, and automotive image sensor markets, and advanced in global market rankings.
    • Q2 2025: SK Hynix is retaining only legacy products to refocus its core activities on memory SK Hynix announced a strategic shift, retaining only legacy image sensor products as it refocuses its business on core memory activities.
    • Q2 2025: Samsung maintained stable revenue, while STMicroelectronics and onsemi lost market share Samsung reported stable revenue in its image sensor business, while STMicroelectronics and onsemi experienced a decline in market share.
    • Q2 2025: US and European players may continue losing ground, while Sony and Chinese suppliers are expected to expand further in 2025 Industry analysts project that US and European image sensor companies may continue to lose market share, while Sony and Chinese suppliers are expected to expand their presence in 2025.
    • Q2 2025: Looking ahead, Sony, Omnivision, and SmartSens are projected to grow revenues based on early 2025 performance Early 2025 performance data indicates that Sony, Omnivision, and SmartSens are on track for revenue growth in the image sensor market.

    Future Outlook

    Image Sensor Market Future Outlook

    <p>The Global Image Sensor Market is projected to grow at an 8.40% CAGR from 2025 to 2035, driven by advancements in AI, automotive applications, and consumer electronics.</p>

    New opportunities lie in:

    • <p>Invest in AI-driven image processing technologies to enhance sensor capabilities.&nbsp;</p><p>Develop specialized sensors for autonomous vehicles to capture high-resolution data.&nbsp;</p><p>Explore partnerships with smartphone manufacturers for advanced imaging solutions.</p>

    <p>By 2035, the Image Sensor Market is expected to reach substantial growth, reflecting evolving technological demands.</p>

    Market Segmentation

    Image Sensor Regional Outlook

    • {"North America"=>["US"
    • "Canada"]}
    • {"Europe"=>["Germany"
    • "France"
    • "UK"
    • "Italy"
    • "Spain"
    • "Rest of Europe"]}
    • {"Asia-Pacific"=>["China"
    • "Japan"
    • "India"
    • "Australia"
    • "South Korea"
    • "Rest of Asia-Pacific"]}
    • {"Rest of the World"=>["Middle East"
    • "Africa"
    • "Latin America"]}

    Image Sensor Technology Outlook

    • sCMOS
    • CCD
    • CMOS

    Image Sensor Application Outlook

    • Medical
    • Surveillance
    • Automobile
    • Consumer Electronics
    • Others

    Image Sensor Optical Format Outlook

    • Non-Linear
    • Linear
    • Invisible Spectrum
    • Visible Spectrum

    Report Scope

    Attribute/Metric Details
    Market Size 2024 USD 22.13 Billion
    Market Size 2035 53.75 (Value (USD Billion))
    Compound Annual Growth Rate (CAGR) 8.40% (2025 - 2035)
    Base Year 2024
    Market Forecast Period 2025 - 2035
    Historical Data 2018- 2022
    Market Forecast Units Value (USD Billion)
    Report Coverage Revenue Forecast, Market Competitive Landscape, Growth Factors, and Trends
    Segments Covered Technology, Optical Format, Spectrum, Application, and Region
    Geographies Covered North America, Europe, Asia Pacific, and the Rest of the World
    Countries Covered The US, Canada, German, France, UK, Italy, Spain, China, Japan, India, Australia, South Korea, and Brazil
    Key Companies Profiled Sony Corporation Limited (Japan), Samsung Semiconductor Limited (South Korea), OmniVision Technologies Limited, PixArt Imaging Limited (Taiwan), S.K. Hynix Inc. (South Korea), Teledyne Technologies Limited (US)
    Key Market Opportunities Rising demand for advanced phonesReduced power consumption
    Key Market Dynamics Increase demand for camera-enabled mobile phonesRising use of image sensors in biometrics
    Market Size 2025 23.99 (Value (USD Billion))

    Market Highlights

    Author

    Ankit Gupta
    Senior Research Analyst

    She holds an experience of about 6+ years in market research and business consulting, working under the spectrum of information communication technology, telecommunications and semiconductor domains. aarti conceptualizes and implements a scalable business strategy and provides strategic leadership to the clients. her expertise lies in market estimation, competitive intelligence, pipeline analysis, customer assessment, etc.

    Leave a Comment

    Latest Comments

    John Doe
    john@example.com

    This is a great article! Really helped me understand the topic better.

    Posted on July 23, 2025, 10:15 AM
    Jane Smith
    jane@domain.com

    Thanks for sharing this. I’ve bookmarked it for later reference.

    Posted on July 22, 2025, 7:45 PM

    FAQs

    How much is the Image Sensor market?

    The Image Sensor Market size was valued at USD 20.2 Billion in 2023.

    What is the growth rate of the Image Sensor market?

    The global market is projected to grow at a CAGR of 8.40% during the forecast period, 2024-2032.

    Which region held the largest market share in the Image Sensor market?

    North America had the largest share of the global market

    Who are the key players in the Image Sensor market?

    The key players in the market are Sony Corporation Limited (Japan), Samsung Semiconductor Limited (South Korea), OmniVision Technologies Limited, PixArt Imaging Limited (Taiwan), S.K. Hynix Inc. (South Korea), Teledyne Technologies Limited (US).

    Which technology led the Image Sensor market?

    The CMOS category dominated the market in 2022.

    Which application had the largest market share in the Image Sensor market?

    Consumer electronics had the largest share of the global market.

    1. Table of Contents
    2. Research Methodologies
      1. Research Process
      2. Primary Research
      3. Secondary Research
      4. Forecast Model
        1. Market Size Estimation
    3. Market Dynamics
      1. Market Drivers
        1. Increasing Adoption of Dual Camera Mobile Phones and Other Smartphones
        2. Increasing Usage of Webcams and Digital Cameras
        3. Increasing Surveillance and Security Concerns
        4. Increasing Usage of Image Sensors in Medical Applications
      2. Market Restraints
        1. High Maintenance Costs of Image Sensors
        2. Declining Demand of Still Camera
        3. Dynamic Nature of Semiconductor Industry
      3. Market Opportunities
        1. Growing Digitalization
        2. Growth Opportunities in Gaming Devices, Especially Those Associated with Virtual Reality
        3. Increasing Innovations in Technologies
    4. Executive Summary
    5. Market Factor Analysis
      1. Image Sensor Supply Chain
      2. Porter’s Five Forces Analysis
    6. Global Image Sensor Market, By Technology
      1. Introduction
      2. Market by Sub-Segment
        1. CMOS
        2. By CMOS Sub-Segment
        3. CCD
        4. sCMOS
        5. Others
    7. Global Image Sensor Market, By Optical Format
      1. Introduction
        1. By Sub-Segment
    8. Global Image Sensor Market, By Linearity
      1. By Linearity
        1. Linear
        2. By Linear Sub-Segment
        3. Non-Linear
    9. Global Image Sensor Market, By Spectrum
      1. By Spectrum
        1. Visible Spectrum
        2. Invisible Spectrum
    10. Global Image Sensor Market, By Application
      1. Application
      2. By Sub-Segment
        1. Consumer Electronics
        2. Automobile
        3. Surveillance
        4. Medical
        5. Others
    11. Global Image Sensor Market, By Region
      1. North America
    12. By Sub-Segment
      1. Europe
    13. Surveillance
      1. Asia-Pacific
    14. By Surveillance
      1. RoW
    15. Competitive Analysis
      1. Market Share Analysis
      2. Company Profiles
        1. Sony Corporation
        2. Samsung Electronics Corporation Ltd
        3. Panasonic Corporation
        4. ON Semiconductor
        5. Canon Inc.
        6. Toshiba Corporation
        7. Galaxy Core Inc.
        8. SK Hynix Inc.
        9. PixArt Imaging Inc.
        10. OmniVision Technologies Inc.
        11. Teledyne Technologies Inc.
    16. Appendix
      1. Definition
        1. Scope of the Study
        2. Research Objective
        3. Assumption
        4. Limitation
    17. List of Tables and Figures
      1. List of Tables
      2. TABLE 1 GLOBAL IMAGE SENSOR MARKET, BY TECHNOLOGY, 2024-2032 (USD MILLION)
      3. TABLE 2 GLOBAL IMAGE SENSOR MARKET OF CMOS SEGMENT BY REGION, 2024-2032 (USD MILLION)
      4. TABLE 3 GLOBAL IMAGE SENSOR MARKET OF SUB-SEGMENT BY TYPE, 2024-2032 (USD MILLION)
      5. TABLE 4 GLOBAL IMAGE SENSOR MARKET OF FRONT SIDE ILLUMINATION SEGMENT, BY REGION,2024-2032 (USD MILLION)
      6. TABLE 5 GLOBAL IMAGE SENSOR MARKET OF BACK SIDE ILLUMINATION, BY REGION 2024-2032 (USD MILLION)
      7. TABLE 6 GLOBAL IMAGE SENSOR MARKET OF OTHERS SEGMENT, BY REGION 2024-2032 (USD MILLION)
      8. TABLE 7 GLOBAL IMAGE SENSOR MARKET OF CCD SEGMENT, BY REGION 2024-2032 (USD MILLION)
      9. TABLE 8 GLOBAL IMAGE SENSOR MARKET OF SCMOS SEGMENT BY REGION, 2024-2032 (USD MILLION)
      10. TABLE 9 GLOBAL IMAGE SENSOR MARKET OF OTHERS SEGMENT BY REGION, 2024-2032 (USD MILLION)
      11. TABLE 10 GLOBAL IMAGE SENSOR MARKET, BY OPTICAL FORMAT SEGMENT, 2024-2032 (USD MILLION)
      12. TABLE 11 GLOBAL IMAGE SENSOR MARKET OF 1/10 TO 1/6 INCH IMAGE SENSOR SEGMENT BY REGION, 2024-2032 (USD MILLION)
      13. TABLE 12 GLOBAL IMAGE SENSOR MARKET OF 1/5.9 TO 1/4 INCH IMAGE SENSOR SEGMENT BY REGION, 2024-2032 (USD MILLION)
      14. TABLE 13 GLOBAL IMAGE SENSOR MARKET OF 1/1.9 TO 1 INCH IMAGE SENSOR SEGMENT BY REGION, 2024-2032 (USD MILLION)
      15. TABLE 14 GLOBAL IMAGE SENSOR MARKET OF ABOVE 1 INCH IMAGE SENSOR, BY REGION, 2024-2032 (USD MILLION)
      16. TABLE 15 GLOBAL IMAGE SENSOR MARKET OF ABOVE 1 INCH IMAGE SENSOR BY REGION, 2024-2032 (USD MILLION)
      17. TABLE 16 GLOBAL IMAGE SENSOR MARKET, BY LINEARITY 2024-2032 (USD MILLION)
      18. TABLE 17 GLOBAL IMAGE SENSOR MARKET BY LINEAR, BY REGION - FORECAST 2024 - 2032 (USD MILLION)
      19. TABLE 18 GLOBAL IMAGE SENSOR MARKET BY LINEAR SUB-SEGMENT- FORECAST 2024 - 2032 (USD MILLION)
      20. TABLE 19 GLOBAL IMAGE SENSOR MARKET BY 2D PROCESSING, BY REGION - FORECAST 2024 - 2032 (USD MILLION)
      21. TABLE 20 GLOBAL IMAGE SENSOR MARKET BY 3D PROCESSING, BY REGION - FORECAST 2024 - 2032 (USD MILLION)
      22. TABLE 21 GLOBAL IMAGE SENSOR MARKET BY NON-LINEAR, BY REGION - FORECAST 2024 - 2032 (USD MILLION)
      23. TABLE 22 GLOBAL IMAGE SENSOR MARKET BY NON-LINEAR SUB-SEGMENT- FORECAST 2024 - 2032 (USD MILLION)
      24. TABLE 23 GLOBAL IMAGE SENSOR MARKET BY 2D PROCESSING, BY REGION- FORECAST 2024 - 2032 (USD MILLION)
      25. TABLE 24 GLOBAL IMAGE SENSOR MARKET BY 3D PROCESSING, BY REGION- FORECAST 2024 - 2032 (USD MILLION)
      26. TABLE 25 GLOBAL IMAGE SENSOR MARKET BY SPECTRUM, BY REGION - FORECAST 2024 - 2032 (USD MILLION)
      27. TABLE 26 GLOBAL IMAGE SENSOR MARKET BY VISIBLE SPECTRUM, BY REGION - FORECAST 2024 - 2032 (USD MILLION)
      28. TABLE 27 GLOBAL IMAGE SENSOR MARKET BY INVISIBLE SPECTRUM, BY REGION - FORECAST 2024 - 2032 (USD MILLION)
      29. TABLE 28 GLOBAL IMAGE SENSOR MARKET BY APPLICATION- FORECAST 2024 - 2032 (USD MILLION)
      30. TABLE 29 GLOBAL IMAGE SENSOR MARKET BY CONSUMER ELECTRONICS, BY REGION 2024 - 2032 (USD MILLION)
      31. TABLE 30 GLOBAL IMAGE SENSOR MARKET BY AUTOMOBILE, BY REGION 2024 - 2032 (USD MILLION)
      32. TABLE 31 GLOBAL IMAGE SENSOR MARKET BY SURVEILLANCE, BY REGION 2024 - 2032 (USD MILLION)
      33. TABLE 32 GLOBAL IMAGE SENSOR MARKET BY TYPE, BY REGION 2024 - 2032 (USD MILLION)
      34. TABLE 33 GLOBAL IMAGE SENSOR MARKET BY COMMERCIAL SECURITY, BY REGION 2024 - 2032 (USD MILLION)
      35. TABLE 34 GLOBAL IMAGE SENSOR MARKET BY NIGHT SURVEILLANCE, BY REGION 2024 - 2032 (USD MILLION)
      36. TABLE 35 GLOBAL IMAGE SENSOR MARKET BY BORDER SECURITY, BY REGION 2024 - 2032 (USD MILLION)
      37. TABLE 36 GLOBAL IMAGE SENSOR MARKET BY DRONES, BY REGION 2024 - 2032 (USD MILLION)
      38. TABLE 37 GLOBAL IMAGE SENSOR MARKET BY HOME SECURITY, BY REGION 2024 - 2032 (USD MILLION)
      39. TABLE 38 GLOBAL IMAGE SENSOR MARKET BY MEDICAL, BY REGION 2024 - 2032 (USD MILLION)
      40. TABLE 39 GLOBAL IMAGE SENSOR MARKET BY MEDICAL SUB-SEGMENT, BY TYPE 2024 - 2032 (USD MILLION)
      41. TABLE 40 GLOBAL IMAGE SENSOR MARKET BY ENDOSCOPY, BY REGION 2024 - 2032 (USD MILLION)
      42. TABLE 41 GLOBAL IMAGE SENSOR MARKET BY SURGERY, BY REGION 2024 - 2032 (USD MILLION)
      43. TABLE 42 GLOBAL IMAGE SENSOR MARKET BY DENTAL, BY REGION 2024 - 2032 (USD MILLION)
      44. TABLE 43 GLOBAL IMAGE SENSOR MARKET BY DERMATOLOGY, BY REGION 2024 - 2032 (USD MILLION)
      45. TABLE 44 GLOBAL IMAGE SENSOR MARKET BY OPHTHALMOLOGY, BY REGION 2024 - 2032 (USD MILLION)
      46. TABLE 45 GLOBAL IMAGE SENSOR MARKET BY OPHTHALMOLOGY, BY REGION 2024 - 2032 (USD MILLIOION)
      47. TABLE 46 GLOBAL IMAGE SENSOR MARKET BY OTHERS, BY REGION 2024 - 2032 (USD MILLION)
      48. TABLE 47 GLOBAL IMAGE SENSOR MARKET BY OTHERS SUB-SEGMENT, BY TYPE 2024 - 2032 (USD MILLION)
      49. TABLE 48 GLOBAL IMAGE SENSOR MARKET BY VIRTUAL REALITY IN GAMING DEVICES, BY REGION, 2024 - 2032 (USD MILLION)
      50. TABLE 49 GLOBAL IMAGE SENSOR MARKET BY AEROSPACE, BY REGION 2024 - 2032 (USD MILLION)
      51. TABLE 50 GLOBAL IMAGE SENSOR MARKET BY BARCODE SCANNING, BY REGION 2024 - 2032 (USD MILLION)
      52. TABLE 51 GLOBAL IMAGE SENSOR MARKET BY COPIER SCANNING, BY REGION 2024 - 2032 (USD MILLION)
      53. TABLE 52 GLOBAL IMAGE SENSOR MARKET BY IMAGE SCANNING, BY REGION 2024 - 2032 (USD MILLION)
      54. TABLE 53 GLOBAL IMAGE SENSOR MARKET BY BIOMETRICS, BY REGION 2024 - 2032 (USD MILLION)
      55. TABLE 54 GLOBAL IMAGE SENSOR MARKET BY MACHINE VISION, BY REGION 2024 - 2032 (USD MILLION)
      56. TABLE 55 GLOBAL IMAGE SENSOR MARKET BY ITS, BY REGION 2024 - 2032 (USD MILLION)
      57. TABLE 56 GLOBAL IMAGE SENSOR MARKET BY OTHERS, BY REGION 2024 - 2032 (USD MILLION)
      58. TABLE 57 GLOBAL IMAGE SENSOR MARKET, BY REGION (USD MILLION), 2024-2032
      59. TABLE 58 NORTH AMERICA: IMAGE SENSOR MARKET, BY COUNTRY (USD MILLION), 2024-2032
      60. TABLE 59 NORTH AMERICA: IMAGE SENSOR MARKET, BY TECHNOLOGY (USD MILLION), 2024-2032
      61. TABLE 60 NORTH AMERICA: IMAGE SENSOR MARKET, BY TYPE (USD MILLION), 2024-2032
      62. TABLE 61 NORTH AMERICA: IMAGE SENSOR MARKET, BY OPTICAL FORMAT (USD MILLION), 2024-2032
      63. TABLE 62 NORTH AMERICA: IMAGE SENSOR MARKET, BY LINEARITY (USD MILLION), 2024-2032
      64. TABLE 63 NORTH AMERICA: IMAGE SENSOR MARKET, BY LINEAR MARKET (USD MILLION), 2024-2032
      65. TABLE 64 NORTH AMERICA: IMAGE SENSOR MARKET, BY LINEAR MARKET (USD MILLION), 2024-2032
      66. TABLE 65 NORTH AMERICA: IMAGE SENSOR MARKET, BY NON-LINEAR MARKET (USD MILLION), 2024-2032
      67. TABLE 66 NORTH AMERICA: IMAGE SENSOR MARKET, BY SPECTRUM, 2024-2032 (USD MILLION)
      68. TABLE 67 NORTH AMERICA: IMAGE SENSOR MARKET, BY SPECTRUM, 2024-2032 (USD MILLION)
      69. TABLE 68 NORTH AMERICA: IMAGE SENSOR MARKET, BY APPLICATION, 2024-2032 (USD MILLION)
      70. TABLE 69 NORTH AMERICA: IMAGE SENSOR MARKET, BY APPLICATION SUB-SEGMENT, BY SURVEILLANCE 2024-2032 (USD MILLION)
      71. TABLE 70 NORTH AMERICA: IMAGE SENSOR MARKET, BY MEDICAL, 2024-2032 (USD MILLION)
      72. TABLE 71 NORTH AMERICA: IMAGE SENSOR MARKET, BY OTHERS,2024-2032 (USD MILLION)
      73. TABLE 72 EUROPE: IMAGE SENSOR MARKET, BY COUNTRY, 2024-2032 (USD MILLION)
      74. TABLE 73 EUROPE: IMAGE SENSOR MARKET, BY TECHNOLOGY, 2024-2032 (USD MILLION)
      75. TABLE 74 EUROPE: IMAGE SENSOR MARKET, BY TYPE, 2024-2032 (USD MILLION)
      76. TABLE 75 EUROPE: IMAGE SENSOR MARKET, BY OPTICAL FORMAT,2024-2032 (USD MILLION)
      77. TABLE 76 EUROPE: IMAGE SENSOR MARKET, BY LINEARITY, 2024-2032 (USD MILLION)
      78. TABLE 77 EUROPE: IMAGE SENSOR MARKET, BY LINEAR, 2024-2032 (USD MILLION)
      79. TABLE 78 EUROPE: IMAGE SENSOR MARKET, BY NON-LINEAR, 2024-2032 (USD MILLION)
      80. TABLE 79 EUROPE: IMAGE SENSOR MARKET, BY SPECTRUM, 2024-2032 (USD MILLION)
      81. TABLE 80 EUROPE: IMAGE SENSOR MARKET, BY APPLICATION, 2024-2032 (USD MILLION)
      82. TABLE 81 EUROPE: IMAGE SENSOR MARKET, BY APPLICATION SUB-SEGMENT, BY SURVEILLANCE 2024-2032 (USD MILLION)
      83. TABLE 82 EUROPE: IMAGE SENSOR MARKET, BY APPLICATION SUB-SEGMENT, BY MEDICAL 2024-2032 (USD MILLION)
      84. TABLE 83 EUROPE: IMAGE SENSOR MARKET, BY APPLICATION SUB-SEGMENT, BY OTHERS 2024-2032 (USD MILLION)
      85. TABLE 84 ASIA-PACIFIC: IMAGE SENSOR MARKET, BY COUNTRY,2024-2032 (USD MILLION)
      86. TABLE 85 ASIA-PACIFIC: IMAGE SENSOR MARKET, BY TECHNOLOGY, 2024-2032 (USD MILLION)
      87. TABLE 86 ASIA-PACIFIC: IMAGE SENSOR MARKET, BY TYPE,2024-2032 (USD MILLION)
      88. TABLE 87 ASIA-PACIFIC: IMAGE SENSOR MARKET, BY OPTICAL FORMAT,2024-2032 (USD MILLION)
      89. TABLE 88 ASIA-PACIFIC: IMAGE SENSOR MARKET, BY LINEARITY,2024-2032 (USD MILLION)
      90. TABLE 89 ASIA-PACIFIC: IMAGE SENSOR MARKET, BY LINEAR, 2024-2032 (USD MILLION)
      91. TABLE 90 ASIA-PACIFIC: IMAGE SENSOR MARKET, BY NON-LINEAR, 2024-2032 (USD MILLION)
      92. TABLE 91 ASIA-PACIFIC: IMAGE SENSOR MARKET, BY SPECTRUM, 2024-2032 (USD MILLION)
      93. TABLE 92 ASIA-PACIFIC: IMAGE SENSOR MARKET, BY APPLICATION,2024-2032 (USD MILLION)
      94. TABLE 93 ASIA-PACIFIC: IMAGE SENSOR MARKET, BY APPLICATION SUB-SEGMENT, BY SURVEILLANCE 2024-2032 (USD MILLION)
      95. TABLE 94 ASIA-PACIFIC IMAGE SENSOR MARKET, BY APPLICATION SUB-SEGMENT, BY MEDICAL, 2024-2032 (USD MILLION)
      96. TABLE 95 ASIA-PACIFIC IMAGE SENSOR MARKET, BY APPLICATION SUB-SEGMENT, BY OTHERS, 2024-2032 (USD MILLION)
      97. TABLE 96 ROW: IMAGE SENSOR MARKET, BY TECHNOLOGY, 2024-2032 (USD MILLION)
      98. TABLE 97 ROW: IMAGE SENSOR MARKET, BY TYPE,2024-2032 (USD MILLION)
      99. TABLE 98 ROW: IMAGE SENSOR MARKET, BY OPTICAL FORMAT, 2024-2032 (USD MILLION)
      100. TABLE 99 ROW: IMAGE SENSOR MARKET, BY LINEARITY, 2024-2032 (USD MILLION)
      101. TABLE 100 ROW: IMAGE SENSOR MARKET, BY LINEAR,2024-2032 (USD MILLION)
      102. TABLE 101 ROW: IMAGE SENSOR MARKET, BY NON-LINEAR,2024-2032 (USD MILLION)
      103. TABLE 102 ROW: IMAGE SENSOR MARKET, BY SPECTRUM,2024-2032 (USD MILLION)
      104. TABLE 103 ROW: IMAGE SENSOR MARKET, BY APPLICATION, 2024-2032 (USD MILLION)
      105. TABLE 104 ROW: IMAGE SENSOR MARKET, BY APPLICATION SUB-SEGMENT, BY SURVEILLANE 2024-2032 (USD MILLION)
      106. TABLE 105 ROW: IMAGE SENSOR MARKET, BY APPLICATION SUB-SEGMENT, BY MEDICAL 2024-2032 (USD MILLION)
      107. TABLE 106 ROW: IMAGE SENSOR MARKET, BY APPLICATION SUB-SEGMENT, BY OTHERS 2024-2032 (USD MILLION) List of Figures
      108. FIGURE 1 MRFR RESEARH PROCESS
      109. FIGURE 2 FORECAST MODEL
      110. FIGURE 3 GLOBAL IMAGE SENSOR MARKET: DRIVERS & CHALLENGES
      111. FIGURE 4 GLOBAL IMAGE SENSOR MARKET SUPPLY CHAIN
      112. FIGURE 5 GLOBAL IMAGE SENSOR MARKET: PORTER’S FIVE FORCES ANALYSIS
      113. FIGURE 6 GLOBAL IMAGE SENSOR MARKET BY TECHNOLOGY, 2024-2032 (USD MILLION)
      114. FIGURE 7 GLOBAL IMAGE SENSOR MARKET OF CMOS SEGMENT BY REGION, 2024-2032 (USD MILLION)
      115. FIGURE 8 GLOBAL IMAGE SENSOR MARKET OF SUB-SEGMENT BY TYPE, 2024-2032 (USD MILLION)
      116. FIGURE 9 GLOBAL IMAGE SENSOR MARKET OF FRONT SIDE ILLUMINATION SEGMENT, BY REGION 2024-2032 (USD MILLION)
      117. FIGURE 10 GLOBAL IMAGE SENSOR MARKET OF BACK SIDE ILLUMINATION SEGMENT, BY REGION, 2024-2032 (USD MILLION)
      118. FIGURE 11 GLOBAL IMAGE SENSOR MARKET OF OTHERS SEGMENT, BY REGION, 2024-2032 (USD MILLION)
      119. FIGURE 12 GLOBAL IMAGE SENSOR MARKET OF CCD SEGMENT, BY REGION 2024-2032 (USD MILLION)
      120. FIGURE 13 GLOBAL IMAGE SENSOR MARKET OF SCMOS SEGMENT BY REGION, 2024-2032 (USD MILLION)
      121. FIGURE 14 GLOBAL IMAGE SENSOR MARKET OF OTHERS SEGMENT BY REGION, 2024-2032 (USD MILLION)
      122. FIGURE 15 GLOBAL IMAGE SENSOR MARKET, BY FORMAT SEGMENT, 2024-2032 (USD MILLION)
      123. FIGURE 16 GLOBAL IMAGE SENSOR MARKET, BY 1/10 TO 1/6 INCH IMAGE SENSOR SEGMENT, 2024-2032 (USD MILLION)
      124. FIGURE 17 GLOBAL IMAGE SENSOR MARKET OF 1/5.9 TO 1/4 INCH IMAGE SENSOR SEGMENT BY REGION, 2024-2032 (USD MILLION)
      125. FIGURE 18 GLOBAL IMAGE SENSOR MARKET OF 1/3.9 TO 1/2 INCH IMAGE SENSOR SEGMENT BY REGION, 2024-2032 (USD MILLION)
      126. FIGURE 19 GLOBAL IMAGE SENSOR MARKET OF 1/3.9 TO 1/2 INCH IMAGE SENSOR SEGMENT BY REGION, 2024-2032 (USD MILLION)
      127. FIGURE 20 GLOBAL IMAGE SENSOR MARKET OF 1/1.9 TO 1 INCH IMAGE SENSOR SEGMENT BY REGION, 2024-2032 (USD MILLION)
      128. FIGURE 21 GLOBAL IMAGE SENSOR MARKET, BY LINEARITY,2024-2032 (USD MILLION)
      129. FIGURE 22 GLOBAL IMAGE SENSOR MARKET BY LINEAR, BY REGION - FORECAST 2024 - 2032 (USD MILLION)
      130. FIGURE 23 GLOBAL IMAGE SENSOR MARKET BY LINEAR SUB-SEGMENT- FORECAST 2024 - 2032 (USD MILLION)
      131. FIGURE 24 GLOBAL IMAGE SENSOR MARKET BY 2D PROCESSING, BY REGION - FORECAST 2024 - 2032 (USD MILLION)
      132. FIGURE 25 GLOBAL IMAGE SENSOR MARKET BY 3D PROCESSING, BY REGION - FORECAST 2024 - 2032 (USD MILLION)
      133. FIGURE 26 GLOBAL IMAGE SENSOR MARKET BY NON-LINEAR, BY REGION - FORECAST 2024 - 2032 (USD MILLION)
      134. FIGURE 27 GLOBAL IMAGE SENSOR MARKET BY NON-LINEAR SUB-SEGMENT- FORECAST 2024 - 2032 (USD MILLION)
      135. FIGURE 28 GLOBAL IMAGE SENSOR MARKET BY 2D PROCESSING, BY REGION- FORECAST 2024 - 2032 (USD MILLION)
      136. FIGURE 29 GLOBAL IMAGE SENSOR MARKET BY 3D PROCESSING, BY REGION- FORECAST 2024 - 2032 (USD MILLION)
      137. FIGURE 30 GLOBAL IMAGE SENSOR MARKET BY SPECTRUM, BY REGION - FORECAST 2024 - 2032 (USD MILLION)
      138. FIGURE 31 GLOBAL IMAGE SENSOR MARKET BY VISIBLE SPECTRUM, BY REGION - FORECAST 2024 - 2032 (USD MILLION)
      139. FIGURE 32 GLOBAL IMAGE SENSOR MARKET BY INVISIBLE SPECTRUM, BY REGION - FORECAST 2024 - 2032 (USD MILLION)
      140. FIGURE 33 GLOBAL IMAGE SENSOR MARKET BY APPLICATION- FORECAST 2024 - 2032 (USD MILLION)
      141. FIGURE 34 GLOBAL IMAGE SENSOR MARKET BY CONSUMER ELECTRONICS, BY REGION 2024 - 2032 (USD MILLION)
      142. FIGURE 35 GLOBAL IMAGE SENSOR MARKET BY AUTOMOBILE, BY REGION 2024 - 2032 (USD MILLION)
      143. FIGURE 36 GLOBAL IMAGE SENSOR MARKET BY SURVEILLANCE, BY REGION 2024 - 2032 (USD MILLION)
      144. FIGURE 37 GLOBAL IMAGE SENSOR MARKET BY TYPE, BY REGION 2024 - 2032 (USD MILLION)
      145. FIGURE 38 GLOBAL IMAGE SENSOR MARKET BY COMMERCIAL SECURITY, BY REGION 2024 - 2032 (USD MILLION)
      146. FIGURE 39 GLOBAL IMAGE SENSOR MARKET BY NIGHT SURVEILLANCE, BY REGION 2024 - 2032 (USD MILLION)
      147. FIGURE 40 GLOBAL IMAGE SENSOR MARKET BY BORDER SECURITY, BY REGION 2024 - 2032 (USD MILLION)
      148. FIGURE 41 GLOBAL IMAGE SENSOR MARKET BY DRONES, BY REGION 2024 - 2032 (USD MILLION)
      149. FIGURE 42 GLOBAL IMAGE SENSOR MARKET BY HOME SECURITY, BY REGION 2024 - 2032 (USD MILLION)
      150. FIGURE 43 GLOBAL IMAGE SENSOR MARKET BY MEDICAL, BY REGION 2024 - 2032 (USD MILLION)
      151. FIGURE 44 GLOBAL IMAGE SENSOR MARKET BY MEDICAL SUB-SEGMENT, BY TYPE 2024 - 2032 (USD MILLION)
      152. FIGURE 45 GLOBAL IMAGE SENSOR MARKET BY ENDOSCOPY, BY REGION 2024 - 2032 (USD MILLION)
      153. FIGURE 46 GLOBAL IMAGE SENSOR MARKET BY SURGERY, BY REGION 2024 - 2032 (USD MILLION)
      154. FIGURE 47 GLOBAL IMAGE SENSOR MARKET BY DENTAL, BY REGION 2024 - 2032 (USD MILLION)
      155. FIGURE 48 GLOBAL IMAGE SENSOR MARKET BY DERMATOLOGY, BY REGION 2024 - 2032 (USD MILLION)
      156. FIGURE 49 GLOBAL IMAGE SENSOR MARKET BY OTHERS, BY REGION 2024 - 2032 (USD MILLION)
      157. FIGURE 50 GLOBAL IMAGE SENSOR MARKET BY OTHERS SUB-SEGMENT, BY TYPE 2024 - 2032 (USD MILLION)
      158. FIGURE 51 GLOBAL IMAGE SENSOR MARKET BY VIRTUAL REALITY IN GAMING DEVICES, BY REGION 2024 - 2032 (USD MILLION)
      159. FIGURE 52 GLOBAL IMAGE SENSOR MARKET BY AEROSPACE, BY REGION 2024 - 2032 (USD MILLION)
      160. FIGURE 53 GLOBAL IMAGE SENSOR MARKET BY BARCODE SCANNING, BY REGION 2024 - 2032 (USD MILLION)
      161. FIGURE 54 GLOBAL IMAGE SENSOR MARKET BY COPIER SCANNING, BY REGION 2024 - 2032 (USD MILLION)
      162. FIGURE 55 GLOBAL IMAGE SENSOR MARKET BY IMAGE SCANNING, BY REGION 2024 - 2032 (USD MILLION)
      163. FIGURE 56 GLOBAL IMAGE SENSOR MARKET BY BANKNOTE RECOGNITION SYSTEM, BY REGION 2024 - 2032 (USD MILLION)
      164. FIGURE 57 GLOBAL IMAGE SENSOR MARKET BY BANKNOTE RECOGNITION SYSTEM, BY REGION, 2024 - 2032 (USD MILLION)
      165. FIGURE 58 GLOBAL IMAGE SENSOR MARKET BY BIOMETRICS, BY REGION 2024 - 2032 (USD MILLION)
      166. FIGURE 59 GLOBAL IMAGE SENSOR MARKET BY MACHINE VISION, BY REGION 2024 - 2032 (USD MILLION)
      167. FIGURE 60 GLOBAL IMAGE SENSOR MARKET BY ITS, BY REGION 2024 - 2032 (USD MILLION)
      168. FIGURE 61 GLOBAL IMAGE SENSOR MARKET BY OTHERS, BY REGION 2024 - 2032 (USD MILLION)
      169. FIGURE 62 GLOBAL IMAGE SENSOR MARKET, BY REGION (USD MILLION), 2024-2032
      170. FIGURE 63 NORTH AMERICA: IMAGE SENSOR MARKET, BY COUNTRY (USD MILLION), 2024-2032
      171. FIGURE 64 NORTH AMERICA: IMAGE SENSOR MARKET, BY TECHNOLOGY (USD MILLION), 2024-2032
      172. FIGURE 65 NORTH AMERICA: IMAGE SENSOR MARKET, BY TYPE (USD MILLION), 2024-2032
      173. FIGURE 66 NORTH AMERICA: IMAGE SENSOR MARKET, BY OPTICAL FORMAT (USD MILLION), 2024-2032
      174. FIGURE 67 NORTH AMERICA: IMAGE SENSOR MARKET, BY LINEARITY (USD MILLION), 2024-2032
      175. FIGURE 68 NORTH AMERICA: IMAGE SENSOR MARKET, BY NON-LINEAR MARKET (USD MILLION), 2024-2032
      176. FIGURE 69 NORTH AMERICA: IMAGE SENSOR MARKET, BY APPLICATION, 2024-2032 (USD MILLION)
      177. FIGURE 70 NORTH AMERICA: IMAGE SENSOR MARKET, BY APPLICATION SUB-SEGMENT, BY SURVEILLANCE 2024-2032 (USD MILLION)
      178. FIGURE 71 NORTH AMERICA: IMAGE SENSOR MARKET, BY MEDICAL,2024-2032 (USD MILLION)
      179. FIGURE 72 NORTH AMERICA: IMAGE SENSOR MARKET, BY OTHERS,2024-2032 (USD MILLION)
      180. FIGURE 73 EUROPE: IMAGE SENSOR MARKET, BY COUNTRY, 2024-2032 (USD MILLION)
      181. FIGURE 74 EUROPE: IMAGE SENSOR MARKET, BY TECHNOLOGY, 2024-2032 (USD MILLION)
      182. FIGURE 75 EUROPE: IMAGE SENSOR MARKET, BY TYPE ,2024-2032(USD MILLION)
      183. FIGURE 76 EUROPE: IMAGE SENSOR MARKET, BY OPTICAL FORMAT,2024-2032 (USD MILLION)
      184. FIGURE 77 EUROPE: IMAGE SENSOR MARKET, BY LINEARITY, 2024-2032 (USD MILLION)
      185. FIGURE 78 EUROPE: IMAGE SENSOR MARKET, BY LINEAR, 2024-2032 (USD MILLION)
      186. FIGURE 79 EUROPE: IMAGE SENSOR MARKET, BY NON-LINEAR, 2024-2032 (USD MILLION)
      187. FIGURE 80 EUROPE: IMAGE SENSOR MARKET, BY SPECTRUM, 2024-2032 (USD MILLION)
      188. FIGURE 81 EUROPE: IMAGE SENSOR MARKET, BY APPLICATION,2024-2032 (USD MILLION)
      189. FIGURE 82 EUROPE: IMAGE SENSOR MARKET, BY APPLICATION SUB-SEGMENT, BY SURVEILLANCE 2024-2032 (USD MILLION)
      190. FIGURE 83 EUROPE: IMAGE SENSOR MARKET, BY APPLICATION SUB-SEGMENT, BY MEDICAL 2024-2032 (USD MILLION)
      191. FIGURE 84 EUROPE: IMAGE SENSOR MARKET, BY APPLICATION SUB-SEGMENT, BY OTHERS 2024-2032 (USD MILLION)
      192. FIGURE 85 ASIA-PACIFIC: IMAGE SENSOR MARKET, BY COUNTRY,2024-2032 (USD MILLION)
      193. FIGURE 86 ASIA-PACIFIC: IMAGE SENSOR MARKET, BY TECHNOLOGY ,2024-2032 (USD MILLION)
      194. FIGURE 87 ASIA-PACIFIC: IMAGE SENSOR MARKET, BY TYPE,2024-2032 (USD MILLION)
      195. FIGURE 88 ASIA-PACIFIC: IMAGE SENSOR MARKET, BY OPTICAL FORMAT,2024-2032 (USD MILLION)
      196. FIGURE 89 ASIA-PACIFIC: IMAGE SENSOR MARKET, BY LINEARITY, 2024-2032 (USD MILLION)
      197. FIGURE 90 ASIA-PACIFIC: IMAGE SENSOR MARKET, BY LINEAR, 2024-2032 (USD MILLION)
      198. FIGURE 91 ASIA-PACIFIC: IMAGE SENSOR MARKET, BY NON-LINEAR, 2024-2032 (USD MILLION)
      199. FIGURE 92 ASIA-PACIFIC: IMAGE SENSOR MARKET, BY SPECTRUM, 2024-2032 (USD MILLION)
      200. FIGURE 93 ASIA-PACIFIC: IMAGE SENSOR MARKET, BY APPLICATION,2024-2032 (USD MILLION)
      201. FIGURE 94 ASIA-PACIFIC: IMAGE SENSOR MARKET, BY APPLICATION SUB-SEGMENT, BY SURVEILLANCE 2024-2032 (USD MILLION)
      202. FIGURE 95 ASIA-PACIFIC: IMAGE SENSOR MARKET, BY APPLICATION SUB-SEGMENT, BY MEDICAL 2024-2032 (USD MILLION)
      203. FIGURE 96 ASIA-PACIFIC: IMAGE SENSOR MARKET, BY APPLICATION SUB-SEGMENT, BY OTHERS, 2024-2032 (USD MILLION)
      204. FIGURE 97 ROW: IMAGE SENSOR MARKET, BY TECHNOLOGY,2024-2032 (USD MILLION)
      205. FIGURE 98 ROW: IMAGE SENSOR MARKET, BY TYPE, 2024-2032 (USD MILLION)
      206. FIGURE 99 ROW: IMAGE SENSOR MARKET, BY OPTICAL FORMAT,2024-2032 (USD MILLION)
      207. FIGURE 100 ROW: IMAGE SENSOR MARKET, BY LINEARITY,2024-2032 (USD MILLION)
      208. FIGURE 101 ROW: IMAGE SENSOR MARKET, BY LINEAR,2024-2032 (USD MILLION)
      209. FIGURE 102 ROW: IMAGE SENSOR MARKET, BY NON-LINEAR,2024-2032 (USD MILLION)
      210. FIGURE 103 ROW: IMAGE SENSOR MARKET, BY SPECTRUM,2024-2032 (USD MILLION)
      211. FIGURE 104 ROW: IMAGE SENSOR MARKET, BY APPLICATION,2024-2032 (USD MILLION)
      212. FIGURE 105 ROW: IMAGE SENSOR MARKET, BY APPLICATION SUB-SEGMENT, BY SURVEILLANE 2024-2032 (USD MILLION)
      213. FIGURE 106 ROW: IMAGE SENSOR MARKET, BY APPLICATION SUB-SEGMENT, BY MEDICAL 2024-2032 (USD MILLION)
      214. FIGURE 107 ROW: IMAGE SENSOR MARKET, BY APPLICATION SUB-SEGMENT, BY OTHERS 2024-2032 (USD MILLION)
      215. FIGURE 108 GLOBAL IMAGE SENSOR KEY PLAYERS MARKET SHARE, 2020 (%)

    Image Sensor Market Segmentation

    Image Sensor Technology Outlook (USD Billion, 2018-2032)

    sCMOS

    CCD

    CMOS

    Image Sensor by Optical Format Outlook (USD Billion, 2018-2032)

    Non-Linear

    Linear

    Image Sensor by Spectrum Outlook (USD Billion, 2018-2032)

    Invisible Spectrum

    Visible Spectrum

    Image Sensor Application Outlook (USD Billion, 2018-2032)

    Medical

    Surveillance

    Automobile

    Consumer Electronics

    Others

    Image Sensor Regional Outlook (USD Billion, 2018-2032)

    North America Outlook (USD Billion, 2018-2032)

    North America Image Sensor by Technology

    sCMOS

    CCD

    CMOS

    North America Image Sensor by Optical Format

    Non-Linear

    Linear

    North America Image Sensor by Spectrum

    Invisible Spectrum

    Visible Spectrum

    North America Image Sensor by Application

    Medical

    Surveillance

    Automobile

    Consumer Electronics

    Others

    US Outlook (USD Billion, 2018-2032)

    US Image Sensor by Technology

    sCMOS

    CCD

    CMOS

    US Image Sensor by Optical Format

    Non-Linear

    Linear

    US Image Sensor by Spectrum

    Invisible Spectrum

    Visible Spectrum

    US Image Sensor by Application

    Medical

    Surveillance

    Automobile

    Consumer Electronics

    Others

    CANADA Outlook (USD Billion, 2018-2032)

    CANADA Image Sensor by Technology

    sCMOS

    CCD

    CMOS

    CANADA Image Sensor by Optical Format

    Non-Linear

    Linear

    CANADA Image Sensor by Spectrum

    Invisible Spectrum

    Visible Spectrum

    CANADA Image Sensor by Application

    Medical

    Surveillance

    Automobile

    Consumer Electronics

    Others

    Europe Outlook (USD Billion, 2018-2032)

    Europe Image Sensor by Technology

    sCMOS

    CCD

    CMOS

    Europe Image Sensor by Optical Format

    Non-Linear

    Linear

    Europe Image Sensor by Spectrum

    Invisible Spectrum

    Visible Spectrum

    Europe Image Sensor by Application

    Medical

    Surveillance

    Automobile

    Consumer Electronics

    Others

    Germany Outlook (USD Billion, 2018-2032)

    Germany Image Sensor by Technology

    sCMOS

    CCD

    CMOS

    Germany Image Sensor by Optical Format

    Non-Linear

    Linear

    Germany Image Sensor by Spectrum

    Invisible Spectrum

    Visible Spectrum

    Germany Image Sensor by Application

    Medical

    Surveillance

    Automobile

    Consumer Electronics

    Others

    France Outlook (USD Billion, 2018-2032)

    France Image Sensor by Technology

    sCMOS

    CCD

    CMOS

    France Image Sensor by Optical Format

    Non-Linear

    Linear

    France Image Sensor by Spectrum

    Invisible Spectrum

    Visible Spectrum

    France Image Sensor by Application

    Medical

    Surveillance

    Automobile

    Consumer Electronics

    Others

    UK Outlook (USD Billion, 2018-2032)

    UK Image Sensor by Technology

    sCMO

    CCD

    CMOS

    UK Image Sensor by Optical Format

    Non-Linear

    Linear

    UK Image Sensor by Spectrum

    Invisible Spectrum

    Visible Spectrum

    UK Image Sensor by Application

    Medical

    Surveillance

    Automobile

    Consumer

    Electronics

    Others

    ITALY Outlook (USD Billion, 2018-2032)

    ITALY Image Sensor by Technology

    sCMOS

    CCD

    CMOS

    ITALY Image Sensor by Optical Format

    Non-Linear

    Linear

    ITALY Image Sensor by Spectrum

    Invisible Spectrum

    Visible Spectrum

    ITALY Image Sensor by Application

    Medical

    Surveillance

    Automobile

    Consumer Electronics

    Others

    SPAIN Outlook (USD Billion, 2018-2032)

    Spain Image Sensor by Technology

    sCMOS

    CCD

    CMOS

    Spain Image Sensor by Optical Format

    Non-Linear

    Linear

    Spain Image Sensor by Spectrum

    Invisible Spectrum

    Visible Spectrum

    Spain Image Sensor by Application

    Medical

    Surveillance

    Automobile

    Consumer Electronics

    Others

    Rest Of Europe Outlook (USD Billion, 2018-2032)

    Rest Of Europe Image Sensor by Technology

    sCMOS

    CCD

    CMOS

    REST OF EUROPE Image Sensor by Optical Format

    Non-Linear

    Linear

    REST OF EUROPE Image Sensor by Spectrum

    Invisible Spectrum

    Visible Spectrum

    REST OF EUROPE Image Sensor by Application

    Medical

    Surveillance

    Automobile

    Consumer Electronics

    Others

    Asia-Pacific Outlook (USD Billion, 2018-2032)

    Asia-Pacific Image Sensor by Technology

    sCMOS

    CCD

    CMOS

    Asia-Pacific Image Sensor by Optical Format

    Non-Linear

    Linear

    Asia-Pacific Image Sensor by Spectrum

    Invisible Spectrum

    Visible Spectrum

    Asia-Pacific Image Sensor by Application

    Medical

    Surveillance

    Automobile

    Consumer Electronics

    Others

    China Outlook (USD Billion, 2018-2032)

    China Image Sensor by Technology

    sCMOS

    CCD

    CMOS

    China Image Sensor by Optical Format

    Non-Linear

    Linear

    China Image Sensor by Spectrum

    Invisible Spectrum

    Visible Spectrum

    China Image Sensor by Application

    Medical

    Surveillance

    Automobile

    Consumer Electronics

    Others

    Japan Outlook (USD Billion, 2018-2032)

    Japan Image Sensor by Technology

    sCMOS

    CCD

    CMOS

    Japan Image Sensor by Optical Format

    Non-Linear

    Linear

    Japan Image Sensor by Spectrum

    Invisible Spectrum

    Visible Spectrum

    Japan Image Sensor by Application

    Medical

    Surveillance

    Automobile

    Consumer Electronics

    Others

    India Outlook (USD Billion, 2018-2032)

    India Image Sensor by Technology

    sCMOS

    CCD

    CMOS

    India Image Sensor by Optical Format

    Non-Linear

    Linear

    India Image Sensor by Spectrum

    Invisible Spectrum

    Visible Spectrum

    India Image Sensor by Application

    Medical

    Surveillance

    Automobile

    Consumer Electronics

    Others

    Australia Outlook (USD Billion, 2018-2032)

    Australia Image Sensor by Technology

    sCMOS

    CCD

    CMOS

    Australia Image Sensor by Optical Format

    Non-Linear

    Linear

    Australia Image Sensor by Spectrum

    Invisible Spectrum

    Visible Spectrum

    Australia Image Sensor by Application

    Medical

    Surveillance

    Automobile

    Consumer Electronics

    Others

    Rest of Asia-Pacific Outlook (USD Billion, 2018-2032)

    Rest of Asia-Pacific Image Sensor by Technology

    sCMOS

    CCD

    CMOS

    Rest of Asia-Pacific Image Sensor by Optical Format

    Non-Linear

    Linear

    Rest of Asia-Pacific Image Sensor by Spectrum

    Invisible Spectrum

    Visible Spectrum

    Rest of Asia-Pacific Image Sensor by Application

    Medical

    Surveillance

    Automobile

    Consumer Electronics

    Others

    Rest of the World Outlook (USD Billion, 2018-2032)

    Rest of the World Image Sensor by Technology

    sCMOS

    CCD

    CMOS

    Rest of the World Image Sensor by Optical Format

    Non-Linear

    Linear

    Rest of the World Image Sensor by Spectrum

    Invisible Spectrum

    Visible Spectrum

    Rest of the World Image Sensor by Application

    Medical

    Surveillance

    Automobile

    Consumer Electronics

    Others

    Middle East Outlook (USD Billion, 2018-2032)

    Middle East Image Sensor by Technology

    sCMOS

    CCD

    CMOS

    Middle East Image Sensor by Optical Format

    Non-Linear

    Linear

    Middle East Image Sensor by Spectrum

    Invisible Spectrum

    Visible Spectrum

    Middle East Image Sensor by Application

    Medical

    Surveillance

    Automobile

    Consumer Electronics

    Others

    Africa Outlook (USD Billion, 2018-2032)

    Africa Image Sensor by Technology

    sCMOS

    CCD

    CMOS

    Africa Image Sensor by Optical Format

    Non-Linear

    Linear

    Africa Image Sensor by Spectrum

    Invisible Spectrum

    Visible Spectrum

    Africa Image Sensor by Application

    Medical

    Surveillance

    Automobile

    Consumer Electronics

    Others

    Latin America Outlook (USD Billion, 2018-2032)

    Latin America Image Sensor by Technology

    sCMOS

    CCD

    CMOS

    Latin America Image Sensor by Optical Format

    Non-Linear

    Linear

    Latin America Image Sensor by Spectrum

    Invisible Spectrum

    Visible Spectrum

    Latin America Image Sensor by Application

    Medical

    Surveillance

    Automobile

    Consumer Electronics

    Others

    Infographic

    Free Sample Request

    Kindly complete the form below to receive a free sample of this Report

    Get Free Sample

    Customer Strories

    “I am very pleased with how market segments have been defined in a relevant way for my purposes (such as "Portable Freezers & refrigerators" and "last-mile"). In general the report is well structured. Thanks very much for your efforts.”

    Victoria Milne

    Founder
    Case Study
    Chemicals and Materials