India Dry Age Related Macular Degeneration (AMD) Market Segmentation
India Dry Age Related Macular Degeneration (AMD) Market By Stages (USD Million, 2025-2035)
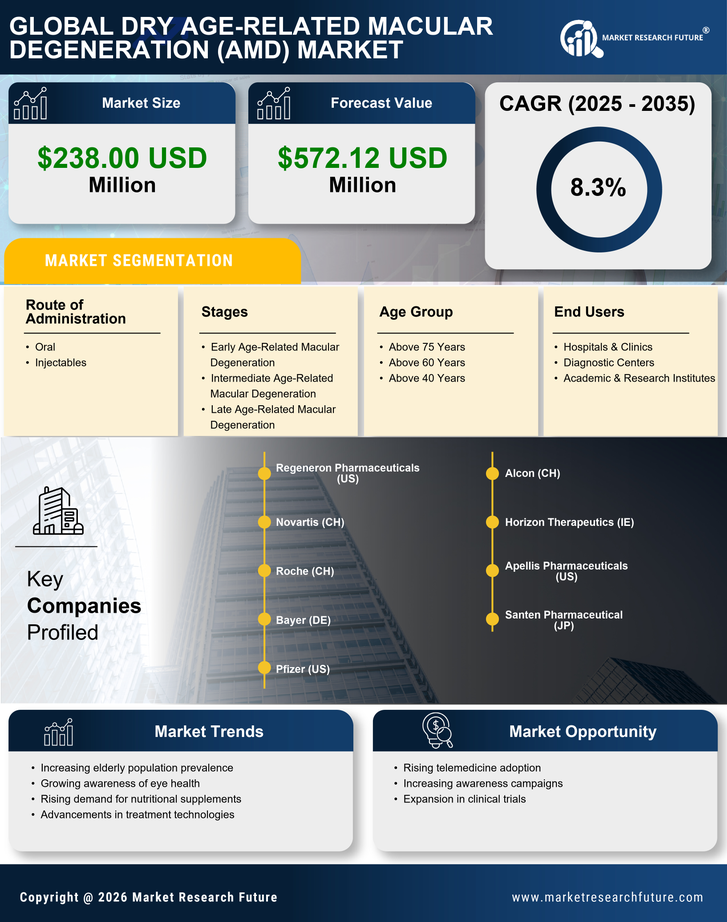
- Early Age-Related Macular Degeneration
- Intermediate Age-Related Macular Degeneration
- Late Age-Related Macular Degeneration
India Dry Age Related Macular Degeneration (AMD) Market By Age Group (USD Million, 2025-2035)
- Above 75 Years
- Above 60 Years
- Above 40 Years
India Dry Age Related Macular Degeneration (AMD) Market By Route of Administration (USD Million, 2025-2035)
- Oral
- Injectables
India Dry Age Related Macular Degeneration (AMD) Market By End Users (USD Million, 2025-2035)
- Hospitals & Clinics
- Diagnostic Centers
- Academic & Research Institutes