India India Remotely Operated Vehicle Market Segmentation
India Remotely Operated Vehicle Market By Product Type (USD Million, 2025-2035)
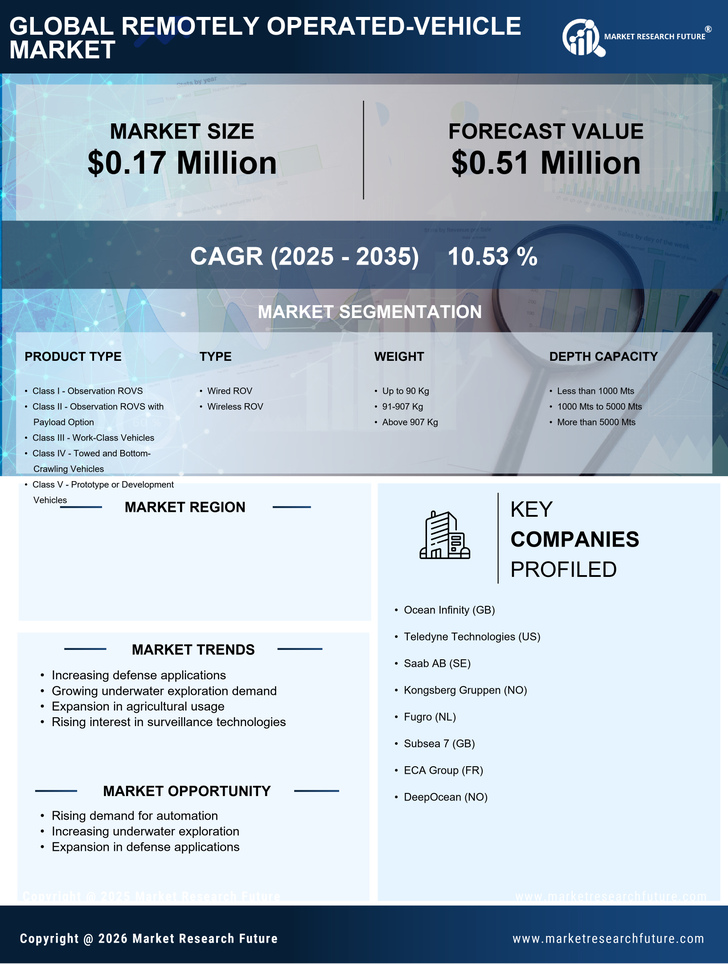
- Class I - Observation ROVS
- Class II - Observation ROVS with Payload Option
- Class III - Work-Class Vehicles
- Class IV - Towed and Bottom-Crawling Vehicles
- Class V - Prototype or Development Vehicles
India Remotely Operated Vehicle Market By Type (USD Million, 2025-2035)
- Wired ROV
- Wireless ROV
India Remotely Operated Vehicle Market By Weight (USD Million, 2025-2035)
- Up to 90 Kg
- 91-907 Kg
- Above 907 Kg
India Remotely Operated Vehicle Market By Depth Capacity (USD Million, 2025-2035)
- Less than 1000 Mts
- 1000 Mts to 5000 Mts
- More than 5000 Mts
India Remotely Operated Vehicle Market By Application (USD Million, 2025-2035)
- Oil & Gas
- Defense & Security
- Scientific & Academic Research
- Others