Industrial Air Filtration Market (2026 - 2035)

Industrial Air Filtration Market Research Report By Product Type (Dust Collection Filters, Bag / Pocket Filters, Cartridge Filters, HEPA Filters, Panel Filters, ULPA and Specialty Products), By Filter Media (Synthetic Polymer Media, Nonwoven Fabric, Cellulose and Blended Paper Media, Glass Fiber Media, Nanofiber-Coated Media, Metal and Ceramic Media), By Filtration Technology (Mechanical Filtration, Fabric Filtration, Electrostatic Precipitation, Cartridge and Cyclone Filtration, Adsorption-Based Filtration, Membrane and Nanofiber Filtration), By End-Use Industry (Chemical and Petrochemical, Cement and Construction Materials, Metals and Metallurgy, Power Generation, Food and Beverage, Automotive and Transportation Equipment, Pharmaceutical and Biotechnology, Pulp, Paper and Wood, Mining and Aggregates, Other Industries) and By Regional (North America, Europe, South America, Asia Pacific, Middle East and Africa) - Forecast to 2035
ID: MRFR/Equip/29297-CR
152 Pages
Snehal Singh
Last Updated: August 27, 2026
Industrial Air Filtration Market
Market Size
Forecast Period2026-2035
CAGR (2026-2035)5.42%
2025 Market SizeUSD 17.15 Billion
2035 Market SizeUSD 29.09 Billion
Key Players
Camfil
Parker Hannifin
MANN+HUMMEL
Freudenberg Filtration Technologies
AAF International
Alfa Laval
Opportunities
  • Filtration-as-a-Service Contracts
  • Data Monetisation From Instrumented Collectors
  • Emerging Market Standardisation

Industrial Air Filtration Market Summary

The Industrial Air Filtration Market reached USD 17.15 Billion in 2025 and opens the forecast window at USD 18.08 Billion in 2026, climbing to USD 29.09 Billion by 2035 at a 5.42% CAGR. Compliance spending anchors the trajectory. Two catalysts dominate: the recast of the EU Industrial Emissions Directive under Directive (EU) 2024/1785, which widens permitted-installation coverage across metals and intensive livestock processing [3], and the US EPA's 2024 tightening of the annual PM2.5 standard to 9.0 µg/m³, which forces state permit writers to revisit fugitive and stack emission limits at thousands of facilities [2]. Filtration in these settings is not discretionary capital — it is a licence to operate.

Equipment itself is changing. Bolt-on baghouses sized on a rule-of-thumb air-to-cloth ratio are giving way to instrumented collectors with differential-pressure telemetry, pulse-cleaning optimisation, and media life prediction. Plants that once replaced bags on a calendar are now replacing them on a signal. The IEA estimates industrial energy efficiency investment exceeded USD 90 billion annually in heavy manufacturing, and fan power reduction from low-pressure-drop media is an increasingly common line item in those budgets [9].

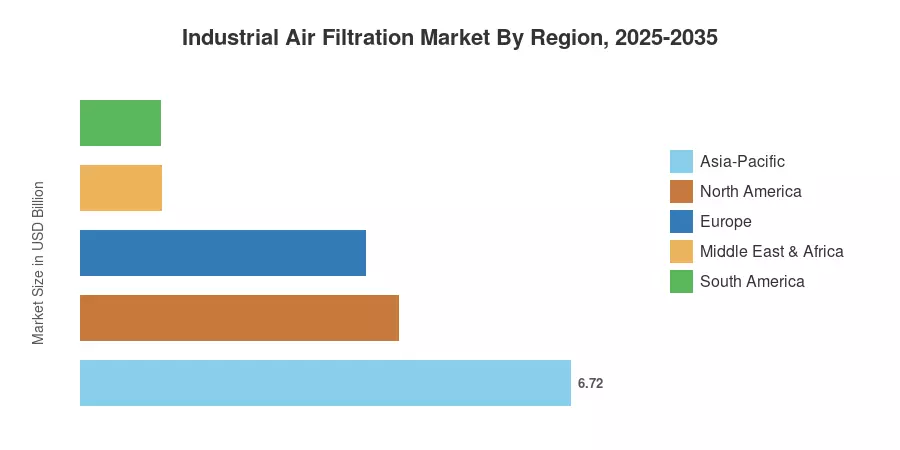
Geographically, Asia-Pacific holds 39.2% of 2025 value and is also the fastest-expanding region at a 6.55% CAGR, driven by China's ultra-low emission retrofit programme for steel and India's revised cement plant limits [11][12]. North America follows at 25.4%, where enforcement intensity rather than new capacity sustains demand. Europe ranks third on volume but leads on specification stringency — and that specification premium is what will reshape the regional hierarchy of the Industrial Air Filtration Market over the next decade.


Key Report Takeaways

• By Product Type

  • Dust collection filters held 30.4% of the Industrial Air Filtration Market in 2025, reflecting entrenched demand across cement, metals, and woodworking.
  • HEPA-class products are the growth leader, advancing at a 6.6% CAGR through 2035 on sterile manufacturing buildout.
  • Cartridge filters generated USD 2.74 billion in 2025 as compact footprints displaced legacy shaker units.

• By End User Industry

  • Chemical and petrochemical remained the largest end-use at 13.8% share, sustained by VOC and acid-gas permit conditions.
  • Pharmaceutical and biotechnology posts the steepest sector CAGR at 8.9%, tracking Annex 1 cleanroom requalification.
  • Power generation accounted for USD 1.99 billion in 2025, weighted toward coal fleet retrofit rather than new build.

• By Region

  • Asia-Pacific commanded 39.2% of the Industrial Air Filtration Market in 2025.
  • South America is the second-fastest region at a 6.40% CAGR, led by Brazilian mining and pulp investment.
  • Middle East and Africa contributed USD 1.11 billion, concentrated in Gulf petrochemical complexes.


Industrial Air Filtration Market Size and Forecast (2021–2035)

Historical values were reconstructed from equipment shipment data, replacement-media consumption estimates, and revenue disclosures in filtration-segment reporting from listed suppliers [20][21][22]. Forecast values apply sector-weighted capacity and compliance-cycle modelling, cross-checked against permitted-installation counts published by environmental regulators in the ten largest industrial economies.
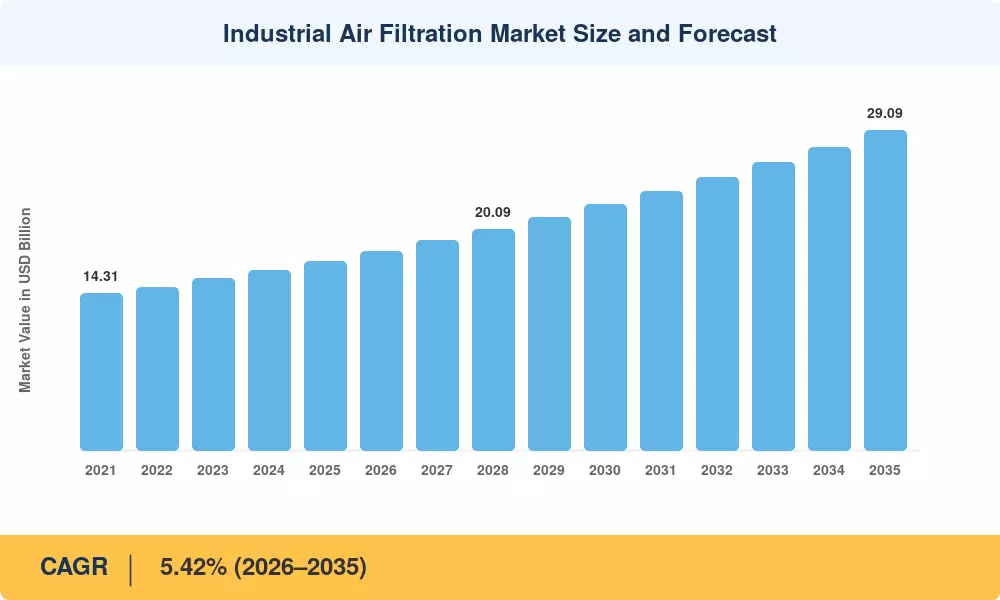
Industrial Air Filtration Market Size and Forecast
Our Impact
Enabled $4.3B Revenue Impact for Fortune 500 and Leading Multinationals
Partnering with 2000+ Global Organizations Each Year
30K+ Citations by Top-Tier Firms in the Industry

Driver Impact Analysis

Impact weightings below are directional analyst judgements expressing each driver's relative contribution to growth momentum in the Industrial Air Filtration Market. They are not additive to the headline CAGR and should not be summed.

Driver ~% Impact on CAGR Geographic Relevance Impact Timeline
Tightening particulate and HAP emission limits +1.15 pp Global Short-term (≤2 yr)
Heavy industry capacity additions +0.95 pp Asia-Pacific, MEA Medium-term (2–4 yr)
Sterile and biologics cleanroom buildout +0.70 pp NA, Europe, APAC Medium-term (2–4 yr)
Replacement media and service attach rates +0.62 pp Global Short-term (≤2 yr)
Sensor-enabled condition monitoring +0.48 pp NA, Europe Long-term (≥4 yr)
Worker exposure rulemaking +0.40 pp NA, Europe, Australia Short-term (≤2 yr)
Energy-efficiency-led media upgrades +0.33 pp Europe, Japan Long-term (≥4 yr)


Emission Limits Are Now Permit Conditions, Not Targets

Regulators have changed from ambient standards to installation-specific requirements. Permits should be issued at the tougher end of the BAT-associated emission levels, not the permissive end, a change the European Commission anticipates will affect about 50,000 industrial sites [3]. The 2024 PM2.5 revision in the United States from 12.0 to 9.0 µg/m3 pushes dozens of counties into nonattainment, which cascades into offset requirements for any new or modified source [2]. Neither modification allows for a wait-and-see approach.


Asian Capacity Additions Carry Filtration Content

The ultra-low emission program in China’s steel sector has covered well over 500 million tons of annual crude capacity, calling for particulate limitations of 10 mg/m3 across sintering, pelletizing, and coking [11]. The updated cement regulations of India by the Central Pollution Control Board specify the kiln stack levels of 30 mg/Nm³ for particle matter, which generally requires bag filtration rather than electrostatic devices alone [12]. All of the incremental tons of capacity in these geographies now come with defined filtering content at the design stage.


Aftermarket Economics Reward Installed Base

Filter media is not owned; it is used up. Suppliers with substantial installed bases report that replacement revenue is materially less cyclical than equipment sales. In filtration-segment reports, aftermarket regularly contributes the majority of segment revenue [20][21]. That regular flow funds service networks, which then win the next equipment specification – a compounding advantage smaller regional manufacturers find hard to match.


Occupational Exposure Rules Add a Second Compliance Axis

Stack emissions govern what leaves the plant; exposure rules govern what workers breathe inside it. OSHA's respirable crystalline silica standard caps the permissible exposure limit at 50 µg/m³ over eight hours, and enforcement has extended firmly into foundries and fabrication [6]. NIOSH guidance on welding fume has similarly pushed source-capture extraction into general engineering shops that previously relied on dilution ventilation [7].


Restraints Impact Analysis

Restraint ~% Impact on CAGR Geographic Relevance Impact Timeline
High upfront retrofit capital cost −0.55 pp Global Medium-term (2–4 yr)
Commoditisation of standard media −0.45 pp APAC, Europe Short-term (≤2 yr)
Uneven enforcement in emerging economies −0.35 pp South Asia, Africa Long-term (≥4 yr)
Fan energy penalty from pressure drop −0.30 pp Europe, Japan Medium-term (2–4 yr)
Shortage of qualified installation labour −0.25 pp NA, Europe Long-term (≥4 yr)


Retrofit Capital Competes With Production Investment

Replacing an aging precipitator with a pulse-jet baghouse at a mid-sized cement kiln generally costs in the eight figures, when ductwork, fans, structural steel, and outage time are included. The World Bank environmental guidance notes that abatement retrofits in cement and metals sometimes exceed the annual maintenance budget of the line impacted [13]. Plants wait when enforcement allows postponement, and that deferral is viewed as revenue pushed right for suppliers.


Standard Media Has Become a Price Fight

Dozens of countries competently produce polyester needle felt and pleated cellulose cartridges. Regional producers beat multinational pricing by 25-40% on certain grades, and procurement teams increasingly split awards - branded media for important applications, local media for nuisance dust. In response, suppliers have shifted the significance of the specification to nanofibre surface treatments and performance guarantees proven rather than defending base media cost [22].


Enforcement Gaps Blunt Regulatory Demand

Written standards and enforced standards diverge sharply outside the OECD. WHO air quality guidance notes that a large share of the global population lives where industrial emission monitoring is intermittent or absent [17]. Where inspectors are scarce, filtration purchases revert to voluntary — and voluntary purchases lose to production capex almost every time.


Industrial Air Filtration Market Opportunities

Filtration-as-a-Service Contracts

Suppliers are packaging equipment, media, monitoring, and guaranteed compliance outcomes into multi-year subscriptions billed per operating hour or per cubic metre treated. This converts a lumpy capital decision into an operating expense, which resonates strongly with mid-market plants that lack retrofit capital. For vendors, it locks the aftermarket for the contract duration and materially raises switching costs across the Industrial Air Filtration Market.

Data Monetisation From Instrumented Collectors

Differential-pressure, airflow and cleaning-cycle data streaming from thousands of collectors constitutes a fleet dataset no single plant can generate. Vendors are beginning to sell benchmarking dashboards and predictive change-out scheduling as separate line items, priced per monitored unit. The margin profile of that software attachment sits well above hardware.

Emerging Market Standardisation

Southeast Asian and African regulators are increasingly transposing EU BAT reference documents rather than drafting from scratch, which effectively exports European specification levels into markets with rapidly growing industrial bases [3][19]. Suppliers already qualified to those references face a shortened sales cycle when the rules land.

PFAS-Free Media Requalification

The ECHA restriction proposal on per- and polyfluoroalkyl substances places PTFE membrane laminates under review, and PTFE is ubiquitous in high-temperature and high-efficiency industrial media [18]. Whoever qualifies credible polyimide, PPS or engineered-nanofibre substitutes first will capture a forced re-specification cycle across the entire installed base.

Adjacent High-Purity Sectors

Battery gigafactories, semiconductor fabs and green hydrogen electrolyser plants need dry-room humidity control, molecular contamination removal and high-efficiency particulate capture at industrial scale. These buyers apply cleanroom logic to heavy-industry footprints, which suits suppliers spanning both disciplines.


Industrial Air Filtration Market Future Outlook

Predictive Operation Becomes Table Stakes

Condition-based change-out is moving from pilot to specification. Instrumented collectors that track differential pressure, cleaning frequency, and airflow can typically extend media life 15–25% while avoiding the unplanned outages that calendar-based replacement never fully prevents. By the early 2030s, expect tender documents to require open data protocols as routinely as they now require efficiency classes.

Energy Becomes the Dominant Selection Criterion

Fan power to overcome filter resistance often represents the largest single lifetime cost in an air handling train. IEA analysis of industrial motor systems repeatedly identifies pressure drop reduction as among the cheapest available efficiency measures [9]. As industrial electricity prices stay elevated in Europe and Japan, the Industrial Air Filtration Market will increasingly compete on kilowatt-hours rather than on capture efficiency alone.

Decarbonisation Reshapes the Gas Stream

Hydrogen-fired kilns, electric arc steelmaking and carbon capture retrofits change temperature, moisture and chemistry profiles at the filter face. Carbon capture in particular requires very low particulate loading upstream of the absorber to protect solvent inventory, creating a new and demanding filtration duty that barely existed a decade ago [10].

Disclosure Turns Emissions Into Reported Metrics

Sustainability reporting frameworks are pulling air emissions out of the compliance file and into investor-facing disclosure. European Environment Agency industrial pollution reporting already publishes facility-level data that analysts and NGOs read directly [19]. Once emission performance is a reported number rather than a permit condition, filtration budgets acquire a board-level sponsor.


Industrial Air Filtration Market Segmentation

By Product Type

Product structure across the Industrial Air Filtration Market splits between bulk dust capture and high-efficiency contamination control, with cartridge formats bridging the two.

Segment Metric (2025 unless noted) Primary Demand Driver
Dust Collection Filters 30.4% share Cement, metals, woodworking particulate capture
Bag / Pocket Filters 17.1% share General ventilation and pre-filtration duty
Cartridge Filters USD 2.74 Billion Footprint-constrained retrofits
HEPA Filters 6.6% CAGR (2026–2035) Sterile and high-purity manufacturing
Panel Filters 4.9% CAGR (2026–2035) Air handling unit pre-filtration
ULPA and Specialty Products 10.8% share Semiconductor and biosafety containment


Dust collection remains the revenue backbone because the industries it serves are large, dirty, and permanently regulated. Growth, though, sits at the efficiency end. HEPA-class demand is expanding roughly a full point above the market average as sterile manufacturing capacity multiplies and as adjacent sectors — battery dry rooms, advanced packaging — import cleanroom standards into industrial settings.

By Filter Media

Media choice determines both efficiency and operating cost, making it the most consequential specification decision in the Industrial Air Filtration Market.

Segment Metric (2025 unless noted) Primary Demand Driver
Synthetic Polymer Media 29.6% share Chemical resistance and washability
Nonwoven Fabric USD 3.84 Billion Baghouse and pulse-jet standard construction
Cellulose and Blended Paper Media 18.1% share Cost-sensitive cartridge applications
Glass Fiber Media 14.3% share High-temperature and high-efficiency duty
Nanofiber-Coated Media 7.8% CAGR (2026–2035) Surface loading and lower pressure drop
Metal and Ceramic Media 6.4% share Extreme temperature and cleanable applications


Synthetic polymers hold the largest slice on versatility alone. Nanofibre coatings, though a smaller base, are the segment reshaping economics — by keeping dust on the media surface rather than embedding it in depth, they cut pressure drop and extend cleanable life, which is exactly what energy-conscious European and Japanese buyers now price into tenders [16].

By Filtration Technology

Technology mix in the Industrial Air Filtration Market varies sharply by gas stream temperature, particle size distribution, and whether gaseous contaminants accompany the particulate load.

Segment Metric (2025 unless noted) Primary Demand Driver
Mechanical Filtration 24.4% share Broad applicability across dry particulate
Fabric Filtration 21.6% share Sub-10 mg/m³ compliance in kilns and sinter plants
Electrostatic Precipitation USD 3.14 Billion Large-volume power and cement gas streams
Cartridge and Cyclone Filtration 15.1% share Pre-separation and compact installations
Adsorption-Based Filtration 12.2% share Odour and gaseous contaminant control
Membrane and Nanofiber Filtration 7.2% CAGR (2026–2035) Ultra-low emission and high-purity duty


Fabric filtration is quietly taking share from electrostatic units wherever limits fall below roughly 20 mg/Nm³, because precipitator performance degrades with high-resistivity dust in ways bag systems do not. Adsorption sits alongside rather than against these technologies — a growing number of permits regulate particulate and gaseous species in the same condition, which pushes buyers toward combined trains from a single supplier.

By End-Use Industry

End-use concentration in the Industrial Air Filtration Market is unusually flat, with no sector above 14% — a structural feature that insulates suppliers from single-industry downturns.

Segment Metric (2025 unless noted) Primary Demand Driver
Chemical and Petrochemical 13.8% share VOC and acid gas permit conditions
Cement and Construction Materials 12.9% share Kiln and clinker cooler particulate limits
Metals and Metallurgy USD 2.13 Billion Furnace fume and sinter plant capture
Power Generation 11.6% share Coal fleet retrofit and biomass conversion
Food and Beverage 10.7% share Product protection and combustible dust rules
Automotive and Transportation Equipment 10.1% share Paint shop and welding fume extraction
Pharmaceutical and Biotechnology 8.9% CAGR (2026–2035) Annex 1 sterile manufacturing requirements
Pulp, Paper and Wood 8.3% share Fibrous dust and dryer exhaust
Mining and Aggregates 6.5% share Respirable silica exposure limits
Other Industries 4.3% share Textiles, glass and general engineering


Chemical and petrochemical leads because its permits typically regulate several contaminant classes at once, driving higher equipment content per site. Pharmaceutical demand grows fastest for a regulatory reason rather than a volume one — the revised Annex 1 requires documented contamination control strategies with periodic requalification, which converts a one-time installation into a recurring validation and replacement cycle [5].


Regional Market Share Analysis

Region Metric (2025 unless noted) Primary Investment Themes
Asia-Pacific 39.2% share Steel and cement ultra-low emission retrofit, pharma buildout
North America USD 4.36 Billion Nonattainment permit compliance, silica enforcement
Europe 22.8% share IED recast transposition, energy-efficient media
South America 6.40% CAGR (2026–2035) Mining dust control, pulp and paper expansion
Middle East & Africa USD 1.11 Billion Petrochemical complexes, cement and aluminium
Total USD 17.15 Billion

Regional distribution in the Industrial Air Filtration Market reflects where heavy manufacturing sits, weighted by how strictly it is policed. Asia-Pacific leads on both installed capacity and forward growth; Europe leads on value per installation.


North America

Country Metric Key Driver
US 77.5% of regional value PM2.5 nonattainment designations and NESHAP residual risk reviews
Canada USD 0.51 Billion Oil sands and metallurgical processing emission caps
Mexico 5.9% CAGR (2026–2035) Nearshoring-driven manufacturing capacity additions


Enforcement, not expansion, sustains the North American Industrial Air Filtration Market. The EPA's residual risk and technology reviews under 40 CFR Part 63 continue to reopen source categories that had been settled for a decade, and each reopening produces a wave of engineering studies and equipment upgrades [1]. Mexican demand is a different story entirely — greenfield automotive and electronics plants specify filtration to the parent company's home-market standard rather than the local minimum.

Europe

Country Metric Key Driver
Germany 23.1% of regional value Chemical park emission permits, foundry exposure limits
UK USD 0.49 Billion Environmental permitting regime, pharmaceutical manufacturing
France 12.4% of regional value Cement decarbonisation and waste-to-energy build
Italy 4.6% CAGR (2026–2035) Steel sector modernisation
Spain 7.8% of regional value Ceramics cluster and mineral processing
Nordic Countries USD 0.29 Billion Pulp, paper and battery manufacturing
Russia 2.9% CAGR (2026–2035) Domestic metallurgy, constrained equipment access
Rest of Europe 21.2% of regional value Central European automotive and metals supply chains


European purchasing behaviour differs from every other region: buyers here specify against energy class as aggressively as against efficiency. Eurovent guidance ties filter selection to annual fan energy consumption, and plant engineers routinely model a five-year energy cost that exceeds the media purchase price by a factor of three or more [16]. That calculus favours nanofibre and low-basis-weight synthetic constructions over heavier traditional felts.

Asia-Pacific

Country Metric Key Driver
China 44.8% of regional value Steel and cement ultra-low emission mandates
India USD 1.07 Billion Revised CPCB cement and thermal power limits
Japan 14.2% of regional value Semiconductor and precision manufacturing cleanliness
South Korea 8.1% of regional value Petrochemical and battery plant expansion
ASEAN 11.3% of regional value Electronics assembly and palm processing
Rest of Asia-Pacific 5.7% of regional value Australian mining and mineral processing


Scale explains Asia-Pacific's dominance in the Industrial Air Filtration Market, but policy explains its growth rate. China's ultra-low emission requirement for sintering and pelletising operates at 10 mg/m³ — a level that leaves no realistic path other than fabric filtration or hybrid systems [11]. India's parallel push through revised cement and thermal power standards has created a retrofit pipeline stretching well past 2030 [12]. Both programmes carry inspection regimes with real financial consequences, which is precisely what converts written standards into purchase orders.

South America

Country Metric Key Driver
Brazil 58.4% of regional value Iron ore, pulp and cement dust control
Argentina USD 0.16 Billion Lithium processing and agro-industrial handling
Rest of South America 25.9% of regional value Chilean copper smelting emission limits


Mining anchors the continent's demand. Chilean smelter regulations require capture of a high proportion of sulphur and particulate emissions, a standard that pushed operators toward integrated scrubbing and fabric filtration trains [13]. Brazilian pulp expansion adds a second demand stream with quite different requirements — high-humidity, fibrous loading that punishes conventional cartridge designs.

Middle East & Africa

Country Metric Key Driver
Saudi Arabia 27.3% of regional value Petrochemical complexes and cement capacity
UAE USD 0.21 Billion Aluminium smelting and downstream processing
South Africa 19.4% of regional value Coal power fleet and ferrochrome operations
Egypt 10.2% of regional value Cement clusters and fertiliser plants
Rest of MEA 24.5% of regional value Nigerian and North African industrial buildout


Gulf industrial diversification programmes are writing environmental performance into project charters rather than retrofitting it later, largely because international project finance requires it. World Bank and IFC environmental guidelines function as de facto specification documents for lenders, so filtration scope survives value-engineering exercises that cut elsewhere [13]. South African demand runs on a different logic — an ageing coal fleet operating under repeatedly extended compliance exemptions, where each extension defers rather than removes eventual spending.


Industrial Air Filtration Market By Region, 2025-2035

Competitive Benchmarking

Concentration in the Industrial Air Filtration Market is moderate. The top five suppliers command an estimated 29–33% of global revenue, and the calculated HHI sits near 640–720 — comfortably in unconcentrated territory. Two dynamics explain the structure: multinationals dominate engineered systems and validated high-efficiency media, while hundreds of regional fabricators compete effectively on standard baghouses and commodity replacement elements. Consolidation continues, but it targets application expertise and service density rather than raw capacity.

Company Est. Revenue Share Range Key Offerings for Industrial Air Filtration Market Strategic Positioning
Donaldson Company ~8–11% Cartridge collectors, nanofibre media, aftermarket elements Aftermarket depth and life sciences expansion [20]
Camfil ~6–9% Molecular and particulate filters, cleanroom systems Energy-class leadership in Europe
Parker Hannifin ~5–8% Filtration systems, gas turbine intake, process filtration Cross-portfolio industrial channel [21]
MANN+HUMMEL ~4–7% Industrial dust collection, media, air quality systems Automotive-adjacent scale in media manufacturing
Freudenberg Filtration Technologies ~4–6% Pocket and panel filters, high-efficiency media Materials science and OEM integration
AAF International (Daikin) ~3–6% HEPA and ULPA products, containment housings Cleanroom and containment specialisation
Alfa Laval ~3–5% Gas cleaning systems, marine and process scrubbing Heavy-duty engineered systems [22]
Nederman Holding ~2–4% Extraction systems, monitoring and control software Digital service and source-capture focus [23]
CECO Environmental ~2–4% Baghouses, scrubbers, emission control packages Project-led engineered solutions
Filtration Group ~2–4% Industrial media, dust collection, life sciences filters Roll-up strategy across niche applications
Thermax ~1–3% Electrostatic precipitators, bag filters, gas cleaning India and emerging market cost position


Recent News & Developments

Regulatory action has driven most of the consequential change in the Industrial Air Filtration Market over the past three years.

  • European Union (August 2024): Directive (EU) 2024/1785 entered into force, revising the Industrial Emissions Directive to require permits at the strict end of BAT-associated emission ranges and extending scope to additional installation categories [3]
  • US EPA (February 2024): The agency finalised a revised annual PM2.5 primary standard of 9.0 µg/m³, tightening the prior 12.0 µg/m³ level and expanding nonattainment exposure for industrial sources [2]
  • European Commission (August 2023): The revised EudraLex Annex 1 became applicable, requiring formal contamination control strategies and periodic requalification of sterile manufacturing air systems [5]


  • Ministry of Ecology and Environment, China (2023–2025): Ultra-low emission retrofit verification continued across the steel sector, with published performance requirements at 10 mg/m³ for particulate across sintering and pelletising [11]
  • Central Pollution Control Board, India (2023–2024): Revised emission standards for cement plants and thermal power units sustained a multi-year retrofit pipeline for bag filtration and precipitator upgrades [12]
  • Donaldson Company (FY2024): The company reported continued expansion of its Life Sciences segment alongside its industrial filtration business, reflecting a deliberate shift toward higher-margin validated applications [20]
  • Nederman Holding (2024): The group continued to position digital monitoring and service offerings as a distinct revenue line alongside extraction equipment sales [23]


Industrial Air Filtration Market Report Scope

Parameter Detail
Market Scope Global Industrial Air Filtration Market by product type, filter media, filtration technology, end-use industry and Region
Study Period 2021–2035 (Historical 2021–2024; Base Year 2025; Forecast 2026–2035)
CAGR 5.42% (2026–2035)
Market Size Checkpoints USD 17.15 Billion (2025); USD 18.08 Billion (2026); USD 29.09 Billion (2035)
Fastest Growing Segments HEPA filters (product); nanofibre-coated media (media); membrane and nanofibre filtration (technology); pharmaceutical and biotechnology (end use)
Companies Profiled 11 major suppliers benchmarked by revenue share range, offerings, and strategic positioning
Valuation Currency USD Billion, constant 2025 prices

FAQs

How should buyers evaluate total cost of ownership in the Industrial Air Filtration Market?
Energy consumed overcoming pressure drop usually dominates lifetime cost, often exceeding the filter purchase price several times over. Specify measured differential-pressure curves and energy classification, not nominal efficiency alone. [14][16]
Has ISO 16890 replaced EN 779 for industrial filter specification?
ISO 16890 has superseded EN 779 for general ventilation filters, rating performance against PM1, PM2.5, and PM10 fractions rather than a single test dust. EN 1822 still governs HEPA and ULPA classification. Dual referencing remains common in tenders. [14][15]
What integration challenges arise when retrofitting collectors in combustible dust environments?
Explosion venting, isolation devices, and grounding must be re-engineered alongside the collector, frequently forcing ductwork and structural changes. A dust hazard analysis under NFPA 652 typically governs scope and adds months to project schedules. [8]
Are service contracts changing competitive dynamics in the Industrial Air Filtration Market?
Multi-year media supply and performance-guarantee agreements lock in aftermarket revenue and raise switching costs substantially. Suppliers with dense field-service networks gain a structural advantage over pure product manufacturers. [20][23]
How is PFAS regulation affecting filter media selection?
PTFE membrane laminates face scrutiny under the European restriction proposal, prompting early qualification of polyimide, PPS and engineered nanofibre alternatives. Regulated-sector buyers are now writing substitution roadmaps into procurement specifications. [18]
Which procurement channel dominates the Industrial Air Filtration Market for greenfield plants?
Engineering contractors specify most new-build equipment, so inclusion on approved vendor lists matters more than direct end-user marketing. Replacement media, conversely, is purchased directly by plant maintenance teams. [24]
Which emerging use cases sit outside traditional heavy industry?
Battery gigafactories and semiconductor fabrication plants require dry-room and molecular contamination control at industrial scale. Data centre intake filtration in high-particulate regions represents a further growth pocket. [9]    
Author
Author
Author Profile
Snehal Singh LinkedIn
Manager - Research
High acumen in analyzing complex macro & micro markets with more than 6 years of work experience in the field of market research. By implementing her analytical skills in forecasting and estimation into market research reports, she has expertise in Packaging, Construction, and Equipment domains. She handles a team size of 20-25 resources and ensures smooth running of the projects, associated marketing activities, and client servicing.

Research Approach


Secondary Research

The secondary research process involved comprehensive analysis of environmental regulatory databases, industrial engineering publications, peer-reviewed journals, and authoritative environmental protection organizations. Key sources included the US Environmental Protection Agency (EPA), Occupational Safety and Health Administration (OSHA), European Environment Agency (EEA), National Institute for Occupational Safety and Health (NIOSH), American Conference of Governmental Industrial Hygienists (ACGIH), American Society of Heating, Refrigerating and Air-Conditioning Engineers (ASHRAE), International Organization for Standardization (ISO), National Ambient Air Quality Standards (NAAQS), World Health Organization (WHO) Air Quality Guidelines, EU Industrial Emissions Directive (IED), China Ministry of Ecology and Environment (MEE), Central Pollution Control Board (CPCB) India, and national environmental protection agencies from key industrial markets. These sources were used to collect emission standards data, regulatory compliance requirements, industrial facility statistics, energy efficiency benchmarks, and market landscape analysis for dust collection filters, mist collection filters, fume collection filters, HEPA filters, and other industrial filtration technologies.


Primary Research

Qualitative and quantitative insights were obtained by interviewing supply-side and demand-side stakeholders during the primary research process. The supply-side sources consisted of CEOs, VPs of Engineering, environmental compliance leaders, and sales directors from industrial air filtration manufacturers and OEMs. Plant managers, EHS (Environment, Health & Safety) directors, facility engineers, and procurement leads from the cement, food & beverage, metal, power, pharmaceutical, chemical & petrochemical, paper & wood processing, agriculture, and paint & finishing industries constituted demand-side sources. Market segmentation was verified, product development timelines were confirmed, and insights regarding technology adoption patterns, pricing strategies, and aftermarket service dynamics were obtained through primary research.

Primary Respondent Breakdown:

By Designation: C-level Primaries (32%), Director Level (30%), Others (38%)

By Region: North America (38%), Europe (25%), Asia-Pacific (28%), Rest of World (9%)


Market Size Estimation

Global market valuation was derived through revenue mapping and installation base analysis. The methodology included:

Identification of 50+ key manufacturers across North America, Europe, Asia-Pacific, Latin America, and Middle East & Africa

Product mapping across dust collection filters (cartridge collectors, baghouse filters), mist collection filters, fume collection filters, HEPA filters, and other specialized filtration categories

Analysis of reported and modeled annual revenues specific to industrial air filtration portfolios

Coverage of manufacturers representing 75-80% of global market share in 2024

Extrapolation using bottom-up (installation volume × ASP by country/region) and top-down (manufacturer revenue validation) approaches to derive segment-specific valuations for OEM and aftermarket distribution channels

Download Free Sample

Kindly complete the form below to receive a free sample of this Report

* Please use a valid business email

Download PDF ×

We do not share your information with anyone. However, we may send you emails based on your report interest from time to time. You may contact us at any time to opt-out.
















