IT Service Continuity Maintenance Market

IT Service Continuity Maintenance Market Research Report Information By End User (It Service Providers, Large Enterprises, Small And Medium Enterprises, Government Organizations), By Industry (Healthcare, Finance, Telecommunications, Manufacturing), By Service Type (Disaster Recovery Services, Backup Services, Business Continuity Planning, Cloud Continuity Services), By Deployment Type (On-Premises, Cloud-Based, Hybrid), By Compliance Standards (Iso 22301, Itil, Cobit, Nist) And By Region (North America, Europe, Asia-Pacific, And Rest Of The World) – Market Forecast Till 2035.

Forecast Period
2025 - 2035
CAGR
6.5%
2024 Market Size
$ 12.5 Billion
2035 Market Size
$ 25 Billion
MRO ● Updated April 24, 2026 Report ID: MRFR/MRO/65333-HCR | Pages: 200 | Author: Shubham Munde

IT Service Continuity Maintenance Market Summary

As per MRFR analysis, the IT Service Continuity Maintenance Market Size was estimated at 12.5 USD Billion in 2024. The IT Service Continuity Maintenance industry is projected to grow from 13.31 USD Billion in 2025 to 25.0 USD Billion by 2035, exhibiting a compound annual growth rate (CAGR) of 6.5% during the forecast period 2025 - 2035.

Key Market Trends & Highlights

The IT Service Continuity Maintenance Market is poised for robust growth driven by technological advancements and increasing regulatory demands.

  • North America remains the largest market for IT Service Continuity Maintenance, reflecting a strong emphasis on risk management.
  • The Asia-Pacific region is emerging as the fastest-growing market, fueled by rapid digital transformation and increasing awareness of business continuity.
  • Disaster Recovery Services dominate the market, while Backup Services are witnessing the fastest growth due to heightened data protection needs.
  • Key market drivers include the growing demand for business continuity planning and rising cybersecurity threats, which are shaping service offerings.

Market Size & Forecast

2024 Market Size 12.5 (USD Billion)
2035 Market Size 25.0 (USD Billion)
CAGR (2025 - 2035) 6.5%

Major Players

IBM (US), Microsoft (US), Oracle (US), ServiceNow (US), BMC Software (US), Atos (FR), Hewlett Packard Enterprise (US), Cisco Systems (US), Dell Technologies (US), SAP (DE)

Our Impact

Enabled $4.3B Revenue Impact for Fortune 500 and Leading Multinationals

Partnering with 2000+ Global Organizations Each Year

30K+ Citations by Top-Tier Firms in the Industry

IT Service Continuity Maintenance Market Drivers

Rising Cybersecurity Threats

The escalation of cybersecurity threats is a critical factor influencing the IT Service Continuity Maintenance Market. With the proliferation of sophisticated cyberattacks, organizations are compelled to enhance their IT service continuity measures. The financial implications of data breaches and service interruptions can be staggering, prompting businesses to prioritize investments in continuity maintenance solutions. Recent statistics suggest that the global cost of cybercrime is expected to reach trillions of dollars annually, underscoring the urgency for effective continuity strategies. Consequently, the demand for IT service continuity maintenance solutions is likely to surge as organizations seek to mitigate risks associated with cybersecurity threats.

Adoption of Cloud-Based Solutions

The shift towards cloud-based solutions is transforming the IT Service Continuity Maintenance Market. As organizations migrate their operations to the cloud, the need for continuity maintenance becomes paramount. Cloud environments offer scalability and flexibility, but they also introduce new challenges in maintaining service continuity. Businesses are increasingly seeking solutions that can ensure uninterrupted service delivery in cloud settings. Recent market analyses indicate that the cloud services market is expected to grow significantly, which in turn is likely to drive demand for IT service continuity maintenance solutions tailored for cloud environments. This trend highlights the importance of integrating continuity strategies within cloud infrastructures.

Increased Regulatory Requirements

The evolving landscape of regulatory requirements is significantly impacting the IT Service Continuity Maintenance Market. Organizations are now mandated to comply with various regulations that necessitate the implementation of effective continuity plans. These regulations often require businesses to demonstrate their ability to maintain service continuity during disruptions. As compliance becomes increasingly stringent, companies are investing in IT service continuity maintenance solutions to avoid penalties and ensure adherence to legal standards. The market for compliance-related services is projected to expand, indicating a strong correlation between regulatory pressures and the growth of the IT Service Continuity Maintenance Market.

Growing Demand for Business Continuity Planning

The increasing recognition of the necessity for robust business continuity planning is a primary driver in the IT Service Continuity Maintenance Market. Organizations are increasingly aware that disruptions can lead to significant financial losses and reputational damage. As a result, many enterprises are investing in comprehensive continuity strategies to ensure operational resilience. According to recent data, the market for business continuity planning solutions is projected to grow at a compound annual growth rate of approximately 10% over the next five years. This trend indicates a heightened focus on maintaining service continuity, thereby propelling the IT Service Continuity Maintenance Market forward.

Technological Advancements in IT Infrastructure

Technological advancements in IT infrastructure are reshaping the IT Service Continuity Maintenance Market. Innovations such as artificial intelligence, machine learning, and automation are enhancing the capabilities of continuity maintenance solutions. These technologies enable organizations to proactively identify potential disruptions and implement preventive measures. As businesses increasingly adopt advanced IT infrastructure, the demand for sophisticated continuity maintenance solutions is expected to rise. Market forecasts suggest that the integration of these technologies will lead to more efficient and effective continuity strategies, thereby driving growth in the IT Service Continuity Maintenance Market.

Market Segment Insights

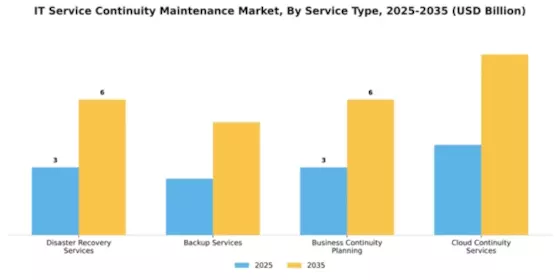
By Service Type: Disaster Recovery Services (Largest) vs. Backup Services (Fastest-Growing)

In the IT Service Continuity Maintenance Market, Disaster Recovery Services hold the largest share amongst the service types, supported by a growing reliance on robust recovery solutions to safeguard business operations. Backup Services, while not as dominant, are experiencing rapid growth as businesses increasingly recognize the importance of regular data backups in today’s digital landscape, especially with rising cyber threats and data loss incidents.
IT Service Continuity Maintenance Market Segment Image 0

Backup Services: Dominant vs. Business Continuity Planning: Emerging

Backup Services have established themselves as a crucial component within the IT Service Continuity Maintenance Market, emphasizing regular data protection and retrieval strategies that companies prioritize. Their position as a dominant service type stems from growing concerns around data integrity and the need for immediate recovery solutions. On the other hand, Business Continuity Planning is an emerging service that is gaining traction, driven by organizational needs for comprehensive strategies to maintain operational resilience during unforeseen events. This planning is pivotal for enterprises looking to navigate disruptions effectively, ensuring a seamless transition through various challenges.
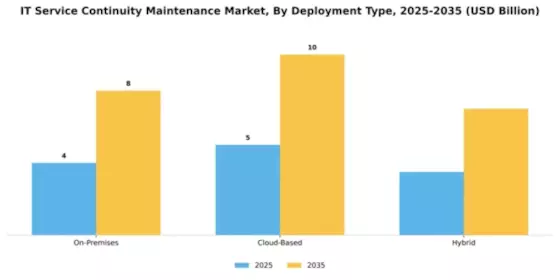
By Deployment Type: Cloud-Based (Largest) vs. Hybrid (Fastest-Growing)

IT Service Continuity Maintenance Market Segment Image 1

The IT Service Continuity Maintenance Market is witnessing a significant shift in deployment preferences, with Cloud-Based solutions dominating the landscape. This segment's extensive market share illustrates its widespread adoption across various industries, driven by the flexibility and scalability it offers. Conversely, Hybrid deployment is gaining momentum as organizations look to balance their workloads between on-premises systems and cloud resources, allowing for enhanced adaptability in their operations. In recent years, the growth of the IT Service Continuity Maintenance Market has been fueled by the increasing reliance on digital infrastructure and the push for business continuity solutions. Cloud-Based services are being favored for their cost-effectiveness and remote accessibility, while Hybrid models are appealing to organizations aiming to leverage both cloud advantages and traditional on-premises strengths. This trend is indicative of a broader transformation in IT strategies, prioritizing resilience and flexibility in the face of evolving challenges.

Cloud-Based (Dominant) vs. Hybrid (Emerging)

Cloud-Based solutions represent the dominant deployment type in the IT Service Continuity Maintenance Market, characterized by their ability to deliver comprehensive services without the constraints of physical infrastructure. Organizations are increasingly adopting Cloud-Based technologies due to their enhanced scalability, reduced operational costs, and robust disaster recovery options. On the other hand, Hybrid deployments are emerging as a competitive alternative, enabling businesses to optimize their IT environments by integrating existing on-premises assets with new cloud capabilities. This flexibility allows organizations to tailor their approaches to specific needs, thereby enhancing operational efficiency and continuity. As the market evolves, both deployment models will continue to coexist, catering to diverse organizational requirements.

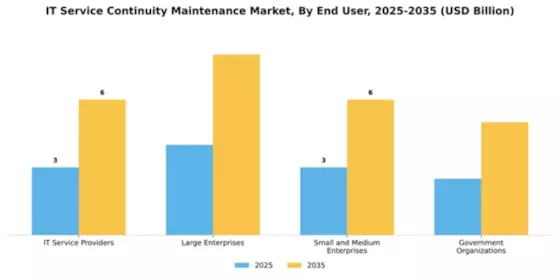
By End User: IT Service Providers (Largest) vs. Large Enterprises (Fastest-Growing)

In the IT Service Continuity Maintenance Market, the segment distribution illustrates that IT Service Providers hold the largest share, capitalizing on their expertise in delivering reliable and scalable IT solutions. This dominance underscores the critical role these providers play in maintaining service continuity, especially for their clients who require uninterrupted service. In contrast, Large Enterprises are witnessing significant growth due to their increasing dependence on complex IT infrastructures and the need for robust continuity planning to mitigate risks, thereby driving investments in maintenance solutions.
IT Service Continuity Maintenance Market Segment Image 2

IT Service Providers (Dominant) vs. Large Enterprises (Emerging)

IT Service Providers stand out as the dominant player in the IT Service Continuity Maintenance Market, owing to their extensive experience in managing various IT environments. They offer tailored solutions that align with the diverse needs of their clients, which range from cloud services to on-premises infrastructure. This flexibility positions them favorably against competitors. On the other hand, Large Enterprises represent an emerging segment that is rapidly adopting service continuity solutions to safeguard critical operations. Their vast IT landscapes require sophisticated maintenance strategies, prompting them to invest in comprehensive services that ensure minimal downtime and enhanced reliability, making them a vital growth driver in the market.
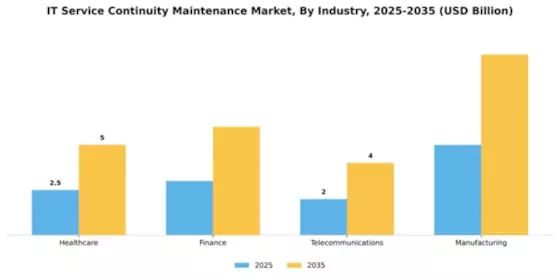
By Industry: Healthcare (Largest) vs. Finance (Fastest-Growing)

IT Service Continuity Maintenance Market Segment Image 3

In the IT Service Continuity Maintenance Market, the industry segment is notably characterized by its diverse range of applications across various sectors. Healthcare holds the largest share, owing to the critical need for uninterrupted services in patient care and data management. This is followed by the finance sector, which, while currently smaller, is rapidly growing due to increasing reliance on digital transactions and the essential nature of robust IT service continuity to safeguard financial operations.

Healthcare: Dominant vs. Finance: Emerging

The healthcare sector leads the IT Service Continuity Maintenance Market, driven by stringent regulations and the necessity for continuous operation in medical services. IT solutions in this segment focus on data protection, compliance, and real-time access to critical patient information, ensuring minimal disruption during crises. Conversely, the finance sector emerges prominently due to the accelerating trend of digital services and the growing emphasis on cybersecurity. Financial institutions are investing heavily in IT continuity solutions to mitigate risks associated with service outages, thus fueling their rapid growth in this market.

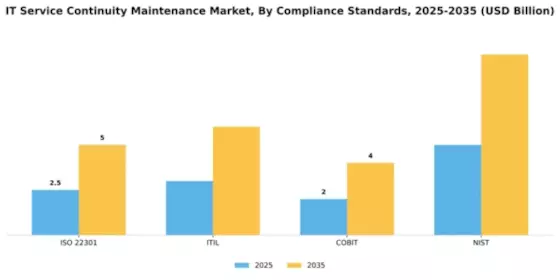
By Compliance Standards: ISO 22301 (Largest) vs. ITIL (Fastest-Growing)

In the IT Service Continuity Maintenance Market, ISO 22301 holds the largest market share, reflecting its widespread adoption for Business Continuity Management Systems across various industries. ITIL, with its comprehensive approach to IT service management, is emerging rapidly and is recognized for enhancing service quality and efficiency. Both standards play crucial roles in helping organizations maintain operational resilience and manage resources effectively during disruptions. The growth trends in this segment are fueled by increasing regulatory requirements and heightened awareness of operational risks among organizations. Companies are increasingly investing in frameworks like NIST and COBIT as well, as these complement ISO 22301 and ITIL. The demand for effective governance, risk management, and compliance (GRC) solutions drives the expansion of this segment, emphasizing the need for a structured approach to service continuity.
IT Service Continuity Maintenance Market Segment Image 4

ISO 22301 (Dominant) vs. NIST (Emerging)

ISO 22301 serves as the dominant framework in the IT Service Continuity Maintenance Market, providing a comprehensive roadmap for organizations looking to implement effective business continuity management. It emphasizes risk assessment, planning, and recovery strategies to ensure continuity during disruptions. On the other hand, NIST represents an emerging standard that integrates cybersecurity with business continuity, catering to the growing intersection of security and operational resilience. With its robust guidelines and tools, NIST appeals to organizations aiming to enhance their defense mechanisms while maintaining continuity. Both standards underscore the importance of a proactive approach to service continuity, with ISO 22301 leading as the preferred choice for many established firms, and NIST gaining traction among those focusing on cybersecurity.

Get more detailed insights about IT Service Continuity Maintenance Market Request Free Sample

Regional Insights

North America : Market Leader in IT Services

North America continues to lead the IT Service Continuity Maintenance Market, holding a significant share of 6.25 in 2025. The region's growth is driven by increasing demand for robust IT infrastructure, regulatory compliance, and the need for seamless service delivery. Companies are investing heavily in advanced technologies to enhance service reliability and minimize downtime, which is crucial in today's digital landscape. The competitive landscape is characterized by the presence of major players such as IBM, Microsoft, and Oracle, which are continuously innovating to meet market demands. The U.S. remains the largest contributor, supported by a strong ecosystem of technology firms and a favorable regulatory environment. This dynamic market is expected to grow further as organizations prioritize IT resilience and continuity strategies.

Europe : Emerging Market with Growth Potential

Europe's IT Service Continuity Maintenance Market is poised for growth, with a market size of 3.75 in 2025. The region is experiencing increased demand for IT continuity solutions driven by stringent regulations and a growing emphasis on data protection. European organizations are focusing on enhancing their IT resilience to comply with GDPR and other regulatory frameworks, which is propelling market growth. Leading countries such as Germany, France, and the UK are at the forefront of this expansion, with a competitive landscape featuring key players like SAP and Atos. The presence of established technology firms and a strong emphasis on innovation are critical factors in shaping the market. As businesses adapt to evolving regulatory requirements, the demand for IT service continuity solutions is expected to rise significantly.

Asia-Pacific : Rapid Growth in Emerging Markets

The Asia-Pacific region is witnessing a rapid expansion in the IT Service Continuity Maintenance Market, with a market size of 2.5 in 2025. This growth is fueled by increasing digital transformation initiatives and a rising awareness of the importance of IT resilience among businesses. Governments are also playing a crucial role by implementing policies that encourage the adoption of advanced IT solutions, thereby driving market demand. Countries like China, India, and Japan are leading this growth, supported by a burgeoning tech ecosystem and significant investments in IT infrastructure. The competitive landscape is becoming increasingly dynamic, with both local and international players vying for market share. As organizations in this region prioritize continuity strategies, the demand for IT service solutions is expected to escalate.

Middle East and Africa : Emerging Market with Untapped Potential

The Middle East and Africa region is gradually emerging in the IT Service Continuity Maintenance Market, with a market size of 0.75 in 2025. The growth is driven by increasing investments in IT infrastructure and a growing recognition of the need for service continuity. Governments are initiating various programs to enhance digital capabilities, which is expected to boost market demand in the coming years. Countries like South Africa and the UAE are leading the charge, with a focus on improving their IT frameworks. The competitive landscape is still developing, with opportunities for both local and international players to establish a foothold. As businesses in this region begin to prioritize IT service continuity, the market is set for significant growth.

Key Players and Competitive Insights

The IT Service Continuity Maintenance Market is currently characterized by a dynamic competitive landscape, driven by the increasing reliance on digital infrastructure and the necessity for uninterrupted service delivery. Major players such as IBM (US), Microsoft (US), and ServiceNow (US) are strategically positioned to leverage their technological prowess and extensive service portfolios. IBM (US) focuses on innovation through its cloud-based solutions, while Microsoft (US) emphasizes integration of AI capabilities into its service continuity offerings. ServiceNow (US) is enhancing its platform to streamline incident management and recovery processes, thereby shaping a competitive environment that prioritizes resilience and efficiency.The market structure appears moderately fragmented, with a mix of established players and emerging firms vying for market share. Key business tactics include localizing service delivery to meet regional demands and optimizing supply chains to enhance responsiveness. The collective influence of these players fosters a competitive atmosphere where agility and customer-centric solutions are paramount, allowing companies to differentiate themselves in a crowded marketplace.In November IBM (US) announced a strategic partnership with a leading telecommunications provider to enhance its service continuity solutions. This collaboration aims to integrate advanced network capabilities into IBM's offerings, thereby improving the reliability and speed of service recovery. Such a move underscores IBM's commitment to innovation and positions it favorably against competitors by expanding its service capabilities in critical sectors.In October Microsoft (US) unveiled a new AI-driven feature within its service continuity platform, designed to predict potential service disruptions before they occur. This proactive approach not only enhances customer trust but also aligns with the growing trend of utilizing AI for operational efficiency. By investing in predictive analytics, Microsoft (US) is likely to solidify its market position and attract clients seeking advanced technological solutions.In September ServiceNow (US) launched a comprehensive update to its platform, incorporating machine learning algorithms to automate incident response processes. This strategic enhancement is indicative of ServiceNow's focus on digital transformation and reflects a broader industry trend towards automation. By streamlining operations, ServiceNow (US) is poised to improve service delivery and customer satisfaction, further entrenching its competitive edge.As of December the competitive trends within the IT Service Continuity Maintenance Market are increasingly defined by digitalization, sustainability, and the integration of AI technologies. Strategic alliances are becoming more prevalent, as companies recognize the value of collaboration in enhancing service offerings. Looking ahead, competitive differentiation is expected to evolve, shifting from traditional price-based competition to a focus on innovation, technological advancement, and supply chain reliability. This transition may redefine how companies engage with clients, emphasizing the importance of resilience and adaptability in an ever-changing market.


Key Companies in the IT Service Continuity Maintenance Market include

Future Outlook

IT Service Continuity Maintenance Market Future Outlook

The IT Service Continuity Maintenance Market is projected to grow at a 6.5% CAGR from 2025 to 2035, driven by increasing reliance on digital infrastructure and regulatory compliance demands.

New opportunities lie in:

  • Development of AI-driven predictive maintenance tools Expansion of cloud-based continuity solutions Integration of cybersecurity measures into continuity planning

By 2035, the market is expected to be robust, reflecting substantial growth and innovation.

Market Segmentation

it-service-continuity-maintenance-market End User Outlook

  • IT Service Providers
  • Large Enterprises
  • Small and Medium Enterprises
  • Government Organizations

it-service-continuity-maintenance-market Industry Outlook

  • Healthcare
  • Finance
  • Telecommunications
  • Manufacturing

it-service-continuity-maintenance-market Service Type Outlook

  • Disaster Recovery Services
  • Backup Services
  • Business Continuity Planning
  • Cloud Continuity Services

it-service-continuity-maintenance-market Deployment Type Outlook

  • On-Premises
  • Cloud-Based
  • Hybrid

it-service-continuity-maintenance-market Compliance Standards Outlook

  • ISO 22301
  • ITIL
  • COBIT
  • NIST

Report Scope

MARKET SIZE 2024 12.5(USD Billion)
MARKET SIZE 2025 13.31(USD Billion)
MARKET SIZE 2035 25.0(USD Billion)
COMPOUND ANNUAL GROWTH RATE (CAGR) 6.5% (2025 - 2035)
REPORT COVERAGE Revenue Forecast, Competitive Landscape, Growth Factors, and Trends
BASE YEAR 2024
Market Forecast Period 2025 - 2035
Historical Data 2019 - 2024
Market Forecast Units USD Billion
Key Companies Profiled IBM (US), Microsoft (US), Oracle (US), ServiceNow (US), BMC Software (US), Atos (FR), Hewlett Packard Enterprise (US), Cisco Systems (US), Dell Technologies (US), SAP (DE)
Segments Covered Service Type, Deployment Type, End User, Industry, Compliance Standards
Key Market Opportunities Integration of artificial intelligence enhances resilience in the IT Service Continuity Maintenance Market.
Key Market Dynamics Rising demand for robust IT service continuity solutions drives competitive innovation and regulatory compliance across industries.
Countries Covered North America, Europe, APAC, South America, MEA

Table of Contents

  1. SECTION I: EXECUTIVE SUMMARY AND KEY HIGHLIGHTS |
    1. 1.1 EXECUTIVE SUMMARY | |
      1. 1.1.1 Market Overview | |
      2. 1.1.2 Key Findings | |
      3. 1.1.3 Market Segmentation | |
      4. 1.1.4 Competitive Landscape | |
      5. 1.1.5 Challenges and Opportunities | |
      6. 1.1.6 Future Outlook 2
  2. SECTION II: SCOPING, METHODOLOGY AND MARKET STRUCTURE |
    1. 2.1 MARKET INTRODUCTION | |
      1. 2.1.1 Definition | |
      2. 2.1.2 Scope of the study | | |
        1. 2.1.2.1 Research Objective | | |
        2. 2.1.2.2 Assumption | | |
        3. 2.1.2.3 Limitations |
    2. 2.2 RESEARCH METHODOLOGY | |
      1. 2.2.1 Overview | |
      2. 2.2.2 Data Mining | |
      3. 2.2.3 Secondary Research | |
      4. 2.2.4 Primary Research | | |
        1. 2.2.4.1 Primary Interviews and Information Gathering Process | | |
        2. 2.2.4.2 Breakdown of Primary Respondents | |
      5. 2.2.5 Forecasting Model | |
      6. 2.2.6 Market Size Estimation | | |
        1. 2.2.6.1 Bottom-Up Approach | | |
        2. 2.2.6.2 Top-Down Approach | |
      7. 2.2.7 Data Triangulation | |
      8. 2.2.8 Validation 3
  3. SECTION III: QUALITATIVE ANALYSIS |
    1. 3.1 MARKET DYNAMICS | |
      1. 3.1.1 Overview | |
      2. 3.1.2 Drivers | |
      3. 3.1.3 Restraints | |
      4. 3.1.4 Opportunities |
    2. 3.2 MARKET FACTOR ANALYSIS | |
      1. 3.2.1 Value chain Analysis | |
      2. 3.2.2 Porter's Five Forces Analysis | | |
        1. 3.2.2.1 Bargaining Power of Suppliers | | |
        2. 3.2.2.2 Bargaining Power of Buyers | | |
        3. 3.2.2.3 Threat of New Entrants | | |
        4. 3.2.2.4 Threat of Substitutes | | |
        5. 3.2.2.5 Intensity of Rivalry | |
      3. 3.2.3 COVID-19 Impact Analysis | | |
        1. 3.2.3.1 Market Impact Analysis | | |
        2. 3.2.3.2 Regional Impact | | |
        3. 3.2.3.3 Opportunity and Threat Analysis 4
  4. SECTION IV: QUANTITATIVE ANALYSIS |
    1. 4.1 Medical Device, BY Service Type (USD Billion) | |
      1. 4.1.1 Disaster Recovery Services | |
      2. 4.1.2 Backup Services | |
      3. 4.1.3 Business Continuity Planning | |
      4. 4.1.4 Cloud Continuity Services |
    2. 4.2 Medical Device, BY Deployment Type (USD Billion) | |
      1. 4.2.1 On-Premises | |
      2. 4.2.2 Cloud-Based | |
      3. 4.2.3 Hybrid |
    3. 4.3 Medical Device, BY End User (USD Billion) | |
      1. 4.3.1 IT Service Providers | |
      2. 4.3.2 Large Enterprises | |
      3. 4.3.3 Small and Medium Enterprises | |
      4. 4.3.4 Government Organizations |
    4. 4.4 Medical Device, BY Industry (USD Billion) | |
      1. 4.4.1 Healthcare | |
      2. 4.4.2 Finance | |
      3. 4.4.3 Telecommunications | |
      4. 4.4.4 Manufacturing |
    5. 4.5 Medical Device, BY Compliance Standards (USD Billion) | |
      1. 4.5.1 ISO 22301 | |
      2. 4.5.2 ITIL | |
      3. 4.5.3 COBIT | |
      4. 4.5.4 NIST |
    6. 4.6 Medical Device, BY Region (USD Billion) | |
      1. 4.6.1 North America | | |
        1. 4.6.1.1 US | | |
        2. 4.6.1.2 Canada | |
      2. 4.6.2 Europe | | |
        1. 4.6.2.1 Germany | | |
        2. 4.6.2.2 UK | | |
        3. 4.6.2.3 France | | |
        4. 4.6.2.4 Russia | | |
        5. 4.6.2.5 Italy | | |
        6. 4.6.2.6 Spain | | |
        7. 4.6.2.7 Rest of Europe | |
      3. 4.6.3 APAC | | |
        1. 4.6.3.1 China | | |
        2. 4.6.3.2 India | | |
        3. 4.6.3.3 Japan | | |
        4. 4.6.3.4 South Korea | | |
        5. 4.6.3.5 Malaysia | | |
        6. 4.6.3.6 Thailand | | |
        7. 4.6.3.7 Indonesia | | |
        8. 4.6.3.8 Rest of APAC | |
      4. 4.6.4 South America | | |
        1. 4.6.4.1 Brazil | | |
        2. 4.6.4.2 Mexico | | |
        3. 4.6.4.3 Argentina | | |
        4. 4.6.4.4 Rest of South America | |
      5. 4.6.5 MEA | | |
        1. 4.6.5.1 GCC Countries | | |
        2. 4.6.5.2 South Africa | | |
        3. 4.6.5.3 Rest of MEA 5
  5. SECTION V: COMPETITIVE ANALYSIS |
    1. 5.1 Competitive Landscape | |
      1. 5.1.1 Overview | |
      2. 5.1.2 Competitive Analysis | |
      3. 5.1.3 Market share Analysis | |
      4. 5.1.4 Major Growth Strategy in the Medical Device | |
      5. 5.1.5 Competitive Benchmarking | |
      6. 5.1.6 Leading Players in Terms of Number of Developments in the Medical Device | |
      7. 5.1.7 Key developments and growth strategies | | |
        1. 5.1.7.1 New Product Launch/Service Deployment | | |
        2. 5.1.7.2 Merger & Acquisitions | | |
        3. 5.1.7.3 Joint Ventures | |
      8. 5.1.8 Major Players Financial Matrix | | |
        1. 5.1.8.1 Sales and Operating Income | | |
        2. 5.1.8.2 Major Players R&D Expenditure. 2023 |
    2. 5.2 Company Profiles | |
      1. 5.2.1 IBM (US) | | |
        1. 5.2.1.1 Financial Overview | | |
        2. 5.2.1.2 Products Offered | | |
        3. 5.2.1.3 Key Developments | | |
        4. 5.2.1.4 SWOT Analysis | | |
        5. 5.2.1.5 Key Strategies | |
      2. 5.2.2 Microsoft (US) | | |
        1. 5.2.2.1 Financial Overview | | |
        2. 5.2.2.2 Products Offered | | |
        3. 5.2.2.3 Key Developments | | |
        4. 5.2.2.4 SWOT Analysis | | |
        5. 5.2.2.5 Key Strategies | |
      3. 5.2.3 Oracle (US) | | |
        1. 5.2.3.1 Financial Overview | | |
        2. 5.2.3.2 Products Offered | | |
        3. 5.2.3.3 Key Developments | | |
        4. 5.2.3.4 SWOT Analysis | | |
        5. 5.2.3.5 Key Strategies | |
      4. 5.2.4 ServiceNow (US) | | |
        1. 5.2.4.1 Financial Overview | | |
        2. 5.2.4.2 Products Offered | | |
        3. 5.2.4.3 Key Developments | | |
        4. 5.2.4.4 SWOT Analysis | | |
        5. 5.2.4.5 Key Strategies | |
      5. 5.2.5 BMC Software (US) | | |
        1. 5.2.5.1 Financial Overview | | |
        2. 5.2.5.2 Products Offered | | |
        3. 5.2.5.3 Key Developments | | |
        4. 5.2.5.4 SWOT Analysis | | |
        5. 5.2.5.5 Key Strategies | |
      6. 5.2.6 Atos (FR) | | |
        1. 5.2.6.1 Financial Overview | | |
        2. 5.2.6.2 Products Offered | | |
        3. 5.2.6.3 Key Developments | | |
        4. 5.2.6.4 SWOT Analysis | | |
        5. 5.2.6.5 Key Strategies | |
      7. 5.2.7 Hewlett Packard Enterprise (US) | | |
        1. 5.2.7.1 Financial Overview | | |
        2. 5.2.7.2 Products Offered | | |
        3. 5.2.7.3 Key Developments | | |
        4. 5.2.7.4 SWOT Analysis | | |
        5. 5.2.7.5 Key Strategies | |
      8. 5.2.8 Cisco Systems (US) | | |
        1. 5.2.8.1 Financial Overview | | |
        2. 5.2.8.2 Products Offered | | |
        3. 5.2.8.3 Key Developments | | |
        4. 5.2.8.4 SWOT Analysis | | |
        5. 5.2.8.5 Key Strategies | |
      9. 5.2.9 Dell Technologies (US) | | |
        1. 5.2.9.1 Financial Overview | | |
        2. 5.2.9.2 Products Offered | | |
        3. 5.2.9.3 Key Developments | | |
        4. 5.2.9.4 SWOT Analysis | | |
        5. 5.2.9.5 Key Strategies | |
      10. 5.2.10 SAP (DE) | | |
        1. 5.2.10.1 Financial Overview | | |
        2. 5.2.10.2 Products Offered | | |
        3. 5.2.10.3 Key Developments | | |
        4. 5.2.10.4 SWOT Analysis | | |
        5. 5.2.10.5 Key Strategies |
    3. 5.3 Appendix | |
      1. 5.3.1 References | |
      2. 5.3.2 Related Reports 6 LIST OF FIGURES |
    4. 6.1 MARKET SYNOPSIS |
    5. 6.2 NORTH AMERICA MARKET ANALYSIS |
    6. 6.3 US MARKET ANALYSIS BY SERVICE TYPE |
    7. 6.4 US MARKET ANALYSIS BY DEPLOYMENT TYPE |
    8. 6.5 US MARKET ANALYSIS BY END USER |
    9. 6.6 US MARKET ANALYSIS BY INDUSTRY |
    10. 6.7 US MARKET ANALYSIS BY COMPLIANCE STANDARDS |
    11. 6.8 CANADA MARKET ANALYSIS BY SERVICE TYPE |
    12. 6.9 CANADA MARKET ANALYSIS BY DEPLOYMENT TYPE |
    13. 6.10 CANADA MARKET ANALYSIS BY END USER |
    14. 6.11 CANADA MARKET ANALYSIS BY INDUSTRY |
    15. 6.12 CANADA MARKET ANALYSIS BY COMPLIANCE STANDARDS |
    16. 6.13 EUROPE MARKET ANALYSIS |
    17. 6.14 GERMANY MARKET ANALYSIS BY SERVICE TYPE |
    18. 6.15 GERMANY MARKET ANALYSIS BY DEPLOYMENT TYPE |
    19. 6.16 GERMANY MARKET ANALYSIS BY END USER |
    20. 6.17 GERMANY MARKET ANALYSIS BY INDUSTRY |
    21. 6.18 GERMANY MARKET ANALYSIS BY COMPLIANCE STANDARDS |
    22. 6.19 UK MARKET ANALYSIS BY SERVICE TYPE |
    23. 6.20 UK MARKET ANALYSIS BY DEPLOYMENT TYPE |
    24. 6.21 UK MARKET ANALYSIS BY END USER |
    25. 6.22 UK MARKET ANALYSIS BY INDUSTRY |
    26. 6.23 UK MARKET ANALYSIS BY COMPLIANCE STANDARDS |
    27. 6.24 FRANCE MARKET ANALYSIS BY SERVICE TYPE |
    28. 6.25 FRANCE MARKET ANALYSIS BY DEPLOYMENT TYPE |
    29. 6.26 FRANCE MARKET ANALYSIS BY END USER |
    30. 6.27 FRANCE MARKET ANALYSIS BY INDUSTRY |
    31. 6.28 FRANCE MARKET ANALYSIS BY COMPLIANCE STANDARDS |
    32. 6.29 RUSSIA MARKET ANALYSIS BY SERVICE TYPE |
    33. 6.30 RUSSIA MARKET ANALYSIS BY DEPLOYMENT TYPE |
    34. 6.31 RUSSIA MARKET ANALYSIS BY END USER |
    35. 6.32 RUSSIA MARKET ANALYSIS BY INDUSTRY |
    36. 6.33 RUSSIA MARKET ANALYSIS BY COMPLIANCE STANDARDS |
    37. 6.34 ITALY MARKET ANALYSIS BY SERVICE TYPE |
    38. 6.35 ITALY MARKET ANALYSIS BY DEPLOYMENT TYPE |
    39. 6.36 ITALY MARKET ANALYSIS BY END USER |
    40. 6.37 ITALY MARKET ANALYSIS BY INDUSTRY |
    41. 6.38 ITALY MARKET ANALYSIS BY COMPLIANCE STANDARDS |
    42. 6.39 SPAIN MARKET ANALYSIS BY SERVICE TYPE |
    43. 6.40 SPAIN MARKET ANALYSIS BY DEPLOYMENT TYPE |
    44. 6.41 SPAIN MARKET ANALYSIS BY END USER |
    45. 6.42 SPAIN MARKET ANALYSIS BY INDUSTRY |
    46. 6.43 SPAIN MARKET ANALYSIS BY COMPLIANCE STANDARDS |
    47. 6.44 REST OF EUROPE MARKET ANALYSIS BY SERVICE TYPE |
    48. 6.45 REST OF EUROPE MARKET ANALYSIS BY DEPLOYMENT TYPE |
    49. 6.46 REST OF EUROPE MARKET ANALYSIS BY END USER |
    50. 6.47 REST OF EUROPE MARKET ANALYSIS BY INDUSTRY |
    51. 6.48 REST OF EUROPE MARKET ANALYSIS BY COMPLIANCE STANDARDS |
    52. 6.49 APAC MARKET ANALYSIS |
    53. 6.50 CHINA MARKET ANALYSIS BY SERVICE TYPE |
    54. 6.51 CHINA MARKET ANALYSIS BY DEPLOYMENT TYPE |
    55. 6.52 CHINA MARKET ANALYSIS BY END USER |
    56. 6.53 CHINA MARKET ANALYSIS BY INDUSTRY |
    57. 6.54 CHINA MARKET ANALYSIS BY COMPLIANCE STANDARDS |
    58. 6.55 INDIA MARKET ANALYSIS BY SERVICE TYPE |
    59. 6.56 INDIA MARKET ANALYSIS BY DEPLOYMENT TYPE |
    60. 6.57 INDIA MARKET ANALYSIS BY END USER |
    61. 6.58 INDIA MARKET ANALYSIS BY INDUSTRY |
    62. 6.59 INDIA MARKET ANALYSIS BY COMPLIANCE STANDARDS |
    63. 6.60 JAPAN MARKET ANALYSIS BY SERVICE TYPE |
    64. 6.61 JAPAN MARKET ANALYSIS BY DEPLOYMENT TYPE |
    65. 6.62 JAPAN MARKET ANALYSIS BY END USER |
    66. 6.63 JAPAN MARKET ANALYSIS BY INDUSTRY |
    67. 6.64 JAPAN MARKET ANALYSIS BY COMPLIANCE STANDARDS |
    68. 6.65 SOUTH KOREA MARKET ANALYSIS BY SERVICE TYPE |
    69. 6.66 SOUTH KOREA MARKET ANALYSIS BY DEPLOYMENT TYPE |
    70. 6.67 SOUTH KOREA MARKET ANALYSIS BY END USER |
    71. 6.68 SOUTH KOREA MARKET ANALYSIS BY INDUSTRY |
    72. 6.69 SOUTH KOREA MARKET ANALYSIS BY COMPLIANCE STANDARDS |
    73. 6.70 MALAYSIA MARKET ANALYSIS BY SERVICE TYPE |
    74. 6.71 MALAYSIA MARKET ANALYSIS BY DEPLOYMENT TYPE |
    75. 6.72 MALAYSIA MARKET ANALYSIS BY END USER |
    76. 6.73 MALAYSIA MARKET ANALYSIS BY INDUSTRY |
    77. 6.74 MALAYSIA MARKET ANALYSIS BY COMPLIANCE STANDARDS |
    78. 6.75 THAILAND MARKET ANALYSIS BY SERVICE TYPE |
    79. 6.76 THAILAND MARKET ANALYSIS BY DEPLOYMENT TYPE |
    80. 6.77 THAILAND MARKET ANALYSIS BY END USER |
    81. 6.78 THAILAND MARKET ANALYSIS BY INDUSTRY |
    82. 6.79 THAILAND MARKET ANALYSIS BY COMPLIANCE STANDARDS |
    83. 6.80 INDONESIA MARKET ANALYSIS BY SERVICE TYPE |
    84. 6.81 INDONESIA MARKET ANALYSIS BY DEPLOYMENT TYPE |
    85. 6.82 INDONESIA MARKET ANALYSIS BY END USER |
    86. 6.83 INDONESIA MARKET ANALYSIS BY INDUSTRY |
    87. 6.84 INDONESIA MARKET ANALYSIS BY COMPLIANCE STANDARDS |
    88. 6.85 REST OF APAC MARKET ANALYSIS BY SERVICE TYPE |
    89. 6.86 REST OF APAC MARKET ANALYSIS BY DEPLOYMENT TYPE |
    90. 6.87 REST OF APAC MARKET ANALYSIS BY END USER |
    91. 6.88 REST OF APAC MARKET ANALYSIS BY INDUSTRY |
    92. 6.89 REST OF APAC MARKET ANALYSIS BY COMPLIANCE STANDARDS |
    93. 6.90 SOUTH AMERICA MARKET ANALYSIS |
    94. 6.91 BRAZIL MARKET ANALYSIS BY SERVICE TYPE |
    95. 6.92 BRAZIL MARKET ANALYSIS BY DEPLOYMENT TYPE |
    96. 6.93 BRAZIL MARKET ANALYSIS BY END USER |
    97. 6.94 BRAZIL MARKET ANALYSIS BY INDUSTRY |
    98. 6.95 BRAZIL MARKET ANALYSIS BY COMPLIANCE STANDARDS |
    99. 6.96 MEXICO MARKET ANALYSIS BY SERVICE TYPE |
    100. 6.97 MEXICO MARKET ANALYSIS BY DEPLOYMENT TYPE |
    101. 6.98 MEXICO MARKET ANALYSIS BY END USER |
    102. 6.99 MEXICO MARKET ANALYSIS BY INDUSTRY |
    103. 6.100 MEXICO MARKET ANALYSIS BY COMPLIANCE STANDARDS |
    104. 6.101 ARGENTINA MARKET ANALYSIS BY SERVICE TYPE |
    105. 6.102 ARGENTINA MARKET ANALYSIS BY DEPLOYMENT TYPE |
    106. 6.103 ARGENTINA MARKET ANALYSIS BY END USER |
    107. 6.104 ARGENTINA MARKET ANALYSIS BY INDUSTRY |
    108. 6.105 ARGENTINA MARKET ANALYSIS BY COMPLIANCE STANDARDS |
    109. 6.106 REST OF SOUTH AMERICA MARKET ANALYSIS BY SERVICE TYPE |
    110. 6.107 REST OF SOUTH AMERICA MARKET ANALYSIS BY DEPLOYMENT TYPE |
    111. 6.108 REST OF SOUTH AMERICA MARKET ANALYSIS BY END USER |
    112. 6.109 REST OF SOUTH AMERICA MARKET ANALYSIS BY INDUSTRY |
    113. 6.110 REST OF SOUTH AMERICA MARKET ANALYSIS BY COMPLIANCE STANDARDS |
    114. 6.111 MEA MARKET ANALYSIS |
    115. 6.112 GCC COUNTRIES MARKET ANALYSIS BY SERVICE TYPE |
    116. 6.113 GCC COUNTRIES MARKET ANALYSIS BY DEPLOYMENT TYPE |
    117. 6.114 GCC COUNTRIES MARKET ANALYSIS BY END USER |
    118. 6.115 GCC COUNTRIES MARKET ANALYSIS BY INDUSTRY |
    119. 6.116 GCC COUNTRIES MARKET ANALYSIS BY COMPLIANCE STANDARDS |
    120. 6.117 SOUTH AFRICA MARKET ANALYSIS BY SERVICE TYPE |
    121. 6.118 SOUTH AFRICA MARKET ANALYSIS BY DEPLOYMENT TYPE |
    122. 6.119 SOUTH AFRICA MARKET ANALYSIS BY END USER |
    123. 6.120 SOUTH AFRICA MARKET ANALYSIS BY INDUSTRY |
    124. 6.121 SOUTH AFRICA MARKET ANALYSIS BY COMPLIANCE STANDARDS |
    125. 6.122 REST OF MEA MARKET ANALYSIS BY SERVICE TYPE |
    126. 6.123 REST OF MEA MARKET ANALYSIS BY DEPLOYMENT TYPE |
    127. 6.124 REST OF MEA MARKET ANALYSIS BY END USER |
    128. 6.125 REST OF MEA MARKET ANALYSIS BY INDUSTRY |
    129. 6.126 REST OF MEA MARKET ANALYSIS BY COMPLIANCE STANDARDS |
    130. 6.127 KEY BUYING CRITERIA OF MEDICAL DEVICE |
    131. 6.128 RESEARCH PROCESS OF MRFR |
    132. 6.129 DRO ANALYSIS OF MEDICAL DEVICE |
    133. 6.130 DRIVERS IMPACT ANALYSIS: MEDICAL DEVICE |
    134. 6.131 RESTRAINTS IMPACT ANALYSIS: MEDICAL DEVICE |
    135. 6.132 SUPPLY / VALUE CHAIN: MEDICAL DEVICE |
    136. 6.133 MEDICAL DEVICE, BY SERVICE TYPE, 2024 (% SHARE) |
    137. 6.134 MEDICAL DEVICE, BY SERVICE TYPE, 2024 TO 2035 (USD Billion) |
    138. 6.135 MEDICAL DEVICE, BY DEPLOYMENT TYPE, 2024 (% SHARE) |
    139. 6.136 MEDICAL DEVICE, BY DEPLOYMENT TYPE, 2024 TO 2035 (USD Billion) |
    140. 6.137 MEDICAL DEVICE, BY END USER, 2024 (% SHARE) |
    141. 6.138 MEDICAL DEVICE, BY END USER, 2024 TO 2035 (USD Billion) |
    142. 6.139 MEDICAL DEVICE, BY INDUSTRY, 2024 (% SHARE) |
    143. 6.140 MEDICAL DEVICE, BY INDUSTRY, 2024 TO 2035 (USD Billion) |
    144. 6.141 MEDICAL DEVICE, BY COMPLIANCE STANDARDS, 2024 (% SHARE) |
    145. 6.142 MEDICAL DEVICE, BY COMPLIANCE STANDARDS, 2024 TO 2035 (USD Billion) |
    146. 6.143 BENCHMARKING OF MAJOR COMPETITORS 7 LIST OF TABLES |
    147. 7.1 LIST OF ASSUMPTIONS | |
      1. 7.1.1 |
    148. 7.2 North America MARKET SIZE ESTIMATES; FORECAST | |
      1. 7.2.1 BY SERVICE TYPE, 2025-2035 (USD Billion) | |
      2. 7.2.2 BY DEPLOYMENT TYPE, 2025-2035 (USD Billion) | |
      3. 7.2.3 BY END USER, 2025-2035 (USD Billion) | |
      4. 7.2.4 BY INDUSTRY, 2025-2035 (USD Billion) | |
      5. 7.2.5 BY COMPLIANCE STANDARDS, 2025-2035 (USD Billion) |
    149. 7.3 US MARKET SIZE ESTIMATES; FORECAST | |
      1. 7.3.1 BY SERVICE TYPE, 2025-2035 (USD Billion) | |
      2. 7.3.2 BY DEPLOYMENT TYPE, 2025-2035 (USD Billion) | |
      3. 7.3.3 BY END USER, 2025-2035 (USD Billion) | |
      4. 7.3.4 BY INDUSTRY, 2025-2035 (USD Billion) | |
      5. 7.3.5 BY COMPLIANCE STANDARDS, 2025-2035 (USD Billion) |
    150. 7.4 Canada MARKET SIZE ESTIMATES; FORECAST | |
      1. 7.4.1 BY SERVICE TYPE, 2025-2035 (USD Billion) | |
      2. 7.4.2 BY DEPLOYMENT TYPE, 2025-2035 (USD Billion) | |
      3. 7.4.3 BY END USER, 2025-2035 (USD Billion) | |
      4. 7.4.4 BY INDUSTRY, 2025-2035 (USD Billion) | |
      5. 7.4.5 BY COMPLIANCE STANDARDS, 2025-2035 (USD Billion) |
    151. 7.5 Europe MARKET SIZE ESTIMATES; FORECAST | |
      1. 7.5.1 BY SERVICE TYPE, 2025-2035 (USD Billion) | |
      2. 7.5.2 BY DEPLOYMENT TYPE, 2025-2035 (USD Billion) | |
      3. 7.5.3 BY END USER, 2025-2035 (USD Billion) | |
      4. 7.5.4 BY INDUSTRY, 2025-2035 (USD Billion) | |
      5. 7.5.5 BY COMPLIANCE STANDARDS, 2025-2035 (USD Billion) |
    152. 7.6 Germany MARKET SIZE ESTIMATES; FORECAST | |
      1. 7.6.1 BY SERVICE TYPE, 2025-2035 (USD Billion) | |
      2. 7.6.2 BY DEPLOYMENT TYPE, 2025-2035 (USD Billion) | |
      3. 7.6.3 BY END USER, 2025-2035 (USD Billion) | |
      4. 7.6.4 BY INDUSTRY, 2025-2035 (USD Billion) | |
      5. 7.6.5 BY COMPLIANCE STANDARDS, 2025-2035 (USD Billion) |
    153. 7.7 UK MARKET SIZE ESTIMATES; FORECAST | |
      1. 7.7.1 BY SERVICE TYPE, 2025-2035 (USD Billion) | |
      2. 7.7.2 BY DEPLOYMENT TYPE, 2025-2035 (USD Billion) | |
      3. 7.7.3 BY END USER, 2025-2035 (USD Billion) | |
      4. 7.7.4 BY INDUSTRY, 2025-2035 (USD Billion) | |
      5. 7.7.5 BY COMPLIANCE STANDARDS, 2025-2035 (USD Billion) |
    154. 7.8 France MARKET SIZE ESTIMATES; FORECAST | |
      1. 7.8.1 BY SERVICE TYPE, 2025-2035 (USD Billion) | |
      2. 7.8.2 BY DEPLOYMENT TYPE, 2025-2035 (USD Billion) | |
      3. 7.8.3 BY END USER, 2025-2035 (USD Billion) | |
      4. 7.8.4 BY INDUSTRY, 2025-2035 (USD Billion) | |
      5. 7.8.5 BY COMPLIANCE STANDARDS, 2025-2035 (USD Billion) |
    155. 7.9 Russia MARKET SIZE ESTIMATES; FORECAST | |
      1. 7.9.1 BY SERVICE TYPE, 2025-2035 (USD Billion) | |
      2. 7.9.2 BY DEPLOYMENT TYPE, 2025-2035 (USD Billion) | |
      3. 7.9.3 BY END USER, 2025-2035 (USD Billion) | |
      4. 7.9.4 BY INDUSTRY, 2025-2035 (USD Billion) | |
      5. 7.9.5 BY COMPLIANCE STANDARDS, 2025-2035 (USD Billion) |
    156. 7.10 Italy MARKET SIZE ESTIMATES; FORECAST | |
      1. 7.10.1 BY SERVICE TYPE, 2025-2035 (USD Billion) | |
      2. 7.10.2 BY DEPLOYMENT TYPE, 2025-2035 (USD Billion) | |
      3. 7.10.3 BY END USER, 2025-2035 (USD Billion) | |
      4. 7.10.4 BY INDUSTRY, 2025-2035 (USD Billion) | |
      5. 7.10.5 BY COMPLIANCE STANDARDS, 2025-2035 (USD Billion) |
    157. 7.11 Spain MARKET SIZE ESTIMATES; FORECAST | |
      1. 7.11.1 BY SERVICE TYPE, 2025-2035 (USD Billion) | |
      2. 7.11.2 BY DEPLOYMENT TYPE, 2025-2035 (USD Billion) | |
      3. 7.11.3 BY END USER, 2025-2035 (USD Billion) | |
      4. 7.11.4 BY INDUSTRY, 2025-2035 (USD Billion) | |
      5. 7.11.5 BY COMPLIANCE STANDARDS, 2025-2035 (USD Billion) |
    158. 7.12 Rest of Europe MARKET SIZE ESTIMATES; FORECAST | |
      1. 7.12.1 BY SERVICE TYPE, 2025-2035 (USD Billion) | |
      2. 7.12.2 BY DEPLOYMENT TYPE, 2025-2035 (USD Billion) | |
      3. 7.12.3 BY END USER, 2025-2035 (USD Billion) | |
      4. 7.12.4 BY INDUSTRY, 2025-2035 (USD Billion) | |
      5. 7.12.5 BY COMPLIANCE STANDARDS, 2025-2035 (USD Billion) |
    159. 7.13 APAC MARKET SIZE ESTIMATES; FORECAST | |
      1. 7.13.1 BY SERVICE TYPE, 2025-2035 (USD Billion) | |
      2. 7.13.2 BY DEPLOYMENT TYPE, 2025-2035 (USD Billion) | |
      3. 7.13.3 BY END USER, 2025-2035 (USD Billion) | |
      4. 7.13.4 BY INDUSTRY, 2025-2035 (USD Billion) | |
      5. 7.13.5 BY COMPLIANCE STANDARDS, 2025-2035 (USD Billion) |
    160. 7.14 China MARKET SIZE ESTIMATES; FORECAST | |
      1. 7.14.1 BY SERVICE TYPE, 2025-2035 (USD Billion) | |
      2. 7.14.2 BY DEPLOYMENT TYPE, 2025-2035 (USD Billion) | |
      3. 7.14.3 BY END USER, 2025-2035 (USD Billion) | |
      4. 7.14.4 BY INDUSTRY, 2025-2035 (USD Billion) | |
      5. 7.14.5 BY COMPLIANCE STANDARDS, 2025-2035 (USD Billion) |
    161. 7.15 India MARKET SIZE ESTIMATES; FORECAST | |
      1. 7.15.1 BY SERVICE TYPE, 2025-2035 (USD Billion) | |
      2. 7.15.2 BY DEPLOYMENT TYPE, 2025-2035 (USD Billion) | |
      3. 7.15.3 BY END USER, 2025-2035 (USD Billion) | |
      4. 7.15.4 BY INDUSTRY, 2025-2035 (USD Billion) | |
      5. 7.15.5 BY COMPLIANCE STANDARDS, 2025-2035 (USD Billion) |
    162. 7.16 Japan MARKET SIZE ESTIMATES; FORECAST | |
      1. 7.16.1 BY SERVICE TYPE, 2025-2035 (USD Billion) | |
      2. 7.16.2 BY DEPLOYMENT TYPE, 2025-2035 (USD Billion) | |
      3. 7.16.3 BY END USER, 2025-2035 (USD Billion) | |
      4. 7.16.4 BY INDUSTRY, 2025-2035 (USD Billion) | |
      5. 7.16.5 BY COMPLIANCE STANDARDS, 2025-2035 (USD Billion) |
    163. 7.17 South Korea MARKET SIZE ESTIMATES; FORECAST | |
      1. 7.17.1 BY SERVICE TYPE, 2025-2035 (USD Billion) | |
      2. 7.17.2 BY DEPLOYMENT TYPE, 2025-2035 (USD Billion) | |
      3. 7.17.3 BY END USER, 2025-2035 (USD Billion) | |
      4. 7.17.4 BY INDUSTRY, 2025-2035 (USD Billion) | |
      5. 7.17.5 BY COMPLIANCE STANDARDS, 2025-2035 (USD Billion) |
    164. 7.18 Malaysia MARKET SIZE ESTIMATES; FORECAST | |
      1. 7.18.1 BY SERVICE TYPE, 2025-2035 (USD Billion) | |
      2. 7.18.2 BY DEPLOYMENT TYPE, 2025-2035 (USD Billion) | |
      3. 7.18.3 BY END USER, 2025-2035 (USD Billion) | |
      4. 7.18.4 BY INDUSTRY, 2025-2035 (USD Billion) | |
      5. 7.18.5 BY COMPLIANCE STANDARDS, 2025-2035 (USD Billion) |
    165. 7.19 Thailand MARKET SIZE ESTIMATES; FORECAST | |
      1. 7.19.1 BY SERVICE TYPE, 2025-2035 (USD Billion) | |
      2. 7.19.2 BY DEPLOYMENT TYPE, 2025-2035 (USD Billion) | |
      3. 7.19.3 BY END USER, 2025-2035 (USD Billion) | |
      4. 7.19.4 BY INDUSTRY, 2025-2035 (USD Billion) | |
      5. 7.19.5 BY COMPLIANCE STANDARDS, 2025-2035 (USD Billion) |
    166. 7.20 Indonesia MARKET SIZE ESTIMATES; FORECAST | |
      1. 7.20.1 BY SERVICE TYPE, 2025-2035 (USD Billion) | |
      2. 7.20.2 BY DEPLOYMENT TYPE, 2025-2035 (USD Billion) | |
      3. 7.20.3 BY END USER, 2025-2035 (USD Billion) | |
      4. 7.20.4 BY INDUSTRY, 2025-2035 (USD Billion) | |
      5. 7.20.5 BY COMPLIANCE STANDARDS, 2025-2035 (USD Billion) |
    167. 7.21 Rest of APAC MARKET SIZE ESTIMATES; FORECAST | |
      1. 7.21.1 BY SERVICE TYPE, 2025-2035 (USD Billion) | |
      2. 7.21.2 BY DEPLOYMENT TYPE, 2025-2035 (USD Billion) | |
      3. 7.21.3 BY END USER, 2025-2035 (USD Billion) | |
      4. 7.21.4 BY INDUSTRY, 2025-2035 (USD Billion) | |
      5. 7.21.5 BY COMPLIANCE STANDARDS, 2025-2035 (USD Billion) |
    168. 7.22 South America MARKET SIZE ESTIMATES; FORECAST | |
      1. 7.22.1 BY SERVICE TYPE, 2025-2035 (USD Billion) | |
      2. 7.22.2 BY DEPLOYMENT TYPE, 2025-2035 (USD Billion) | |
      3. 7.22.3 BY END USER, 2025-2035 (USD Billion) | |
      4. 7.22.4 BY INDUSTRY, 2025-2035 (USD Billion) | |
      5. 7.22.5 BY COMPLIANCE STANDARDS, 2025-2035 (USD Billion) |
    169. 7.23 Brazil MARKET SIZE ESTIMATES; FORECAST | |
      1. 7.23.1 BY SERVICE TYPE, 2025-2035 (USD Billion) | |
      2. 7.23.2 BY DEPLOYMENT TYPE, 2025-2035 (USD Billion) | |
      3. 7.23.3 BY END USER, 2025-2035 (USD Billion) | |
      4. 7.23.4 BY INDUSTRY, 2025-2035 (USD Billion) | |
      5. 7.23.5 BY COMPLIANCE STANDARDS, 2025-2035 (USD Billion) |
    170. 7.24 Mexico MARKET SIZE ESTIMATES; FORECAST | |
      1. 7.24.1 BY SERVICE TYPE, 2025-2035 (USD Billion) | |
      2. 7.24.2 BY DEPLOYMENT TYPE, 2025-2035 (USD Billion) | |
      3. 7.24.3 BY END USER, 2025-2035 (USD Billion) | |
      4. 7.24.4 BY INDUSTRY, 2025-2035 (USD Billion) | |
      5. 7.24.5 BY COMPLIANCE STANDARDS, 2025-2035 (USD Billion) |
    171. 7.25 Argentina MARKET SIZE ESTIMATES; FORECAST | |
      1. 7.25.1 BY SERVICE TYPE, 2025-2035 (USD Billion) | |
      2. 7.25.2 BY DEPLOYMENT TYPE, 2025-2035 (USD Billion) | |
      3. 7.25.3 BY END USER, 2025-2035 (USD Billion) | |
      4. 7.25.4 BY INDUSTRY, 2025-2035 (USD Billion) | |
      5. 7.25.5 BY COMPLIANCE STANDARDS, 2025-2035 (USD Billion) |
    172. 7.26 Rest of South America MARKET SIZE ESTIMATES; FORECAST | |
      1. 7.26.1 BY SERVICE TYPE, 2025-2035 (USD Billion) | |
      2. 7.26.2 BY DEPLOYMENT TYPE, 2025-2035 (USD Billion) | |
      3. 7.26.3 BY END USER, 2025-2035 (USD Billion) | |
      4. 7.26.4 BY INDUSTRY, 2025-2035 (USD Billion) | |
      5. 7.26.5 BY COMPLIANCE STANDARDS, 2025-2035 (USD Billion) |
    173. 7.27 MEA MARKET SIZE ESTIMATES; FORECAST | |
      1. 7.27.1 BY SERVICE TYPE, 2025-2035 (USD Billion) | |
      2. 7.27.2 BY DEPLOYMENT TYPE, 2025-2035 (USD Billion) | |
      3. 7.27.3 BY END USER, 2025-2035 (USD Billion) | |
      4. 7.27.4 BY INDUSTRY, 2025-2035 (USD Billion) | |
      5. 7.27.5 BY COMPLIANCE STANDARDS, 2025-2035 (USD Billion) |
    174. 7.28 GCC Countries MARKET SIZE ESTIMATES; FORECAST | |
      1. 7.28.1 BY SERVICE TYPE, 2025-2035 (USD Billion) | |
      2. 7.28.2 BY DEPLOYMENT TYPE, 2025-2035 (USD Billion) | |
      3. 7.28.3 BY END USER, 2025-2035 (USD Billion) | |
      4. 7.28.4 BY INDUSTRY, 2025-2035 (USD Billion) | |
      5. 7.28.5 BY COMPLIANCE STANDARDS, 2025-2035 (USD Billion) |
    175. 7.29 South Africa MARKET SIZE ESTIMATES; FORECAST | |
      1. 7.29.1 BY SERVICE TYPE, 2025-2035 (USD Billion) | |
      2. 7.29.2 BY DEPLOYMENT TYPE, 2025-2035 (USD Billion) | |
      3. 7.29.3 BY END USER, 2025-2035 (USD Billion) | |
      4. 7.29.4 BY INDUSTRY, 2025-2035 (USD Billion) | |
      5. 7.29.5 BY COMPLIANCE STANDARDS, 2025-2035 (USD Billion) |
    176. 7.30 Rest of MEA MARKET SIZE ESTIMATES; FORECAST | |
      1. 7.30.1 BY SERVICE TYPE, 2025-2035 (USD Billion) | |
      2. 7.30.2 BY DEPLOYMENT TYPE, 2025-2035 (USD Billion) | |
      3. 7.30.3 BY END USER, 2025-2035 (USD Billion) | |
      4. 7.30.4 BY INDUSTRY, 2025-2035 (USD Billion) | |
      5. 7.30.5 BY COMPLIANCE STANDARDS, 2025-2035 (USD Billion) |
    177. 7.31 PRODUCT LAUNCH/PRODUCT DEVELOPMENT/APPROVAL | |
      1. 7.31.1 |
    178. 7.32 ACQUISITION/PARTNERSHIP | |

FAQs

What is the projected market valuation of the IT Service Continuity Maintenance Market by 2035?

The market is projected to reach a valuation of 25.0 USD Billion by 2035.

What was the overall market valuation of the IT Service Continuity Maintenance Market in 2024?

The overall market valuation was 12.5 USD Billion in 2024.

What is the expected CAGR for the IT Service Continuity Maintenance Market during the forecast period 2025 - 2035?

The expected CAGR for the market during this period is 6.5%.

Which companies are considered key players in the IT Service Continuity Maintenance Market?

Key players include IBM, Microsoft, Oracle, ServiceNow, and BMC Software.

What are the main service types in the IT Service Continuity Maintenance Market and their projected valuations?

Service types include Disaster Recovery Services, Backup Services, Business Continuity Planning, and Cloud Continuity Services, with valuations ranging from 2.5 to 8.0 USD Billion.

How does the market segment by deployment type look in terms of valuation?

The market segments by deployment type include On-Premises, Cloud-Based, and Hybrid, with projected valuations between 3.5 and 10.0 USD Billion.

What are the projected valuations for different end users in the IT Service Continuity Maintenance Market?

End users include IT Service Providers, Large Enterprises, Small and Medium Enterprises, and Government Organizations, with valuations from 2.5 to 8.0 USD Billion.

Which industries are expected to drive growth in the IT Service Continuity Maintenance Market?

Industries such as Healthcare, Finance, Telecommunications, and Manufacturing are projected to drive growth, with valuations ranging from 2.0 to 10.0 USD Billion.

What compliance standards are relevant in the IT Service Continuity Maintenance Market?

Relevant compliance standards include ISO 22301, ITIL, COBIT, and NIST, with projected valuations from 2.0 to 10.0 USD Billion.

How does the IT Service Continuity Maintenance Market's growth potential compare across different segments?

The market's growth potential varies across segments, with Cloud-Based services likely to see the highest demand, reflecting a shift towards digital solutions.

Author
Author
Author Profile
Shubham Munde LinkedIn
Team Lead - Research
Shubham brings over 7 years of expertise in Market Intelligence and Strategic Consulting, with a strong focus on the Automotive, Aerospace, and Defense sectors. Backed by a solid foundation in semiconductors, electronics, and software, he has successfully delivered high-impact syndicated and custom research on a global scale. His core strengths include market sizing, forecasting, competitive intelligence, consumer insights, and supply chain mapping. Widely recognized for developing scalable growth strategies, Shubham empowers clients to navigate complex markets and achieve a lasting competitive edge. Trusted by start-ups and Fortune 500 companies alike, he consistently converts challenges into strategic opportunities that drive sustainable growth.
Share::
Request Free Sample
Download Free Sample

Kindly complete the form below to receive a free sample of this Report

Share::
Request Free Sample
Download PDF ×

We do not share your information with anyone. However, we may send you emails based on your report interest from time to time. You may contact us at any time to opt-out.