Hero Background

Japan Disposable Nitrile Gloves Market

ID: MRFR/HC/51621-HCR
200 Pages
Rahul Gotadki
Last Updated: February 06, 2026
Japan Disposable Nitrile Gloves Market Research Report By Application (Medical, Industrial, Food Handling, Cleaning, Oil and Gas), By Type (Powdered, Powder-Free), By Grade (Examination Grade, Industrial Grade), and By Distribution Channel (Online, Offline) - Growth & Industry Forecast 2025 To 2035
Download PDF ×

We do not share your information with anyone. However, we may send you emails based on your report interest from time to time. You may contact us at any time to opt-out.

  1. 1 SECTION I: EXECUTIVE SUMMARY AND KEY HIGHLIGHTS
    1. 1.1 EXECUTIVE SUMMARY
      1. 1.1.1 Market Overview
      2. 1.1.2 Key Findings
      3. 1.1.3 Market Segmentation
      4. 1.1.4 Competitive Landscape
      5. 1.1.5 Challenges and Opportunities
      6. 1.1.6 Future Outlook
  2. 2 SECTION II: SCOPING, METHODOLOGY AND MARKET STRUCTURE
    1. 2.1 MARKET INTRODUCTION
      1. 2.1.1 Definition
      2. 2.1.2 Scope of the study
        1. 2.1.2.1 Research Objective
        2. 2.1.2.2 Assumption
        3. 2.1.2.3 Limitations
    2. 2.2 RESEARCH METHODOLOGY
      1. 2.2.1 Overview
      2. 2.2.2 Data Mining
      3. 2.2.3 Secondary Research
      4. 2.2.4 Primary Research
        1. 2.2.4.1 Primary Interviews and Information Gathering Process
        2. 2.2.4.2 Breakdown of Primary Respondents
      5. 2.2.5 Forecasting Model
      6. 2.2.6 Market Size Estimation
        1. 2.2.6.1 Bottom-Up Approach
        2. 2.2.6.2 Top-Down Approach
      7. 2.2.7 Data Triangulation
      8. 2.2.8 Validation
  3. 3 SECTION III: QUALITATIVE ANALYSIS
    1. 3.1 MARKET DYNAMICS
      1. 3.1.1 Overview
      2. 3.1.2 Drivers
      3. 3.1.3 Restraints
      4. 3.1.4 Opportunities
    2. 3.2 MARKET FACTOR ANALYSIS
      1. 3.2.1 Value chain Analysis
      2. 3.2.2 Porter's Five Forces Analysis
        1. 3.2.2.1 Bargaining Power of Suppliers
        2. 3.2.2.2 Bargaining Power of Buyers
        3. 3.2.2.3 Threat of New Entrants
        4. 3.2.2.4 Threat of Substitutes
        5. 3.2.2.5 Intensity of Rivalry
      3. 3.2.3 COVID-19 Impact Analysis
        1. 3.2.3.1 Market Impact Analysis
        2. 3.2.3.2 Regional Impact
        3. 3.2.3.3 Opportunity and Threat Analysis
  4. 4 SECTION IV: QUANTITATIVE ANALYSIS
    1. 4.1 Industrial Automation & Equipment, BY Application (USD Million)
      1. 4.1.1 Medical
      2. 4.1.2 Industrial
      3. 4.1.3 Food Handling
      4. 4.1.4 Cleaning
      5. 4.1.5 Oil and Gas
    2. 4.2 Industrial Automation & Equipment, BY Type (USD Million)
      1. 4.2.1 Powdered
      2. 4.2.2 Powder-Free
    3. 4.3 Industrial Automation & Equipment, BY Grade (USD Million)
      1. 4.3.1 Examination Grade
      2. 4.3.2 Industrial Grade
    4. 4.4 Industrial Automation & Equipment, BY Distribution Channel (USD Million)
      1. 4.4.1 Online
      2. 4.4.2 Offline
  5. 5 SECTION V: COMPETITIVE ANALYSIS
    1. 5.1 Competitive Landscape
      1. 5.1.1 Overview
      2. 5.1.2 Competitive Analysis
      3. 5.1.3 Market share Analysis
      4. 5.1.4 Major Growth Strategy in the Industrial Automation & Equipment
      5. 5.1.5 Competitive Benchmarking
      6. 5.1.6 Leading Players in Terms of Number of Developments in the Industrial Automation & Equipment
      7. 5.1.7 Key developments and growth strategies
        1. 5.1.7.1 New Product Launch/Service Deployment
        2. 5.1.7.2 Merger & Acquisitions
        3. 5.1.7.3 Joint Ventures
      8. 5.1.8 Major Players Financial Matrix
        1. 5.1.8.1 Sales and Operating Income
        2. 5.1.8.2 Major Players R&D Expenditure. 2023
    2. 5.2 Company Profiles
      1. 5.2.1 Top Glove (MY)
        1. 5.2.1.1 Financial Overview
        2. 5.2.1.2 Products Offered
        3. 5.2.1.3 Key Developments
        4. 5.2.1.4 SWOT Analysis
        5. 5.2.1.5 Key Strategies
      2. 5.2.2 Hartalega (MY)
        1. 5.2.2.1 Financial Overview
        2. 5.2.2.2 Products Offered
        3. 5.2.2.3 Key Developments
        4. 5.2.2.4 SWOT Analysis
        5. 5.2.2.5 Key Strategies
      3. 5.2.3 Kossan Rubber (MY)
        1. 5.2.3.1 Financial Overview
        2. 5.2.3.2 Products Offered
        3. 5.2.3.3 Key Developments
        4. 5.2.3.4 SWOT Analysis
        5. 5.2.3.5 Key Strategies
      4. 5.2.4 Ansell (AU)
        1. 5.2.4.1 Financial Overview
        2. 5.2.4.2 Products Offered
        3. 5.2.4.3 Key Developments
        4. 5.2.4.4 SWOT Analysis
        5. 5.2.4.5 Key Strategies
      5. 5.2.5 Semperit (AT)
        1. 5.2.5.1 Financial Overview
        2. 5.2.5.2 Products Offered
        3. 5.2.5.3 Key Developments
        4. 5.2.5.4 SWOT Analysis
        5. 5.2.5.5 Key Strategies
      6. 5.2.6 Supermax (MY)
        1. 5.2.6.1 Financial Overview
        2. 5.2.6.2 Products Offered
        3. 5.2.6.3 Key Developments
        4. 5.2.6.4 SWOT Analysis
        5. 5.2.6.5 Key Strategies
      7. 5.2.7 Rubberex (MY)
        1. 5.2.7.1 Financial Overview
        2. 5.2.7.2 Products Offered
        3. 5.2.7.3 Key Developments
        4. 5.2.7.4 SWOT Analysis
        5. 5.2.7.5 Key Strategies
      8. 5.2.8 Medline Industries (US)
        1. 5.2.8.1 Financial Overview
        2. 5.2.8.2 Products Offered
        3. 5.2.8.3 Key Developments
        4. 5.2.8.4 SWOT Analysis
        5. 5.2.8.5 Key Strategies
      9. 5.2.9 Dynarex (US)
        1. 5.2.9.1 Financial Overview
        2. 5.2.9.2 Products Offered
        3. 5.2.9.3 Key Developments
        4. 5.2.9.4 SWOT Analysis
        5. 5.2.9.5 Key Strategies
    3. 5.3 Appendix
      1. 5.3.1 References
      2. 5.3.2 Related Reports
  6. 6 LIST OF FIGURES
    1. 6.1 MARKET SYNOPSIS
    2. 6.2 JAPAN MARKET ANALYSIS BY APPLICATION
    3. 6.3 JAPAN MARKET ANALYSIS BY TYPE
    4. 6.4 JAPAN MARKET ANALYSIS BY GRADE
    5. 6.5 JAPAN MARKET ANALYSIS BY DISTRIBUTION CHANNEL
    6. 6.6 KEY BUYING CRITERIA OF INDUSTRIAL AUTOMATION & EQUIPMENT
    7. 6.7 RESEARCH PROCESS OF MRFR
    8. 6.8 DRO ANALYSIS OF INDUSTRIAL AUTOMATION & EQUIPMENT
    9. 6.9 DRIVERS IMPACT ANALYSIS: INDUSTRIAL AUTOMATION & EQUIPMENT
    10. 6.10 RESTRAINTS IMPACT ANALYSIS: INDUSTRIAL AUTOMATION & EQUIPMENT
    11. 6.11 SUPPLY / VALUE CHAIN: INDUSTRIAL AUTOMATION & EQUIPMENT
    12. 6.12 INDUSTRIAL AUTOMATION & EQUIPMENT, BY APPLICATION, 2024 (% SHARE)
    13. 6.13 INDUSTRIAL AUTOMATION & EQUIPMENT, BY APPLICATION, 2024 TO 2035 (USD Million)
    14. 6.14 INDUSTRIAL AUTOMATION & EQUIPMENT, BY TYPE, 2024 (% SHARE)
    15. 6.15 INDUSTRIAL AUTOMATION & EQUIPMENT, BY TYPE, 2024 TO 2035 (USD Million)
    16. 6.16 INDUSTRIAL AUTOMATION & EQUIPMENT, BY GRADE, 2024 (% SHARE)
    17. 6.17 INDUSTRIAL AUTOMATION & EQUIPMENT, BY GRADE, 2024 TO 2035 (USD Million)
    18. 6.18 INDUSTRIAL AUTOMATION & EQUIPMENT, BY DISTRIBUTION CHANNEL, 2024 (% SHARE)
    19. 6.19 INDUSTRIAL AUTOMATION & EQUIPMENT, BY DISTRIBUTION CHANNEL, 2024 TO 2035 (USD Million)
    20. 6.20 BENCHMARKING OF MAJOR COMPETITORS
  7. 7 LIST OF TABLES
    1. 7.1 LIST OF ASSUMPTIONS
  8. 7.1.1
    1. 7.2 Japan MARKET SIZE ESTIMATES; FORECAST
      1. 7.2.1 BY APPLICATION, 2025-2035 (USD Million)
      2. 7.2.2 BY TYPE, 2025-2035 (USD Million)
      3. 7.2.3 BY GRADE, 2025-2035 (USD Million)
      4. 7.2.4 BY DISTRIBUTION CHANNEL, 2025-2035 (USD Million)
    2. 7.3 PRODUCT LAUNCH/PRODUCT DEVELOPMENT/APPROVAL
  9. 7.3.1
    1. 7.4 ACQUISITION/PARTNERSHIP
  10. 7.4.1

Japan Industrial Automation & Equipment Market Segmentation

Industrial Automation & Equipment By Application (USD Million, 2025-2035)
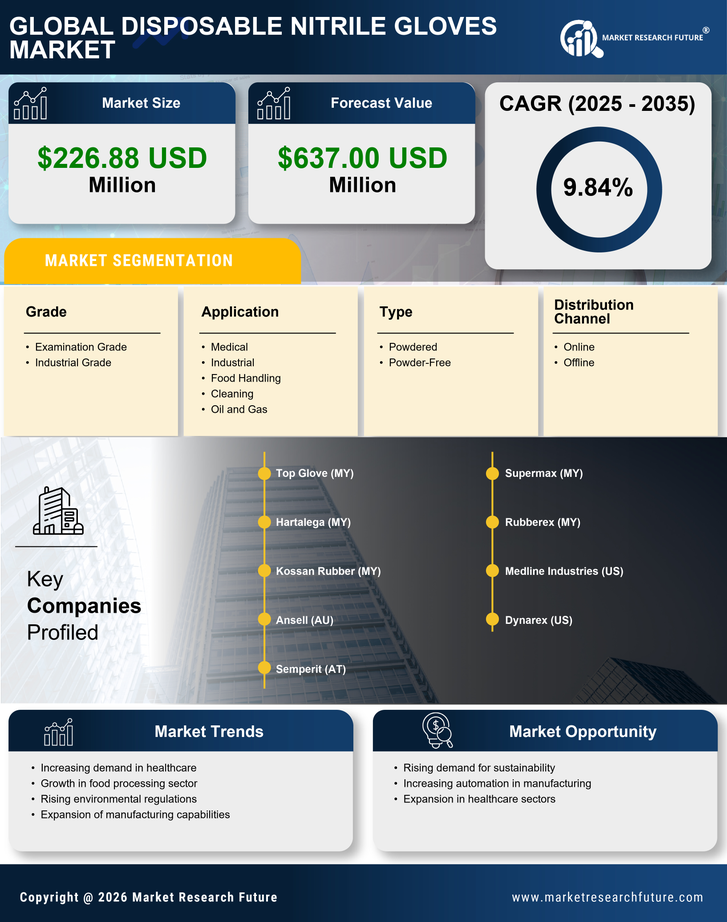
  • Medical
  • Industrial
  • Food Handling
  • Cleaning
  • Oil and Gas

Industrial Automation & Equipment By Type (USD Million, 2025-2035)

  • Powdered
  • Powder-Free

Industrial Automation & Equipment By Grade (USD Million, 2025-2035)

  • Examination Grade
  • Industrial Grade

Industrial Automation & Equipment By Distribution Channel (USD Million, 2025-2035)

  • Online
  • Offline