Request Free Sample ×

Kindly complete the form below to receive a free sample of this Report

* Please use a valid business email

Leading companies partner with us for data-driven Insights

clients tt-cursor
Hero Background

Japan Downstream Processing Market

ID: MRFR/MED/49881-HCR
200 Pages
Rahul Gotadki
Last Updated: April 24, 2026
Japan Downstream Processing Market Research Report: Size, Share, Trend Analysis By Applications (Biopharmaceuticals, Food and Beverage, Water and Wastewater Treatment, Biofuels, Cosmetics), By Technique (Chromatography, Filtration, Ultrafiltration, Centrifugation, Precipitation), By Product (Reagents, Equipment, Consumables, Membranes, Filters) andBy End Use (Pharmaceutical, Biotechnology, Food Industry, Environmental, Cosmetic Industry) - Growth Outlook & Industry Forecast 2025 To 2035
Download PDF ×

We do not share your information with anyone. However, we may send you emails based on your report interest from time to time. You may contact us at any time to opt-out.

  1. 1 SECTION I: EXECUTIVE SUMMARY AND KEY HIGHLIGHTS
    1. 1.1 EXECUTIVE SUMMARY
      1. 1.1.1 Market Overview
      2. 1.1.2 Key Findings
      3. 1.1.3 Market Segmentation
      4. 1.1.4 Competitive Landscape
      5. 1.1.5 Challenges and Opportunities
      6. 1.1.6 Future Outlook
  2. 2 SECTION II: SCOPING, METHODOLOGY AND MARKET STRUCTURE
    1. 2.1 MARKET INTRODUCTION
      1. 2.1.1 Definition
      2. 2.1.2 Scope of the study
        1. 2.1.2.1 Research Objective
        2. 2.1.2.2 Assumption
        3. 2.1.2.3 Limitations
    2. 2.2 RESEARCH METHODOLOGY
      1. 2.2.1 Overview
      2. 2.2.2 Data Mining
      3. 2.2.3 Secondary Research
      4. 2.2.4 Primary Research
        1. 2.2.4.1 Primary Interviews and Information Gathering Process
        2. 2.2.4.2 Breakdown of Primary Respondents
      5. 2.2.5 Forecasting Model
      6. 2.2.6 Market Size Estimation
        1. 2.2.6.1 Bottom-Up Approach
        2. 2.2.6.2 Top-Down Approach
      7. 2.2.7 Data Triangulation
      8. 2.2.8 Validation
  3. 3 SECTION III: QUALITATIVE ANALYSIS
    1. 3.1 MARKET DYNAMICS
      1. 3.1.1 Overview
      2. 3.1.2 Drivers
      3. 3.1.3 Restraints
      4. 3.1.4 Opportunities
    2. 3.2 MARKET FACTOR ANALYSIS
      1. 3.2.1 Value chain Analysis
      2. 3.2.2 Porter's Five Forces Analysis
        1. 3.2.2.1 Bargaining Power of Suppliers
        2. 3.2.2.2 Bargaining Power of Buyers
        3. 3.2.2.3 Threat of New Entrants
        4. 3.2.2.4 Threat of Substitutes
        5. 3.2.2.5 Intensity of Rivalry
      3. 3.2.3 COVID-19 Impact Analysis
        1. 3.2.3.1 Market Impact Analysis
        2. 3.2.3.2 Regional Impact
        3. 3.2.3.3 Opportunity and Threat Analysis
  4. 4 SECTION IV: QUANTITATIVE ANALYSIS
    1. 4.1 Food, Beverages & Nutrition, BY Application (USD Million)
      1. 4.1.1 Biopharmaceuticals
      2. 4.1.2 Food and Beverage
      3. 4.1.3 Water and Wastewater Treatment
      4. 4.1.4 Biofuels
      5. 4.1.5 Cosmetics
    2. 4.2 Food, Beverages & Nutrition, BY Technique (USD Million)
      1. 4.2.1 Chromatography
      2. 4.2.2 Filtration
      3. 4.2.3 Ultrafiltration
      4. 4.2.4 Centrifugation
      5. 4.2.5 Precipitation
    3. 4.3 Food, Beverages & Nutrition, BY Product (USD Million)
      1. 4.3.1 Reagents
      2. 4.3.2 Equipment
      3. 4.3.3 Consumables
      4. 4.3.4 Membranes
      5. 4.3.5 Filters
    4. 4.4 Food, Beverages & Nutrition, BY End Use (USD Million)
      1. 4.4.1 Pharmaceutical
      2. 4.4.2 Biotechnology
      3. 4.4.3 Food Industry
      4. 4.4.4 Environmental
      5. 4.4.5 Cosmetic Industry
  5. 5 SECTION V: COMPETITIVE ANALYSIS
    1. 5.1 Competitive Landscape
      1. 5.1.1 Overview
      2. 5.1.2 Competitive Analysis
      3. 5.1.3 Market share Analysis
      4. 5.1.4 Major Growth Strategy in the Food, Beverages & Nutrition
      5. 5.1.5 Competitive Benchmarking
      6. 5.1.6 Leading Players in Terms of Number of Developments in the Food, Beverages & Nutrition
      7. 5.1.7 Key developments and growth strategies
        1. 5.1.7.1 New Product Launch/Service Deployment
        2. 5.1.7.2 Merger & Acquisitions
        3. 5.1.7.3 Joint Ventures
      8. 5.1.8 Major Players Financial Matrix
        1. 5.1.8.1 Sales and Operating Income
        2. 5.1.8.2 Major Players R&D Expenditure. 2023
    2. 5.2 Company Profiles
      1. 5.2.1 Thermo Fisher Scientific (US)
        1. 5.2.1.1 Financial Overview
        2. 5.2.1.2 Products Offered
        3. 5.2.1.3 Key Developments
        4. 5.2.1.4 SWOT Analysis
        5. 5.2.1.5 Key Strategies
      2. 5.2.2 Merck KGaA (DE)
        1. 5.2.2.1 Financial Overview
        2. 5.2.2.2 Products Offered
        3. 5.2.2.3 Key Developments
        4. 5.2.2.4 SWOT Analysis
        5. 5.2.2.5 Key Strategies
      3. 5.2.3 GE Healthcare (US)
        1. 5.2.3.1 Financial Overview
        2. 5.2.3.2 Products Offered
        3. 5.2.3.3 Key Developments
        4. 5.2.3.4 SWOT Analysis
        5. 5.2.3.5 Key Strategies
      4. 5.2.4 Danaher Corporation (US)
        1. 5.2.4.1 Financial Overview
        2. 5.2.4.2 Products Offered
        3. 5.2.4.3 Key Developments
        4. 5.2.4.4 SWOT Analysis
        5. 5.2.4.5 Key Strategies
      5. 5.2.5 Sartorius AG (DE)
        1. 5.2.5.1 Financial Overview
        2. 5.2.5.2 Products Offered
        3. 5.2.5.3 Key Developments
        4. 5.2.5.4 SWOT Analysis
        5. 5.2.5.5 Key Strategies
      6. 5.2.6 Eppendorf AG (DE)
        1. 5.2.6.1 Financial Overview
        2. 5.2.6.2 Products Offered
        3. 5.2.6.3 Key Developments
        4. 5.2.6.4 SWOT Analysis
        5. 5.2.6.5 Key Strategies
      7. 5.2.7 Pall Corporation (US)
        1. 5.2.7.1 Financial Overview
        2. 5.2.7.2 Products Offered
        3. 5.2.7.3 Key Developments
        4. 5.2.7.4 SWOT Analysis
        5. 5.2.7.5 Key Strategies
      8. 5.2.8 Boehringer Ingelheim (DE)
        1. 5.2.8.1 Financial Overview
        2. 5.2.8.2 Products Offered
        3. 5.2.8.3 Key Developments
        4. 5.2.8.4 SWOT Analysis
        5. 5.2.8.5 Key Strategies
    3. 5.3 Appendix
      1. 5.3.1 References
      2. 5.3.2 Related Reports
  6. 6 LIST OF FIGURES
    1. 6.1 MARKET SYNOPSIS
    2. 6.2 JAPAN MARKET ANALYSIS BY APPLICATION
    3. 6.3 JAPAN MARKET ANALYSIS BY TECHNIQUE
    4. 6.4 JAPAN MARKET ANALYSIS BY PRODUCT
    5. 6.5 JAPAN MARKET ANALYSIS BY END USE
    6. 6.6 KEY BUYING CRITERIA OF FOOD, BEVERAGES & NUTRITION
    7. 6.7 RESEARCH PROCESS OF MRFR
    8. 6.8 DRO ANALYSIS OF FOOD, BEVERAGES & NUTRITION
    9. 6.9 DRIVERS IMPACT ANALYSIS: FOOD, BEVERAGES & NUTRITION
    10. 6.10 RESTRAINTS IMPACT ANALYSIS: FOOD, BEVERAGES & NUTRITION
    11. 6.11 SUPPLY / VALUE CHAIN: FOOD, BEVERAGES & NUTRITION
    12. 6.12 FOOD, BEVERAGES & NUTRITION, BY APPLICATION, 2024 (% SHARE)
    13. 6.13 FOOD, BEVERAGES & NUTRITION, BY APPLICATION, 2024 TO 2035 (USD Million)
    14. 6.14 FOOD, BEVERAGES & NUTRITION, BY TECHNIQUE, 2024 (% SHARE)
    15. 6.15 FOOD, BEVERAGES & NUTRITION, BY TECHNIQUE, 2024 TO 2035 (USD Million)
    16. 6.16 FOOD, BEVERAGES & NUTRITION, BY PRODUCT, 2024 (% SHARE)
    17. 6.17 FOOD, BEVERAGES & NUTRITION, BY PRODUCT, 2024 TO 2035 (USD Million)
    18. 6.18 FOOD, BEVERAGES & NUTRITION, BY END USE, 2024 (% SHARE)
    19. 6.19 FOOD, BEVERAGES & NUTRITION, BY END USE, 2024 TO 2035 (USD Million)
    20. 6.20 BENCHMARKING OF MAJOR COMPETITORS
  7. 7 LIST OF TABLES
    1. 7.1 LIST OF ASSUMPTIONS
  8. 7.1.1
    1. 7.2 Japan MARKET SIZE ESTIMATES; FORECAST
      1. 7.2.1 BY APPLICATION, 2025-2035 (USD Million)
      2. 7.2.2 BY TECHNIQUE, 2025-2035 (USD Million)
      3. 7.2.3 BY PRODUCT, 2025-2035 (USD Million)
      4. 7.2.4 BY END USE, 2025-2035 (USD Million)
    2. 7.3 PRODUCT LAUNCH/PRODUCT DEVELOPMENT/APPROVAL
  9. 7.3.1
    1. 7.4 ACQUISITION/PARTNERSHIP
  10. 7.4.1

Japan Food, Beverages & Nutrition Market Segmentation

Food, Beverages & Nutrition By Application (USD Million, 2025-2035)
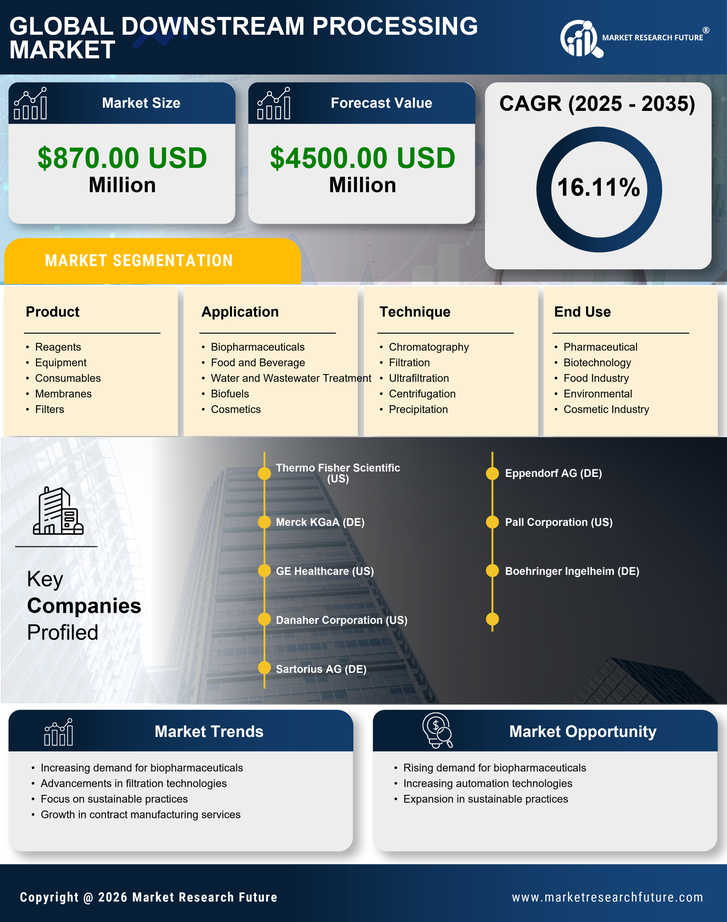
  • Biopharmaceuticals
  • Food and Beverage
  • Water and Wastewater Treatment
  • Biofuels
  • Cosmetics

Food, Beverages & Nutrition By Technique (USD Million, 2025-2035)

  • Chromatography
  • Filtration
  • Ultrafiltration
  • Centrifugation
  • Precipitation

Food, Beverages & Nutrition By Product (USD Million, 2025-2035)

  • Reagents
  • Equipment
  • Consumables
  • Membranes
  • Filters

Food, Beverages & Nutrition By End Use (USD Million, 2025-2035)

  • Pharmaceutical
  • Biotechnology
  • Food Industry
  • Environmental
  • Cosmetic Industry