Request Free Sample ×

Kindly complete the form below to receive a free sample of this Report

* Please use a valid business email

Leading companies partner with us for data-driven Insights

clients tt-cursor
Hero Background

Japan Matcha Tea Market

ID: MRFR/FnB/44760-HCR
128 Pages
Garvit Vyas
Last Updated: April 06, 2026
Japan Matcha Tea Market Size, Share, Industry Trend & Analysis Research Report: By Application (Regular Tea, Food, Cosmetics, Matcha Beverages, Personal Market), By Form (Ready-To-Drink, Instant Premixes, Powder Form), By Type (Traditional, Sweetened, Unsweetened), By Formulation (Plain, Flavored) andBy Distribution Channel (Store-Based Distribution Channels, Non-Store-Based Distribution Channels)- Forecast to 2035
Download PDF ×

We do not share your information with anyone. However, we may send you emails based on your report interest from time to time. You may contact us at any time to opt-out.

  1. 1 SECTION I: EXECUTIVE SUMMARY AND KEY HIGHLIGHTS
    1. 1.1 EXECUTIVE SUMMARY
      1. 1.1.1 Market Overview
      2. 1.1.2 Key Findings
      3. 1.1.3 Market Segmentation
      4. 1.1.4 Competitive Landscape
      5. 1.1.5 Challenges and Opportunities
      6. 1.1.6 Future Outlook
  2. 2 SECTION II: SCOPING, METHODOLOGY AND MARKET STRUCTURE
    1. 2.1 MARKET INTRODUCTION
      1. 2.1.1 Definition
      2. 2.1.2 Scope of the study
        1. 2.1.2.1 Research Objective
        2. 2.1.2.2 Assumption
        3. 2.1.2.3 Limitations
    2. 2.2 RESEARCH METHODOLOGY
      1. 2.2.1 Overview
      2. 2.2.2 Data Mining
      3. 2.2.3 Secondary Research
      4. 2.2.4 Primary Research
        1. 2.2.4.1 Primary Interviews and Information Gathering Process
        2. 2.2.4.2 Breakdown of Primary Respondents
      5. 2.2.5 Forecasting Model
      6. 2.2.6 Market Size Estimation
        1. 2.2.6.1 Bottom-Up Approach
        2. 2.2.6.2 Top-Down Approach
      7. 2.2.7 Data Triangulation
      8. 2.2.8 Validation
  3. 3 SECTION III: QUALITATIVE ANALYSIS
    1. 3.1 MARKET DYNAMICS
      1. 3.1.1 Overview
      2. 3.1.2 Drivers
      3. 3.1.3 Restraints
      4. 3.1.4 Opportunities
    2. 3.2 MARKET FACTOR ANALYSIS
      1. 3.2.1 Value chain Analysis
      2. 3.2.2 Porter's Five Forces Analysis
        1. 3.2.2.1 Bargaining Power of Suppliers
        2. 3.2.2.2 Bargaining Power of Buyers
        3. 3.2.2.3 Threat of New Entrants
        4. 3.2.2.4 Threat of Substitutes
        5. 3.2.2.5 Intensity of Rivalry
      3. 3.2.3 COVID-19 Impact Analysis
        1. 3.2.3.1 Market Impact Analysis
        2. 3.2.3.2 Regional Impact
        3. 3.2.3.3 Opportunity and Threat Analysis
  4. 4 SECTION IV: QUANTITATIVE ANALYSIS
    1. 4.1 Chemicals and Materials, BY Application (USD Million)
      1. 4.1.1 Regular Tea
      2. 4.1.2 Food
      3. 4.1.3 Cosmetics
      4. 4.1.4 Matcha Beverages
      5. 4.1.5 Personal Market
    2. 4.2 Chemicals and Materials, BY Form (USD Million)
      1. 4.2.1 Ready-To-Drink
      2. 4.2.2 Instant Premixes
      3. 4.2.3 Powder Form
    3. 4.3 Chemicals and Materials, BY Type (USD Million)
      1. 4.3.1 Traditional
      2. 4.3.2 Sweetened
      3. 4.3.3 Unsweetened
    4. 4.4 Chemicals and Materials, BY Formulation (USD Million)
      1. 4.4.1 Plain
      2. 4.4.2 Flavored
    5. 4.5 Chemicals and Materials, BY Distribution Channel (USD Million)
      1. 4.5.1 Store-Based Distribution Channels
      2. 4.5.2 Non-Store-Based Distribution Channels
  5. 5 SECTION V: COMPETITIVE ANALYSIS
    1. 5.1 Competitive Landscape
      1. 5.1.1 Overview
      2. 5.1.2 Competitive Analysis
      3. 5.1.3 Market share Analysis
      4. 5.1.4 Major Growth Strategy in the Chemicals and Materials
      5. 5.1.5 Competitive Benchmarking
      6. 5.1.6 Leading Players in Terms of Number of Developments in the Chemicals and Materials
      7. 5.1.7 Key developments and growth strategies
        1. 5.1.7.1 New Product Launch/Service Deployment
        2. 5.1.7.2 Merger & Acquisitions
        3. 5.1.7.3 Joint Ventures
      8. 5.1.8 Major Players Financial Matrix
        1. 5.1.8.1 Sales and Operating Income
        2. 5.1.8.2 Major Players R&D Expenditure. 2023
    2. 5.2 Company Profiles
      1. 5.2.1 Ippodo Tea Co (JP)
        1. 5.2.1.1 Financial Overview
        2. 5.2.1.2 Products Offered
        3. 5.2.1.3 Key Developments
        4. 5.2.1.4 SWOT Analysis
        5. 5.2.1.5 Key Strategies
      2. 5.2.2 Matcha Konomi (JP)
        1. 5.2.2.1 Financial Overview
        2. 5.2.2.2 Products Offered
        3. 5.2.2.3 Key Developments
        4. 5.2.2.4 SWOT Analysis
        5. 5.2.2.5 Key Strategies
      3. 5.2.3 Encha (US)
        1. 5.2.3.1 Financial Overview
        2. 5.2.3.2 Products Offered
        3. 5.2.3.3 Key Developments
        4. 5.2.3.4 SWOT Analysis
        5. 5.2.3.5 Key Strategies
      4. 5.2.4 Aiya (JP)
        1. 5.2.4.1 Financial Overview
        2. 5.2.4.2 Products Offered
        3. 5.2.4.3 Key Developments
        4. 5.2.4.4 SWOT Analysis
        5. 5.2.4.5 Key Strategies
      5. 5.2.5 Jade Leaf Matcha (US)
        1. 5.2.5.1 Financial Overview
        2. 5.2.5.2 Products Offered
        3. 5.2.5.3 Key Developments
        4. 5.2.5.4 SWOT Analysis
        5. 5.2.5.5 Key Strategies
      6. 5.2.6 Kiss Me Organics (US)
        1. 5.2.6.1 Financial Overview
        2. 5.2.6.2 Products Offered
        3. 5.2.6.3 Key Developments
        4. 5.2.6.4 SWOT Analysis
        5. 5.2.6.5 Key Strategies
      7. 5.2.7 The Matcha Maiden (US)
        1. 5.2.7.1 Financial Overview
        2. 5.2.7.2 Products Offered
        3. 5.2.7.3 Key Developments
        4. 5.2.7.4 SWOT Analysis
        5. 5.2.7.5 Key Strategies
      8. 5.2.8 Matchaful (US)
        1. 5.2.8.1 Financial Overview
        2. 5.2.8.2 Products Offered
        3. 5.2.8.3 Key Developments
        4. 5.2.8.4 SWOT Analysis
        5. 5.2.8.5 Key Strategies
    3. 5.3 Appendix
      1. 5.3.1 References
      2. 5.3.2 Related Reports
  6. 6 LIST OF FIGURES
    1. 6.1 MARKET SYNOPSIS
    2. 6.2 JAPAN MARKET ANALYSIS BY APPLICATION
    3. 6.3 JAPAN MARKET ANALYSIS BY FORM
    4. 6.4 JAPAN MARKET ANALYSIS BY TYPE
    5. 6.5 JAPAN MARKET ANALYSIS BY FORMULATION
    6. 6.6 JAPAN MARKET ANALYSIS BY DISTRIBUTION CHANNEL
    7. 6.7 KEY BUYING CRITERIA OF CHEMICALS AND MATERIALS
    8. 6.8 RESEARCH PROCESS OF MRFR
    9. 6.9 DRO ANALYSIS OF CHEMICALS AND MATERIALS
    10. 6.10 DRIVERS IMPACT ANALYSIS: CHEMICALS AND MATERIALS
    11. 6.11 RESTRAINTS IMPACT ANALYSIS: CHEMICALS AND MATERIALS
    12. 6.12 SUPPLY / VALUE CHAIN: CHEMICALS AND MATERIALS
    13. 6.13 CHEMICALS AND MATERIALS, BY APPLICATION, 2024 (% SHARE)
    14. 6.14 CHEMICALS AND MATERIALS, BY APPLICATION, 2024 TO 2035 (USD Million)
    15. 6.15 CHEMICALS AND MATERIALS, BY FORM, 2024 (% SHARE)
    16. 6.16 CHEMICALS AND MATERIALS, BY FORM, 2024 TO 2035 (USD Million)
    17. 6.17 CHEMICALS AND MATERIALS, BY TYPE, 2024 (% SHARE)
    18. 6.18 CHEMICALS AND MATERIALS, BY TYPE, 2024 TO 2035 (USD Million)
    19. 6.19 CHEMICALS AND MATERIALS, BY FORMULATION, 2024 (% SHARE)
    20. 6.20 CHEMICALS AND MATERIALS, BY FORMULATION, 2024 TO 2035 (USD Million)
    21. 6.21 CHEMICALS AND MATERIALS, BY DISTRIBUTION CHANNEL, 2024 (% SHARE)
    22. 6.22 CHEMICALS AND MATERIALS, BY DISTRIBUTION CHANNEL, 2024 TO 2035 (USD Million)
    23. 6.23 BENCHMARKING OF MAJOR COMPETITORS
  7. 7 LIST OF TABLES
    1. 7.1 LIST OF ASSUMPTIONS
  8. 7.1.1
    1. 7.2 Japan MARKET SIZE ESTIMATES; FORECAST
      1. 7.2.1 BY APPLICATION, 2025-2035 (USD Million)
      2. 7.2.2 BY FORM, 2025-2035 (USD Million)
      3. 7.2.3 BY TYPE, 2025-2035 (USD Million)
      4. 7.2.4 BY FORMULATION, 2025-2035 (USD Million)
      5. 7.2.5 BY DISTRIBUTION CHANNEL, 2025-2035 (USD Million)
    2. 7.3 PRODUCT LAUNCH/PRODUCT DEVELOPMENT/APPROVAL
  9. 7.3.1
    1. 7.4 ACQUISITION/PARTNERSHIP
  10. 7.4.1

Japan Chemicals and Materials Market Segmentation

Chemicals and Materials By Application (USD Million, 2025-2035)
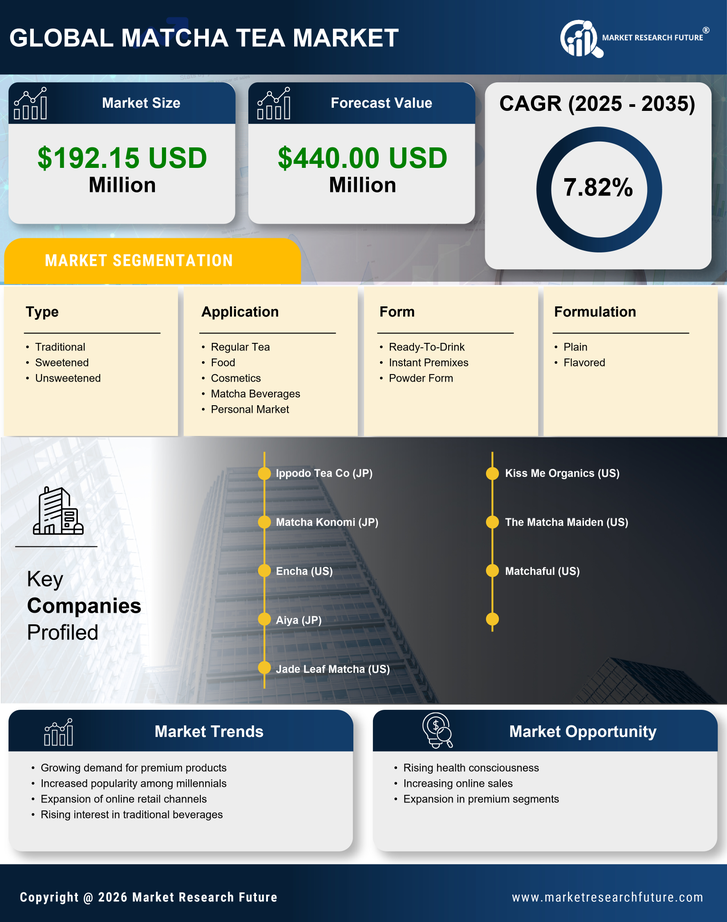
  • Regular Tea
  • Food
  • Cosmetics
  • Matcha Beverages
  • Personal Market

Chemicals and Materials By Form (USD Million, 2025-2035)

  • Ready-To-Drink
  • Instant Premixes
  • Powder Form

Chemicals and Materials By Type (USD Million, 2025-2035)

  • Traditional
  • Sweetened
  • Unsweetened

Chemicals and Materials By Formulation (USD Million, 2025-2035)

  • Plain
  • Flavored

Chemicals and Materials By Distribution Channel (USD Million, 2025-2035)

  • Store-Based Distribution Channels
  • Non-Store-Based Distribution Channels