Knee replacement Market (2026 - 2035)

Knee Replacement Market Research Report By Procedure (Total Knee Replacement, Partial Knee Replacement, Revision Knee Replacement), By Material (Metal Alloy, Ceramic, Polyethylene, Cemented, Cementless), By End User (Hospitals, Ambulatory Surgical Centers, Specialty Clinics), By Age Group (Under 50, 50-65, Above 65) and By Regional (North America, Europe, South America, Asia Pacific, Middle East and Africa) - Growth & Industry Forecast 2025 To 2035
ID: MRFR/MED/1049-HCR
200 Pages
Nidhi Mandole, Rahul Gotadki
Last Updated: June 27, 2026
Knee replacement Market
Market Size
Forecast Period2026-2035
CAGR (2026-2035)4.69%
2025 Market SizeUSD 13.17 Billion
2035 Market SizeUSD 20.83 Billion
Key Players
Zimmer Biomet Holdings
Stryker Corporation
DePuy Synthes
Smith & Nephew
Medacta International
ConforMIS
Opportunities
  • Personalized 3D-Printed Implant Systems
  • Smart Implants with Embedded Sensor Technology
  • Emerging-Market Surgical Volume Expansion

Knee replacement Market Summary

The Global Knee Replacement Market size was valued at USD 13.17 Billion in 2025, and the market is projected to grow from USD 13.79 Billion in 2026 to USD 20.83 Billion by 2035, registering a CAGR of 4.69% during the forecast period 2026–2035. This trajectory is propelled by two powerful forces: a global population aged 65 and older that the United Nations projects will surpass 1.6 billion by 2050 [1], and obesity rates that the WHO estimates now affect more than 890 million adults worldwide [2]. Governments from the US to Japan have responded by extending reimbursement coverage for outpatient joint procedures, making surgery accessible to a wider patient pool.

Technology is changing how surgeons do knee replacements. Robotic-assisted platforms are no longer the exclusive domain of top academic facilities. They are already being embraced by mid-tier hospitals and ambulatory surgical clinics seeking finer alignment tolerances and shorter recovery windows. Global capital expenditure on these systems approached USD 1.8 billion in 2024 [3]. OEMs are coupling hardware with AI-enabled preoperative planning software that maps patient-specific implant location. The biggest clinical change to the Knee Replacement Market in the past decade has been the move from entirely manual instruments to workflows supported by digital technology.


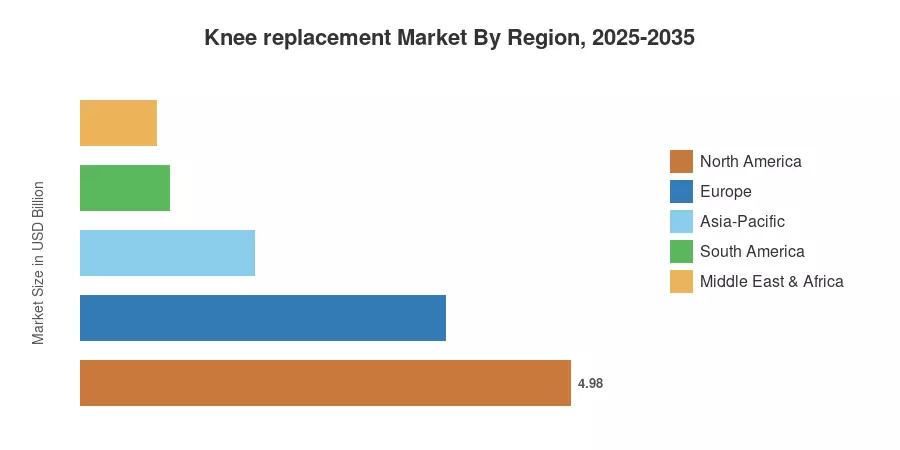
North America is the anchor, with the US Medicare population and strong private payer reimbursement arrangements, accounting for around 37.8% of global income. Asia-Pacific is the fastest-growing region at a CAGR of 13.45%. The growth in this region is driven by the rising healthcare insurance mandate in China and the Ayushman Bharat program by India, which now covers joint replacement treatments. Europe takes the second biggest proportion at around 28.2%, backed by aging demographics in Germany, France and the Nordic countries. The Knee Replacement Market is set to experience sustained, innovation-driven growth through 2035 with the increasing adoption of value-based care models in both developed and emerging economies.


Key Report Takeaways

• By Product

  • Total knee replacement systems accounted for 65.5% of the Knee Replacement Market in 2025, reflecting sustained preference among surgeons for full condylar solutions.
  • Partial knee replacement procedures are expanding at a 5.95% CAGR through 2035, benefiting from improved patient selection criteria and longer survivorship data.
  • Patellofemoral replacement remains a niche segment, generating approximately USD 0.42 billion in 2025.

• By Surgical Technology

  • Manual surgical techniques retained 48.0% revenue share in 2025, though their dominance is eroding as hospitals invest in guided platforms.
  • Robotic-assisted procedures are the fastest-growing technology segment in the Knee Replacement Market, tracking an 11.85% CAGR.

• By End User

  • Hospitals controlled 57.5% of end-user revenue in 2025, benefiting from complex revision case volumes.
  • Ambulatory surgical centers are forecast to grow at a 9.25% CAGR, driven by same-day discharge protocols and bundled payment incentives.

• By Geography

  • North America led the Knee Replacement Market with a 37.8% share, underpinned by Medicare reimbursement reforms.
  • Asia-Pacific is projected to record a 13.45% CAGR, making it the fastest-growing geography through 2035.


Market Size and Forecast (2021–2035)

Market Research Future (MRFR)'s estimates blend bottom-up device-level revenue analysis with top-down macroeconomic and demographic modeling. Historical statistics (2021–2024) are derived from manufacturer filings, hospital procurement databases, and national joint registry publications. Forecast forecasts (2026-2035) incorporate implant adoption curves, reimbursement trajectory models and surgical volume growth rates across five geographical regions.
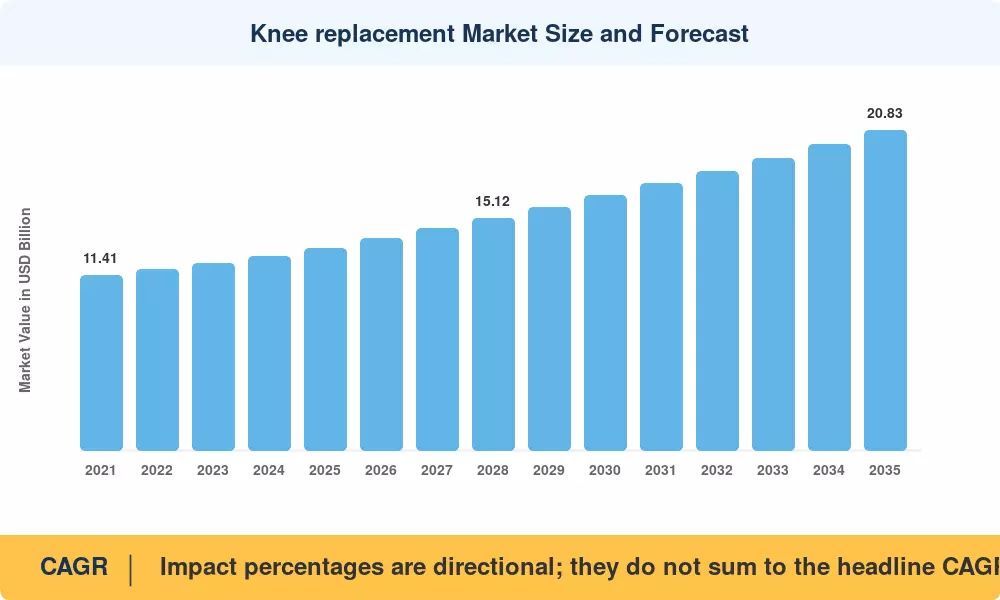
Knee replacement Market Size and Forecast
Our Impact
Enabled $4.3B Revenue Impact for Fortune 500 and Leading Multinationals
Partnering with 2000+ Global Organizations Each Year
30K+ Citations by Top-Tier Firms in the Industry

Driver Impact Analysis

Driver ~% Impact on CAGR Geographic Relevance Impact Timeline
Aging global population (65+) ~28% Global Long-term (≥4 yr)
Rising obesity and osteoarthritis prevalence ~22% North America, Europe Long-term (≥4 yr)
Robotic-assisted surgery adoption ~18% North America, Asia-Pacific Medium-term (2–4 yr)
Outpatient / ASC reimbursement reforms ~14% North America Short-term (≤2 yr)
Emerging-market healthcare insurance expansion ~10% Asia-Pacific, South America Medium-term (2–4 yr)
AI-driven preoperative planning integration ~5% North America, Europe Short-term (≤2 yr)
Cementless and 3D-printed implant innovation ~3% Global Long-term (≥4 yr)


Aging Population and Osteoarthritis Burden

The World Health Organization estimates that more than 528 million people worldwide lived with osteoarthritis in 2019, a figure that has grown by over 113% since 1990 [2]. Knee osteoarthritis accounts for the largest share of that burden, and the correlation with age is stark — incidence roughly doubles with each decade of life after 45. As the global 65+ population swells, the volume of patients reaching end-stage joint degeneration is expected to strain surgical capacity in every major geography. In the United States alone, the American Joint Replacement Registry projects primary knee procedures could exceed 3.5 million per year by 2030 [10].

Robotic-Assisted Surgical Platforms

Capital investment in robotic knee surgery systems has become a competitive differentiator for hospital systems. Stryker's Mako platform has surpassed 3,000 cumulative installations globally [5], while Zimmer Biomet's ROSA and Smith & Nephew's CORI systems are rapidly gaining traction in mid-tier facilities. Clinical registries report that robotic-assisted procedures reduce outlier alignment by 40–60% compared to manual instrumentation [11], supporting shorter hospital stays and faster rehabilitation. The economic case is strengthening as per-procedure costs decline with higher utilization rates, making robotics a central growth driver for the Knee Replacement Market.

Outpatient Reimbursement Reforms

CMS removed total knee replacement from the Medicare inpatient-only list in 2020, a regulatory shift that catalyzed the migration of straightforward primary cases to ambulatory surgical centers [6]. Bundled payment models such as CJR (Comprehensive Joint Replacement) have further incentivized efficient care delivery, rewarding facilities that achieve same-day or next-day discharge. By 2024, an estimated 35% of primary knee replacements in the US were performed in outpatient settings, up from less than 5% in 2018 [12]. This trend is expanding the Knee Replacement Market by lowering per-episode costs and broadening patient eligibility.

Emerging-Market Insurance Expansion

India's Ayushman Bharat Pradhan Mantri Jan Arogya Yojana now provides coverage for joint replacement surgery to over 500 million beneficiaries [8]. China's National Healthcare Security Administration has similarly expanded its reimbursement lists to include domestically manufactured knee implants at reduced price points following volume-based procurement rounds. These policy moves are unlocking demand in populations that previously lacked financial access to elective surgery, creating a fast-growing addressable market for both global OEMs and regional device manufacturers.


Restraints Impact Analysis

Restraint ~% Negative Impact on CAGR Geographic Relevance Impact Timeline
High implant and surgical costs ~30% Global Long-term (≥4 yr)
Implant recall and product liability risks ~20% North America, Europe Medium-term (2–4 yr)
Reimbursement rate compression ~20% North America Short-term (≤2 yr)
Surgeon training bottlenecks for robotic systems ~18% Asia-Pacific, South America Medium-term (2–4 yr)
Patient preference for non-surgical alternatives ~12% Europe, North America Long-term (≥4 yr)


High Procedure and Implant Costs

The fully loaded cost of a primary total knee replacement in the United States ranges from USD 30,000 to USD 50,000 before insurance adjustments [13]. Even with outpatient migration reducing facility fees, the cost of premium robotic-compatible implants can add USD 2,000–4,000 per case compared to conventional manual systems. In emerging markets where out-of-pocket spending remains dominant, this cost barrier restricts surgical volumes to urban centers with tertiary-care infrastructure. China's volume-based procurement program has reduced implant prices by 70–80% for some categories, but this pricing pressure simultaneously compresses manufacturer margins, which may slow R&D reinvestment.

Implant Recall and Liability Exposure

High-profile product recalls — such as the withdrawal of certain metal-on-metal bearing surfaces and early failures in select cementless tibial base plates — have created both clinical and commercial consequences for the Knee Replacement Market [14]. Litigation costs associated with device failures can reach hundreds of millions of dollars, as demonstrated by several multi-district litigation settlements since 2020. These events introduce purchasing hesitancy among hospital procurement teams and can delay the adoption of next-generation designs.

Non-Surgical Treatment Alternatives

Advances in regenerative medicine, including platelet-rich plasma injections, hyaluronic acid viscosupplementation, and genicular nerve ablation, are giving patients with moderate osteoarthritis new options to delay or avoid surgery [17]. While these treatments do not eliminate the need for knee replacement in end-stage disease, they extend the timeline before patients become surgical candidates. In Europe, national health technology assessment bodies in the UK and Germany have expanded coverage for these conservative therapies, which could modestly suppress near-term procedure volumes.


Knee replacement Market Opportunities

Personalized 3D-Printed Implant Systems

Additive manufacturing is moving from prototyping into full-scale implant production. Patient-specific tibial and femoral components fabricated from CT-scan data can optimize bone-implant interface geometry, potentially improving long-term fixation and reducing revision rates. Companies investing in on-demand 3D-printing infrastructure are positioning themselves to capture surgeon loyalty in the Knee Replacement Market.

Smart Implants with Embedded Sensor Technology

Instrumented knee implants capable of monitoring tibial loading, range of motion, and ligament balance in real time represent a USD 800 million incremental opportunity by 2033. Continuous post-operative data transmission enables early detection of loosening or infection, which could reduce revision surgery rates by an estimated 15–20%. Implant OEMs that integrate sensor platforms with cloud-based analytics stand to differentiate on clinical outcomes rather than purely on price.

Emerging-Market Surgical Volume Expansion

India, Brazil, and Southeast Asia collectively represent an underserved population of over 200 million adults with symptomatic knee osteoarthritis who currently lack affordable access to surgery. Public health insurance expansion, combined with low-cost implant manufacturing hubs in India and China, is creating a favorable environment for surgical volume growth. Local manufacturers offering total knee systems at 40–60% lower price points than multinational competitors are rapidly gaining share.

Outpatient and Ambulatory Surgery Center Growth

The migration of knee replacement procedures from inpatient hospitals to ambulatory surgical centers continues to accelerate. ASCs offer lower overhead costs, higher patient throughput, and satisfaction scores that match or exceed hospital settings. Physician-owned ASC networks are emerging as a new distribution channel for implant manufacturers, reshaping the competitive landscape of the Knee Replacement Market.

Data Monetization through Registry and Outcomes Platforms

Manufacturers that aggregate anonymized surgical outcomes data from thousands of procedures can offer value-added analytics platforms to hospital systems and payers. Real-world evidence derived from registry data supports health economic arguments for premium-priced implants, creates recurring SaaS revenue streams, and strengthens relationships with key opinion leaders in the Knee Replacement Market.


Knee replacement Market Future Outlook

AI-Powered Surgical Planning and Navigation

Artificial intelligence is moving beyond preoperative imaging analysis into intraoperative decision support. Machine-learning algorithms trained on registry data from over 2 million knee procedures are now capable of predicting optimal implant sizing, rotation, and ligament balance with accuracy that matches experienced surgeons [7]. By 2030, integrated AI-navigation platforms are expected to become the standard of care in high-volume centers, reducing operative variability and shortening learning curves for robotic systems. This convergence will reinforce growth in the Knee Replacement Market by lowering complication rates and improving patient-reported outcomes.

Outpatient Surgery and Same-Day Discharge Economics

The economics of same-day knee replacement are compelling — facility costs in ASC settings run 30–45% lower than traditional inpatient episodes, while patient satisfaction scores remain equivalent or superior [12]. By 2028, Market Research Future (MRFR) estimates that over 50% of primary knee replacements in the US will be performed on an outpatient basis. International adoption is following, with pilot programs underway in the UK, Australia, and South Korea. This structural shift will redistribute revenue from large hospital systems toward physician-owned ambulatory networks, reshaping the Knee Replacement Market.

Sustainability and Circular Economy in Implant Manufacturing

Environmental scrutiny of single-use surgical instrument trays is driving manufacturers to develop reusable, sterilizable instrument sets and reduce packaging waste. Zimmer Biomet and Stryker have each announced sustainability targets calling for 30–50% reductions in single-use plastics by 2030 [22]. Additive manufacturing further supports sustainability goals by reducing material waste during implant production. As ESG reporting becomes mandatory for publicly traded medical device companies, sustainability credentials will increasingly influence hospital procurement decisions.

Wearable-Integrated Rehabilitation and Remote Monitoring

Post-operative rehabilitation is evolving from clinic-based physiotherapy sessions to digitally monitored home recovery programs. Wearable sensors paired with smartphone applications can track gait symmetry, range of motion, and activity levels, alerting surgeons to early signs of stiffness or instability [23]. Payers are beginning to reimburse remote therapeutic monitoring codes, creating a recurring revenue stream for device companies that bundle digital rehabilitation platforms with their implant systems. This integration of hardware and software is expected to become a competitive differentiator in the Knee Replacement Market through 2035.


Knee replacement Market Segmentation

By Product

Segment Key Metric Primary Demand Driver
Total Knee Replacement 65.5% share (2025) End-stage tricompartmental osteoarthritis
Partial Knee Replacement 5.95% CAGR Improved patient selection with MRI-based algorithms
Patellofemoral Replacement USD 0.42 Billion (2025) Isolated patellofemoral arthritis in younger patients
Others (Revision Systems, Tumor Prostheses) 4.10% CAGR Growing revision burden from aging primary implants


Total knee replacement systems dominate the Knee Replacement Market because the majority of surgical candidates present with diffuse tricompartmental disease that requires full surface resurfacing. These systems range from posterior-stabilized and cruciate-retaining designs to more constrained hinged configurations for complex revision cases. Manufacturers compete on implant survivorship data, instrument ergonomics, and compatibility with robotic platforms — factors that drive surgeon preference and hospital standardization contracts.

Partial knee replacement is experiencing renewed interest as MRI-based patient selection tools improve the identification of candidates with isolated medial or lateral compartment disease. Five-year survivorship rates for unicompartmental implants now exceed 95% in appropriately selected patients [11], narrowing the historical gap with total knee systems. The segment's faster CAGR reflects growing confidence among surgeons that partial procedures deliver superior functional outcomes and faster recovery for the right patients.

By Surgical Technology

Segment Key Metric Primary Demand Driver
Manual 48.0% share (2025) Established surgeon workflow and lower capital cost
Robotic-Assisted 11.85% CAGR Precision alignment, competitive hospital positioning
Computer-Navigated / Others USD 1.15 Billion (2025) Transitional technology for cost-conscious facilities


Manual instrumentation remains the workhorse of the Knee Replacement Market in cost-sensitive healthcare systems where capital budgets cannot support robotic platform acquisition. Conventional manual systems carry a lower per-case cost and require no specialized infrastructure beyond standard operating room equipment. Surgeons trained exclusively in manual techniques — particularly those approaching retirement — represent a significant installed base that will sustain this segment through mid-decade.

Robotic-assisted surgery is reshaping competitive dynamics as hospitals use robotic capabilities as a marketing differentiator and surgeon recruitment tool. Clinical evidence linking robotic assistance to more consistent component positioning is strengthening, with registry data showing lower early revision rates in robotic cohorts compared to manual controls [11]. As lease-based financing models reduce the upfront capital barrier, adoption is extending from tertiary academic centers into community hospital networks across North America and Europe.

By End User

Segment Key Metric Primary Demand Driver
Hospitals 57.5% share (2025) Complex primary and revision case volumes
Ambulatory Surgical Centers 9.25% CAGR Same-day discharge protocols and bundled payments
Specialty Orthopedic Clinics / Others USD 0.78 Billion (2025) Physician-owned facilities in high-volume markets


Hospitals continue to perform the majority of knee replacements globally, particularly revision procedures and complex primary cases involving significant deformity or bone loss. Large academic medical centers with dedicated joint replacement programs often achieve superior outcomes through high-volume surgical teams and integrated rehabilitation services, which reinforces their role in the Knee Replacement Market.

Ambulatory surgical centers represent the fastest-growing end-user segment, driven by favorable reimbursement structures and patient demand for faster recovery in lower-acuity settings. ASC-based knee replacement volumes in the US grew by an estimated 45% between 2021 and 2024. Market Research Future (MRFR) expects this trajectory to continue as payer coverage expands and surgeon confidence with outpatient protocols matures.


Regional Market Share Analysis

Region Key Metric Primary Investment Themes
North America 37.8% share (2025) Robotic adoption, ASC migration, Medicare reform
Europe USD 3.71 Billion (2025) Aging demographics, national joint registries and HTA-driven procurement
Asia-Pacific 13.45% CAGR (2026–2035) Insurance expansion, domestic manufacturing and hospital capacity buildout
South America 6.8% share (2025) Public hospital investment, medical tourism and regulatory harmonization
Middle East & Africa 5.85% CAGR (2026–2035) PPP hospital projects, medical tourism hubs and import dependency reduction
Total USD 13.17 Billion (2025)

The regional structure of the Knee Replacement Market reflects a blend of demographic maturity, healthcare spending capacity, and surgical infrastructure readiness. Developed regions dominate current revenue, but the fastest growth is concentrating in emerging economies where insurance reform and urbanization are converging.


North America

Country Key Metric Key Driver
United States 82.3% of regional revenue Medicare coverage expansion and CJR bundled payments
Canada 4.78% CAGR Provincial wait-time reduction strategies
Mexico USD 0.34 Billion (2025) Medical tourism inflows from the US border states


The United States is the world's single largest national market for knee replacement, generating over USD 4.10 billion in 2025. CMS reimbursement reforms continue to shape procedural mix, with outpatient volumes now exceeding 35% of all primary knee procedures [6]. Canada's single-payer system has historically constrained surgical throughput. Still, provincial governments in Ontario and Alberta are investing in dedicated orthopedic surgical centers to reduce wait times that can stretch beyond 12 months [18]. Mexico's private hospital sector is actively attracting cross-border medical tourism, with facilities in Monterrey and Guadalajara offering procedures at 50–70% of US prices.

Europe

Country Key Metric Key Driver
Germany 28.4% of regional revenue Highest per-capita knee replacement rate in Europe
United Kingdom 5.12% CAGR NHS elective recovery program
France USD 0.46 Billion (2025) National HTA-driven implant procurement
Italy 12.5% of regional revenue An aging population concentrated in northern regions
Spain 4.85% CAGR Rising obesity rates and private insurance growth
Nordic Countries USD 0.38 Billion (2025) National joint registry quality benchmarks
Russia 3.8% of regional revenue Import substitution and domestic manufacturing
Rest of Europe 4.52% CAGR Eastern Europe hospital modernization programs


Germany performs approximately 190,000 knee replacements annually [19], the highest per-capita rate in Europe, driven by universal insurance coverage and a dense network of certified endoprosthetics centers. The United Kingdom's NHS has committed GBP 8 billion to elective surgery recovery following pandemic-era backlogs, with knee replacement listed as a top-five priority procedure. France's Haute Autorité de Santé conducts rigorous health technology assessments that increasingly favor robotic-compatible implant designs, steering procurement toward advanced platforms in the Knee Replacement Market.

Asia-Pacific

Country Key Metric Key Driver
China 34.2% of regional revenue Volume-based procurement and domestic OEM scale-up
India 15.75% CAGR Ayushman Bharat surgical coverage expansion
Japan USD 0.52 Billion (2025) Super-aged society with 29% population over 65
South Korea 11.8% of regional revenue National Health Insurance implant reimbursement
ASEAN 12.90% CAGR Hospital infrastructure investment across Thailand and Vietnam
Rest of Asia-Pacific USD 0.18 Billion (2025) Early-stage market development


China's centralized volume-based procurement program has driven knee implant prices down by over 70% since 2021, dramatically expanding patient access while squeezing foreign manufacturer margins [20]. India represents the fastest-growing country-level opportunity in the Knee Replacement Market, where government insurance coverage for joint surgery now extends to approximately 500 million citizens. Japan's super-aged demographic — nearly 29% of the population is over 65 — ensures sustained procedural demand despite an overall population decline. South Korea's robust national health insurance system fully reimburses approved knee implants, supporting steady per-capita surgical rates.

South America

Country Key Metric Key Driver
Brazil 62.5% of regional revenue SUS public health system and private insurance expansion
Argentina 5.25% CAGR Economic stabilization improves device imports
Rest of South America USD 0.19 Billion (2025) Early-stage public hospital procurement


Brazil's Unified Health System (SUS) has expanded coverage for elective orthopedic procedures, though wait times for knee replacement in public hospitals can exceed two years. The private hospital sector, which serves approximately 25% of the population through supplemental insurance plans, accounts for the majority of advanced implant utilization. Argentina's market is recovering from currency instability that previously restricted medical device imports, with domestic distributors now restocking robotic-compatible inventory.

Middle East & Africa

Country Key Metric Key Driver
Saudi Arabia 31.8% of regional revenue Vision 2030 healthcare infrastructure investment
UAE 6.10% CAGR Medical tourism hub strategy
South Africa USD 0.11 Billion (2025) Private-sector orthopedic network growth
Egypt 5.45% CAGR Population scale and rising chronic disease burden
Rest of MEA 22.4% of regional revenue PPP hospital projects across Sub-Saharan Africa


Saudi Arabia's Vision 2030 program allocates substantial capital to healthcare infrastructure, including new specialized orthopedic hospitals in Riyadh, Jeddah, and Dammam [21]. The UAE has established itself as a regional medical tourism destination, with facilities in Dubai and Abu Dhabi attracting knee replacement patients from across the GCC and South Asia. South Africa's private hospital groups — including Netcare and Mediclinic — operate the continent's most advanced orthopedic surgery programs, though the broader African continent remains largely underserved.


Knee replacement Market By Region, 2025-2035

Competitive Benchmarking

The Knee Replacement Market is moderately consolidated, with the top five players accounting for an estimated 65-70% of the whole revenue. The market’s Herfindahl-Hirschman Index is in the moderately concentrated range (about 1,200–1,500), suggesting a structure in which a handful of global OEMs compete on implant design, robotic platforms, and surgeon training networks. At the same time, smaller players target niche segments such as patient-specific implants and value offerings in emerging markets.

Company Est. Revenue Share Range Key Offerings for the Knee Replacement Market Strategic Positioning
Zimmer Biomet Holdings ~18–22% Persona Total Knee, ROSA Robotic System Full-line OEM with integrated robotics and digital surgery suite
Stryker Corporation ~16–20% Triathlon Knee System, Mako Robotic Platform Robotic market leader with the largest global installed base
DePuy Synthes (Johnson & Johnson) ~14–18% ATTUNE Knee System, VELYS Robotic-Assisted Solution Broad portfolio with scale distribution and clinical evidence
Smith & Nephew ~10–14% JOURNEY II, CORI Surgical System Differentiated kinematics platform with handheld robotics
Medacta International ~4–6% GMK Sphere, MyKnee Patient-Matched Technology Patient-specific instrumentation and surgeon education focus
ConforMIS ~2–4% iTotal, iUni, iDuo Customized Implants Fully patient-specific implant pioneer
Exactech ~2–4% OPTETRAK Logic, ExactechGPS Navigation Mid-market positioning with navigation-ready systems
B. Braun Melsungen ~2–3% Aesculap Columbus Knee System European base with strong hospital group relationships
MicroPort Scientific ~2–3% Evolution Medial-Pivot Knee System China-headquartered OEM scaling globally
Artivion (formerly CryoLife) ~1–2% Specialty biologic solutions for joint preservation Niche positioning in biologic augmentation


Recent News & Developments


  • Zimmer Biomet (November 2024): Zimmer Biomet received FDA approval for the Oxford Cementless Partial Knee, becoming the only cementless partial knee replacement implant approved in the United States. The system demonstrates 94.1% implant survival rate at 10 years and is set for nationwide launch in Q1 2025.


  • CMS (Centers for Medicare & Medicaid Services) (January 2024): Finalized the 2024 Outpatient Prospective Payment System rule, expanding ASC-eligible procedure codes for knee replacement and increasing facility reimbursement rates by 3.1% [6].


Knee replacement Market Report Scope

Parameter Detail
Market Scope Global Knee Replacement Market covering devices, surgical technology platforms, and associated services
Study Period 2021–2035
CAGR 4.69% (2026–2035)
Base Year Market Size USD 13.17 Billion (2025)
Forecast Year Market Size USD 20.83 Billion (2035)
Fastest Growing Segment Robotic-Assisted Surgery (11.85% CAGR)
Companies Profiled 10 (Zimmer Biomet, Stryker, DePuy Synthes, Smith & Nephew, Medacta, ConforMIS, Exactech, B. Braun, MicroPort, Artivion)
Valuation Currency USD Billion
CAGR Driver Disclaimer Impact percentages are directional; they do not sum to the headline CAGR


FAQs

How long do modern knee replacement implants typically last before requiring revision surgery?
Contemporary total knee implants demonstrate 95–97% survivorship at 15 years in national joint registry data [10]. Younger, more active patients face a higher revision risk due to accelerated polyethylene wear. Implant longevity depends heavily on patient weight, activity level, and component alignment accuracy.
What differentiates robotic-assisted knee replacement from computer-navigated surgery in terms of clinical outcomes?
Robotic systems provide haptic-guided bone resection within pre-planned boundaries, while computer navigation offers visual guidance without motorized cutting control [11]. Robotic platforms show lower outlier rates for component positioning. Navigation remains a lower-cost alternative for facilities not ready for full robotic capital investment.
Which reimbursement model changes are most likely to affect implant pricing over the next five years?
Bundled payment programs like CMS's CJR model tie reimbursement to 90-day episode outcomes, pressuring providers to select cost-effective implants [15]. Reference-based pricing is expanding in Europe. These models shift purchasing power from surgeons to hospital value-analysis committees.
How does the Knee Replacement Market address younger patients under age 55 who require joint surgery?
Surgeons increasingly use partial knee systems or patellofemoral implants for younger patients with isolated compartment disease [14]. Cementless fixation designs encourage biologic bone ingrowth suited to higher activity demands. Activity modification counseling complements implant selection for this cohort.
What role do national joint registries play in shaping implant manufacturer competitiveness?
Registries in Australia, Sweden, and the UK publish implant-level revision rates that directly influence hospital procurement decisions [10]. Poor-performing implants face removal from approved purchasing lists. Manufacturers with consistently strong registry data use these results as competitive differentiators.
How are supply chain disruptions affecting the availability of knee replacement components globally?
Titanium and cobalt-chromium alloy shortages have intermittently extended implant lead times to 8–12 weeks in certain markets [13]. Manufacturers are dual-sourcing raw materials and nearshoring machining operations. Most major OEMs have increased safety stock levels since 2023 to buffer against disruption.
What training infrastructure exists for surgeons transitioning from manual to robotic-assisted knee replacement in the Knee Replacement Market?
OEMs operate dedicated training centers — Stryker's Mako Experience Centers and Medacta's M.O.R.E. Institute — offering cadaveric and simulation-based curricula [16]. Surgeon proctoring programs provide in-OR mentorship for the first 10–20 robotic cases. Certification pathways typically require 15–25 supervised procedures before independent practice.    
What is the current size of the knee replacement market?
The knee replacement market reached USD 13.17 billion in 2025 and is projected to reach USD 20.83 billion by 2035.
What is the CAGR of the knee replacement market?
The knee replacement market is projected to grow at a CAGR of 4.69% during the forecast period 2026–2035.
Which region leads the knee replacement market?
North America holds the largest share at 37.8%, while Asia-Pacific is the fastest-growing region at 13.45% CAGR.
What is driving growth in the knee replacement market?
Growth in the knee replacement market is primarily driven by the rising global population aged 65 and older and increasing osteoarthritis prevalence, along with growing adoption of robotic-assisted surgical platforms and outpatient reimbursement reforms.
Author
Author
Author Profile
Nidhi Mandole LinkedIn
Senior Research Analyst
She is an extremely curious individual currently working in Healthcare and Medical Devices Domain. Nidhi is comfortably versed in data centric research backed by healthcare educational background. She leverages extensive data mining and analytics tools such as Primary and Secondary Research, Statistical Analysis, Machine Learning, Data Modelling. Her key role also involves Technical Sales Support, Client Interaction and Project management within the Healthcare team. Lastly, she showcases extensive affinity towards learning new skills and remain fascinated in implementing them.
Co-Author
Co-Author Profile
Rahul Gotadki LinkedIn
Research Manager
He holds an experience of about 9+ years in Market Research and Business Consulting, working under the spectrum of Life Sciences and Healthcare domains. Rahul conceptualizes and implements a scalable business strategy and provides strategic leadership to the clients. His expertise lies in market estimation, competitive intelligence, pipeline analysis, customer assessment, etc.

Research Approach


Secondary Research

The secondary research process involved comprehensive analysis of medical device regulatory databases, peer-reviewed orthopedic journals, arthroplasty registries, and authoritative musculoskeletal health organizations. Key sources included the US Food & Drug Administration (FDA) Center for Devices and Radiological Health, European Medicines Agency (EMA) Medical Device Coordination Group, International Organization for Standardization (ISO) 14155 for implant standards, American Academy of Orthopaedic Surgeons (AAOS), American Association of Hip and Knee Surgeons (AAHKS), European Hip Society (EHS), Australian Orthopaedic Association National Joint Replacement Registry (AOANJRR), National Joint Registry for England, Wales, Northern Ireland and Isle of Man (NJR), American Joint Replacement Registry (AJRR), International Society of Arthroplasty Registries (ISAR), National Institutes of Health (NIH) National Institute of Arthritis and Musculoskeletal and Skin Diseases, National Center for Biotechnology Information (NCBI/PubMed), Centers for Disease Control and Prevention (CDC) Arthritis Program, World Health Organization (WHO) Global Burden of Disease Study for musculoskeletal disorders, OECD Health Statistics, EUROSTAT Healthcare Database, and national health ministry reports from key markets including China NMPA, Japan PMDA, and Health Canada.

510(k) and PMA approval data for implant systems, clinical outcome studies, osteoarthritis prevalence trends, revision surgery rates, statistics on arthroplasty procedures, and competitive landscape analysis for total knee replacement, partial knee replacement, and revision systems were all gathered from these sources.


Primary Research

To gather both qualitative and quantitative insights, supply-side and demand-side stakeholders were interviewed during the primary research process. CEOs, VPs of orthopedic research and development, directors of regulatory affairs, and commercial leaders from knee implant producers, component suppliers, and surgical robots firms were examples of supply-side sources. The demand-side sources included orthopedic doctors with fellowship training, tertiary hospital orthopedic surgery chiefs, ASC medical directors, hospital procurement executives, and administrators of rehabilitation centers. Primary research confirmed next-generation implant pipeline timelines, including cementless and patient-specific instrumentation technologies, validated market segmentation across procedure types and fixation methods, and collected data on outpatient migration trends, value-based procurement strategies, and robotic surgery adoption patterns.

Primary Respondent Breakdown:

By Designation: C-level Primaries (32%), Director Level (38%), Others (30%)

By Region: North America (38%), Europe (28%), Asia-Pacific (24%), Rest of World (10%)


Market Size Estimation

Revenue mapping, operation volume analysis, and implant pricing knowledge across fixation types and bearing surfaces were used to determine the global market valuation. The following were part of the methodology:

Over thirty-five major orthopedic manufacturers from North America, Europe, Asia-Pacific, and Latin America have been identified.

Product mapping for revision knee constructs, unicompartmental/partial knee systems, and whole knee systems, divided by fixation technique (cemented vs. cementless) and material composition (metal alloys, ceramic components, and polyethylene inserts).

Examination of reported and projected yearly revenues for knee replacement portfolios, including platforms for robotically assisted surgery and equipment tailored to individual patients

coverage of producers who will account for 75–80% of the world market in 2024

Extrapolation to determine segment-specific valuations for hospitals, ambulatory surgery centers, and specialty clinics utilizing top-down (manufacturer revenue validation) and bottom-up (primary and revision procedure volumes × implant ASP by country/region) techniques

Download Free Sample

Kindly complete the form below to receive a free sample of this Report

Download PDF ×

We do not share your information with anyone. However, we may send you emails based on your report interest from time to time. You may contact us at any time to opt-out.
















