Leather Goods Market (2026 - 2035)

Leather Goods Market Size, Share, Industry Trend & Analysis Research Report Information By Product Type (Footwear, Handbags, Luggage, Clothing, Others), By End User (Male, Female), By Category (Mass, Premium), By Distribution Channel (Offline Retail Stores, Online Retail Stores), By Geography (North America, Europe, Asia-Pacific, South America, Middle East & Africa) - Forecast Till 2035
ID: MRFR/CG/9247-CR
90 Pages
Snehal Singh
Last Updated: July 12, 2026
Leather Goods Market
Market Size
Forecast Period2026-2035
CAGR (2026-2035)6.7%
2025 Market SizeUSD 478.8 Billion
2035 Market SizeUSD 916.3 Billion
Key Players
LVMH Moët Hennessy Louis Vuitton
Kering SA
Hermès International
Prada Group
Tapestry Inc.
Capri Holdings
Opportunities
  • Sustainable Material Innovation
  • Luxury Retail Expansion in the Middle East & Africa
  • Personalization and Made-to-Order Business Models

Leather Goods Market Summary

The global Leather Goods Market was valued at USD 478.8 billion in 2025 and is projected to reach USD 510.9 billion by 2026, growing to USD 916.3 billion by 2035 at a CAGR of 6.7% during the 2026–2035 forecast period. Rising disposable incomes across emerging economies, coupled with a cultural shift toward premium lifestyle products, underpin this expansion. Government-backed programs promoting domestic manufacturing — such as India's Production-Linked Incentive scheme allocating over USD 500 million toward leather sector modernization — have injected fresh momentum into the Leather Goods Market supply chain [1].

A manufacturing transformation is reshaping how the Leather Goods Market operates at scale. Traditional manual tanning and stitching workflows are giving way to laser cutting, automated quality inspection, and water-recycling tannery systems. The European Commission's Circular Economy Action Plan has accelerated investment in bio-based tanning agents, with the continent's top five tanneries collectively committing EUR 320 million toward chemical-free processing by 2028 [2]. These shifts are compressing production lead times by 15–20% while reducing water consumption per hide by nearly 40% [3].

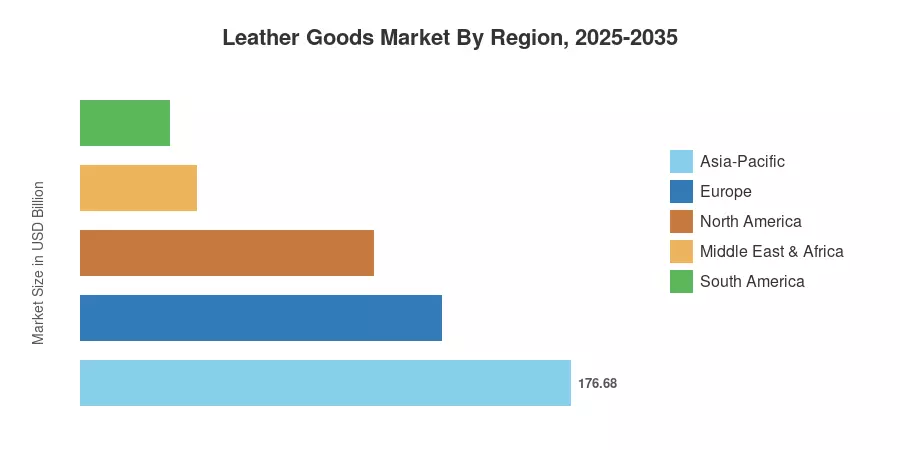
Asia-Pacific commands 36.9% of the global Leather Goods Market revenue, driven by China's export dominance and India's growing domestic consumption. The Middle East & Africa region is the fastest-growing, with a projected CAGR of 8.7%, fueled by luxury retail expansion in the UAE and Saudi Arabia's Vision 2030 spending. Europe holds the second-largest share at 27.2%, anchored by Italian and French heritage brands. As sustainability regulations tighten and consumer expectations evolve, the Leather Goods Market is poised for structural reinvention over the coming decade.


Key Report Takeaways

• By Product Type

  • Footwear accounted for 36.1% of Leather Goods Market revenue in 2025, reflecting its status as the highest-volume product category globally.
  • Accessories are forecast to expand at a 7.6% CAGR through 2035, outpacing all other product segments as demand for small leather goods intensifies.

• By End User & Category

  • Male consumers held a 48.4% share of the Leather Goods Market in 2025, though the female segment is advancing at a faster 7.15% CAGR.
  • Mass products represented 58.5% of total sales, yet the premium tier is climbing at a 7.85% CAGR between 2026 and 2035.

• By Region

  • Asia-Pacific dominated the Leather Goods Market with 36.9% of global revenue in 2025.
  • The Middle East & Africa region is projected to record the highest regional CAGR at 8.7% over the forecast period.


Leather Goods Market Size and Forecast (2021–2035)

Market Research Future's sizing methodology integrates bottom-up revenue modeling from trade databases, customs records, company financials, and proprietary primary research across 42 countries. Historical figures (2021–2024) are reconciled against industry association data, while the forecast (2026–2035) applies regression-adjusted demand modeling calibrated to macroeconomic indicators including GDP per capita growth and urbanization rates.
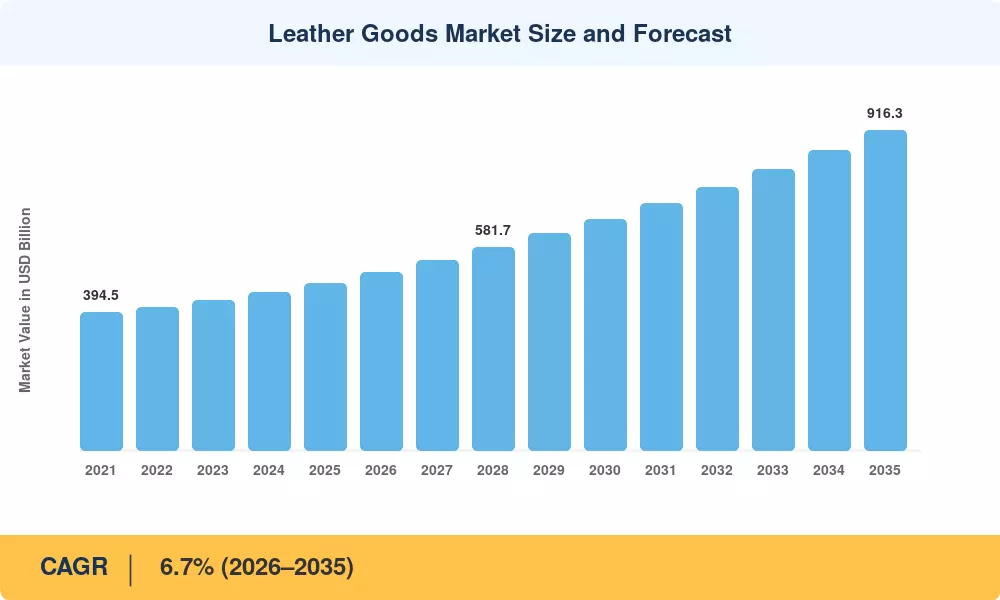
Leather Goods Market Size and Forecast
Our Impact
Enabled $4.3B Revenue Impact for Fortune 500 and Leading Multinationals
Partnering with 2000+ Global Organizations Each Year
30K+ Citations by Top-Tier Firms in the Industry

Driver Impact Analysis

Driver ~% Impact on CAGR Geographic Relevance Impact Timeline
Rising middle-class consumption ~22% Asia-Pacific, South America Long-term
E-commerce and D2C channel expansion ~18% Global Short-term
Premiumization and luxury positioning ~16% Europe, North America Medium-term
Celebrity and influencer brand collaborations ~14% Global Short-term
Sustainability-driven material innovation ~12% Europe, North America Medium-term
Urbanization and lifestyle shifts ~10% MEA, Asia-Pacific Long-term
Government manufacturing incentives ~8% Asia-Pacific Medium-term


Rising Middle-Class Consumption

The World Bank estimates that over 150 million people will enter middle-income brackets across South and Southeast Asia between 2025 and 2030, directly expanding the addressable consumer base for the Leather Goods Market [7]. India's leather goods consumption grew 11.3% year-over-year in 2024, outpacing GDP growth by nearly 2x, as organized retail penetration in Tier-2 and Tier-3 cities brought branded products within reach of first-time buyers.

E-Commerce and Direct-to-Consumer Expansion

Online retail channels captured a growing share of Leather Goods Market sales, driven by platform investments in AR-enabled product visualization and hassle-free return policies [8]. Shopify reported that leather accessories ranked among the top five fastest-growing categories on its platform in 2024, with average order values 34% higher than apparel. Direct-to-consumer brands have compressed traditional wholesale margins, allowing emerging labels to compete with heritage houses on price-value positioning.

Premiumization and Luxury Positioning

2024 Luxury Report documented a 7% annual increase in global personal luxury goods spending, with leather categories outperforming hard luxury segments by 2.3 percentage points [9]. The Leather Goods Market benefits disproportionately from this premiumization trend because leather products serve as accessible entry points to luxury consumption — a USD 400 branded wallet or belt carries the aspirational cachet of a luxury house without the five-figure price tag of jewelry or watches.

Celebrity and Influencer Collaborations

Strategic brand partnerships with high-profile cultural figures have shortened product discovery-to-purchase cycles in the Leather Goods Market. LVMH's collaboration with Pharrell Williams generated an estimated USD 100 million in incremental handbag revenue within six months of launch [10]. Social media-driven product drops create artificial scarcity that commands 20–40% price premiums over standard collection items, further elevating margins.


Restraints Impact Analysis

Restraint ~% Drag on CAGR Geographic Relevance Impact Timeline
Environmental and tannery regulations ~–25% Europe, North America Medium-term
Raw material cost volatility ~–22% Global Short-term
Counterfeit product proliferation ~–20% Asia-Pacific, South America Long-term
Animal welfare and vegan consumer sentiment ~–18% Europe, North America Long-term
Macroeconomic slowdowns and consumer caution ~–15% Global Short-term


Environmental and Tannery Regulations

The European Union's forthcoming Corporate Sustainability Due Diligence Directive will require Leather Goods Market participants selling into the EU to demonstrate full traceability of raw hides from farm to finished product [12]. Compliance costs for mid-sized tanneries are projected at EUR 1.2–2.5 million per facility, squeezing margins in an industry where net margins already average 8–12%. Chromium VI discharge limits tightened by 30% under revised REACH regulations in 2024, forcing operational overhauls across Mediterranean tanning clusters.

Raw Material Cost Volatility

Global cattle hide prices swung 18% peak-to-trough during 2023–2024, reflecting disruptions from drought-related herd liquidations in South America and shifting demand from automotive upholstery manufacturers [13]. The Leather Goods Market faces an asymmetric cost structure: raw hides typically constitute 35–45% of production costs, yet downstream brands absorb price increases reluctantly, compressing manufacturer margins during volatility spikes.

Counterfeit Product Proliferation

The OECD estimates that counterfeit leather goods represent a USD 45 billion annual problem, eroding brand equity and diverting consumer spending from legitimate Leather Goods Market channels [14]. Cross-border e-commerce platforms remain the primary distribution vector, with seizure volumes at EU borders increasing 22% in 2024. Authentication technologies like blockchain-based provenance tracking are emerging but remain cost-prohibitive for mass-market producers.


Leather Goods Market Opportunities

Sustainable Material Innovation

Alternatives to leather made from mycelium, cactus fiber and pineapple leaf are a USD 1.2 billion addressable opportunity of the Leather Goods Market by 2030 [11]. Brands capable of offering confirmed low-impact materials without compromising tactile quality will appeal to the expanding segment of sustainability-conscious consumers prepared to pay 15-25% extra.


Luxury Retail Expansion in the Middle East & Africa

Saudi Arabia’s entertainment and tourism mega-projects, notably NEOM and the Red Sea development, are opening up new luxury retail corridors for the Leather Goods Market. In 2024, Dubai Mall alone drew in 105 million people, while retail growth initiatives inside Riyadh and Abu Dhabi will bring in an excess of 500,000 square meters of premium retail space by 2028 [17].


Personalization and Made-to-Order Business Models

Digital Configurators and On-Demand Manufacturing for the Leather Goods Market brands to provide custom, personalized products at near mass production economies. Users who customized their products on Coach’s “Coach Create” platform had 40% greater recurring purchase rates than normal consumers in 2024 [9]. This technique simultaneously decreases inventory waste and commands 20-30% price premiums.


Data-Driven Retail and Clienteling

With CRM integration, clienteling platforms allow Leather Goods to Retailers to customize outreach based on purchase history, browsing habits, and social interaction data. Advanced customisation can increase revenues by 10-15% for luxury goods firms who do it well [18]. Another layer of monetization is the incorporation of resale data (monitoring secondary market values).


Emerging Market Penetration Through Digital Channels

Leather Goods Market brands can bypass the cost of physical retail buildout in sub-Saharan Africa, Southeast Asia, and Latin America by partnering with established e-commerce marketplaces. Jumia and Mercado Libre reported 30%+ year-over-year growth in premium accessories categories during 2024, signaling untapped demand [8].


Leather Goods Market Future Outlook

AI-Powered Design and Supply Chain Optimization

Artificial intelligence is set to transform the Leather Goods Market across design, inventory management, and demand forecasting. Generative design tools can produce hundreds of product variations in hours, compressing development cycles from 18 months to under 6 months. Predictive analytics platforms reduce overstock situations by 25–30%, directly improving working capital efficiency for brands operating across multiple seasons and geographies [18].

Circular Economy and Resale Integration

The secondhand luxury leather goods market is projected to surpass USD 50 billion globally by 2030, according to ThredUp and BCG estimates [15]. Brands that integrate resale, repair, and refurbishment into their core operations — rather than treating them as threats — will capture lifetime customer value that traditional one-purchase models miss. The Leather Goods Market will increasingly reward durable, repairable product design over planned obsolescence.

Omnichannel Convergence and Experiential Retail

Physical stores in the Leather Goods Market are evolving from transaction points to experience centers that drive brand loyalty and higher-value purchases. Hermès, Gucci, and Louis Vuitton have invested heavily in flagship redesigns that blend product display with cultural programming. The convergence of online discovery and in-store fulfillment will require brands to maintain unified inventory systems and real-time clienteling capabilities across all touchpoints [8].

ESG Reporting and Traceability Standards

Mandatory ESG disclosure requirements — including the EU's Corporate Sustainability Reporting Directive and SEC climate risk rules — will compel Leather Goods Market companies to quantify and report Scope 3 emissions across their supply chains [12]. Traceability from ranch to retail shelf will shift from a marketing differentiator to a regulatory requirement, favoring vertically integrated operators and technology providers offering blockchain-based provenance solutions.


Leather Goods Market Segmentation

By Product Type

Segment Key Metric Primary Demand Driver
Footwear 36.1% revenue share (2025) Daily-wear volume and fashion cycling
Handbags USD 116.3 Billion (2025) Luxury positioning and gifting culture
Luggage 5.9% CAGR (2026–2035) Travel recovery and premiumization
Clothing USD 59.9 Billion (2025) Outerwear and jacket demand
Others 6.4% CAGR (2026–2035) Belts, gloves, and small accessories


Footwear remains the volume anchor of the Leather Goods Market, driven by both formal and casual styling applications. Athletic-adjacent leather sneakers from luxury houses have blurred the boundary between performance and fashion, expanding the addressable buyer pool well beyond traditional dress-shoe consumers. Handbags hold the highest per-unit value within the Leather Goods Market and serve as the primary revenue driver for luxury conglomerates — LVMH's leather goods division alone generated EUR 23 billion in 2024, representing nearly half of group revenues [9].

Luggage is experiencing a post-pandemic resurgence as international travel volumes approach 2019 levels. Premium check-in and carry-on collections from Rimowa, Tumi, and Montblanc are capitalizing on the travel-as-status trend, while direct-to-consumer luggage brands such as Away have introduced leather trim lines to differentiate from commodity hard-shell competitors.

By End User

Segment Key Metric Primary Demand Driver
Male 48.4% revenue share (2025) Formal footwear, wallets, and belts
Female 7.15% CAGR (2026–2035) Handbags, fashion footwear, and accessories


The male segment in the Leather Goods Market has historically dominated through volume-driven categories like formal footwear, belts, and wallets. The female segment is growing faster as handbag culture intensifies globally and women's ready-to-wear increasingly incorporates leather outerwear. Gender-fluid fashion trends are also creating crossover demand, with unisex leather goods lines from Bottega Veneta and Loewe gaining commercial traction.

By Category

Segment Key Metric Primary Demand Driver
Mass 58.5% revenue share (2025) Price accessibility and retail penetration
Premium 7.85% CAGR (2026–2035) Aspirational consumption and brand equity


Mass-market products dominate the Leather Goods Market by volume, but the premium tier captures disproportionate margin. The premiumization CAGR of 7.85% reflects a global consumer willingness to trade up — particularly in Asia-Pacific and the Middle East, where luxury leather goods serve as visible markers of social mobility.

By Distribution Channel

Segment Key Metric Primary Demand Driver
Offline Retail Stores 65.8% revenue share (2025) Touch-and-feel purchasing behavior
Online Retail Stores 9.5% CAGR (2026–2035) Convenience, price comparison, D2C models


Offline retail retains the majority of Leather Goods Market sales because consumers prefer to physically inspect leather texture, color, and construction before committing to high-value purchases. Online channels are closing the gap rapidly, however, supported by enhanced product photography, AR try-on features, and generous return policies that reduce perceived risk for digital buyers.


Regional Market Share Analysis

Region Key Metric Primary Investment Themes
Asia-Pacific 36.9% of global revenue (2025) Export manufacturing, domestic consumption growth
Europe 27.2% of global revenue (2025) Heritage luxury, sustainability compliance
North America 22.1% of global revenue (2025) D2C brands, omnichannel retail
South America 6.7% of global revenue (2025) Raw material supply, domestic brand development
Middle East & Africa 8.7% CAGR (2026–2035) Luxury corridor buildout, tourism-linked retail
Total USD 478.8 Billion (2025)


North America

Country Key Metric Key Driver
US 78.5% of regional share D2C brand proliferation
Canada 12.8% of regional share Premiumization in urban centers
Mexico 8.7% of regional share Manufacturing nearshoring


The North American Leather Goods Market benefits from a mature retail infrastructure and a digitally savvy consumer base. The US alone accounts for roughly USD 83.0 billion in leather goods spending, driven by heritage brands like Coach, Michael Kors, and Kate Spade that continue to expand outlet and e-commerce channels. Mexico's role is shifting from pure manufacturing hub to domestic consumption center as rising wages support aspirational purchases [7].

Europe

Country Key Metric Key Driver
Germany 5.2% CAGR Engineering-quality leather goods demand
UK USD 21.4 Billion (2025) Fashion-forward consumer spending
France 18.6% of regional share Luxury maison dominance
Italy 22.3% of regional share Tanning cluster and artisanal heritage
Spain 4.8% CAGR Tourism-driven accessory sales
Nordic Countries 7.1% of regional share Sustainability-first buying culture
Russia 3.9% CAGR Domestic brand substitution
Rest of Europe 14.2% of regional share Emerging designer markets


Europe's Leather Goods Market identity is inseparable from Italian craftsmanship and French luxury houses. The Tuscany tanning district alone processes 65% of Europe's bovine hides and supplies raw material to over 5,000 artisan workshops [2]. EU sustainability directives are creating both compliance costs and competitive advantages for producers who adopt green chemistry tanning methods early, positioning the region as a global standard-setter.

Asia-Pacific

Country Key Metric Key Driver
China 42.1% of regional share Manufacturing scale and domestic luxury demand
India 7.8% CAGR Government incentives, export growth
Japan USD 22.8 Billion (2025) Quality-conscious consumer culture
South Korea 7.4% CAGR K-fashion and streetwear leather integration
ASEAN 11.5% of regional share Contract manufacturing, emerging consumption
Rest of Asia-Pacific 6.3% CAGR Diversified sourcing expansion


The Asia-Pacific Leather Goods Market functions as both the world's factory floor and its fastest-expanding consumer base. China's Guangdong and Zhejiang provinces manufacture approximately 40% of global leather goods by volume, while domestic spending on luxury leather products grew 14% in 2024. India's Council for Leather Exports targets USD 10 billion in leather product exports by 2027, backed by the PLI scheme that subsidizes machinery upgrades for tanneries and finished goods manufacturers [1].

South America

Country Key Metric Key Driver
Brazil 68.2% of regional share Cattle industry integration
Argentina 19.5% of regional share Hide export and local craftsmanship
Rest of South America 5.4% CAGR Emerging artisanal brands


South America's Leather Goods Market strength flows directly from its cattle ranching economy — Brazil ranks as the world's second-largest cattle herd, providing abundant raw material. Brazilian tanneries exported USD 2.1 billion in processed hides and finished leather goods in 2024 [4]. The challenge lies in converting raw material advantage into finished-product brand equity, though labels like Arezzo and Havaianas (leather lines) are gaining regional traction.

Middle East & Africa

Country Key Metric Key Driver
Saudi Arabia 28.4% of regional share Vision 2030 retail investment
UAE 31.7% of regional share Tourism and duty-free luxury retail
South Africa 5.6% CAGR Domestic leather processing growth
Egypt 5.2% CAGR Manufacturing cost advantages
Rest of MEA 18.6% of regional share Emerging luxury consumption


The Middle East & Africa Leather Goods Market is the fastest-growing regional segment, propelled by mega-project retail developments and a young, brand-conscious population. The UAE's duty-free retail ecosystem captures significant spend from 20+ million annual tourists, while Saudi Arabia's General Entertainment Authority has approved over 40 mixed-use retail-entertainment complexes scheduled for completion by 2030 [17]. African tanning industries in Ethiopia and Nigeria are attracting foreign direct investment aimed at moving up the value chain from raw hide exports to finished goods manufacturing.


Leather Goods Market By Region, 2025-2035

Competitive Benchmarking

The Leather Goods Market exhibits medium concentration, with the top five companies estimated to hold approximately 28–35% of global revenue. The Herfindahl-Hirschman Index falls in the 600–900 range, reflecting a competitive structure where a handful of luxury conglomerates coexist with thousands of regional manufacturers, artisan workshops, and emerging D2C brands. Barriers to entry vary sharply by tier — mass-market segments are highly fragmented, while the premium and luxury tiers are dominated by houses with decades of brand heritage.

Company Est. Revenue Share Range Key Offerings for Leather Goods Market Strategic Positioning
LVMH Moët Hennessy Louis Vuitton ~8–11% Handbags, luggage, small leather goods (Louis Vuitton, Celine, Loewe) Multi-brand luxury conglomerate with vertical tanning integration
Kering SA ~5–8% Handbags, footwear, accessories (Gucci, Bottega Veneta, Balenciaga) Design-led premiumization with sustainability commitments
Hermès International ~4–6% Handbags, belts, equestrian leather (Birkin, Kelly) Ultra-luxury scarcity model with artisanal production
Prada Group ~3–5% Handbags, footwear, travel goods (Prada, Miu Miu) Innovation-driven luxury with Re-Nylon sustainability line
Tapestry Inc. ~3–5% Handbags, accessories, footwear (Coach, Kate Spade, Stuart Weitzman) Accessible luxury with strong North American presence
Capri Holdings ~2–4% Handbags, footwear, accessories (Michael Kors, Versace, Jimmy Choo) Multi-brand aspirational luxury portfolio
Burberry Group ~2–3% Outerwear, accessories, leather goods British heritage luxury with digital-first retail strategy
Samsonite International ~2–4% Luggage, travel accessories (Samsonite, Tumi) Global travel goods leader with premium leather lines
Fossil Group ~1–2% Wallets, bags, small accessories Affordable leather accessories with wide distribution
VF Corporation ~1–2% Footwear and accessories (Timberland leather lines) Outdoor-lifestyle leather integration


Recent News & Developments


  • Hermès International (2021,): Debuted the Victoria bag in Sylvania, a mushroom-based material, marking its first commercially available non-animal leather product [11].


Leather Goods Market Report Scope

Parameter Detail
Market Scope Global Leather Goods Market across product type, end user, category, distribution channel, and geography
Study Period 2021–2035
CAGR 6.7% (2026–2035)
Market Size (2025) USD 478.8 Billion
Market Size (2035) USD 916.3 Billion
Fastest Growing Segments Accessories (by product), Premium (by category), Online Retail (by channel), MEA (by region)
Companies Profiled LVMH, Kering, Hermès, Prada, Tapestry, Capri Holdings, Burberry, Samsonite, Fossil, VF Corporation
Valuation Currency USD Billion


FAQs

What authentication methods help buyers verify genuine leather products?
Blockchain-based digital passports embedded via NFC tags allow buyers to trace hide origin and production history. The Leather Working Group certification and CITES markings also serve as trusted verification standards [19].
How are tariff fluctuations affecting cross-border leather goods trade?
US Section 301 tariffs on Chinese leather goods remain at 7.5–25%, redirecting sourcing toward Vietnam and India. These shifts increase lead times by 2–4 weeks but reduce landed costs by 8–12% for diversified importers [13].
What is the typical investment payback period for a premium leather goods brand launch?
Most new entrants reach profitability in 3–5 years when leveraging D2C e-commerce channels. Initial capital requirements range from USD 500,000 to USD 2 million depending on product complexity and marketing strategy [9].
How does the Leather Goods Market address animal welfare compliance requirements?
Leading producers adopt Leather Working Group Gold-rated tannery sourcing and third-party animal welfare audits. EU deforestation-linked supply chain legislation effective 2025 adds mandatory traceability requirements [19].
What role does blockchain play in the Leather Goods Market supply chain?
Blockchain platforms track hides from farm through tanning to finished product, creating immutable provenance records. Adoption remains below 5% of global tanneries but is accelerating among premium-tier producers [18].
How do seasonal fashion cycles affect inventory management in the Leather Goods Market?
Brands typically carry 4–6 seasonal collections annually, creating markdown risk on unsold inventory. AI-driven demand forecasting reduces overstock by 25–30%, improving sell-through rates and margin preservation [18].
What insurance and warranty considerations apply to high-value leather goods purchases?
Extended warranties covering craftsmanship defects are standard among luxury houses, typically spanning 2–5 years. Specialty insurers now offer policies covering accidental damage and theft for items above USD 1,000 [21].    
Author
Author
Author Profile
Snehal Singh LinkedIn
Manager - Research
High acumen in analyzing complex macro & micro markets with more than 6 years of work experience in the field of market research. By implementing her analytical skills in forecasting and estimation into market research reports, she has expertise in Packaging, Construction, and Equipment domains. She handles a team size of 20-25 resources and ensures smooth running of the projects, associated marketing activities, and client servicing.

Research Approach


Secondary Research

The secondary research process involved comprehensive analysis of trade databases, industry publications, regulatory filings, and authoritative fashion and leather organizations. Key sources included the International Council of Tanners (ICT), Confederation of National Associations of Tanners and Dressers of the European Community (COTANCE), Leather and Hide Council of America (LHCA), World Footwear Congress, International Trade Centre (ITC) Trade Map, UN Comtrade Database, US Customs and Border Protection (Import/Export Data), European Leather Federation, Food and Agriculture Organization (FAO) for livestock and raw material statistics, International Labour Organization (ILO) for manufacturing sector data, Council of Fashion Designers of America (CFDA), British Fashion Council, Centre for the Promotion of Imports (CBI) Ministry of Foreign Affairs of the Netherlands, India Council for Leather Exports (CLE), China Leather Industry Association (CLIA), and Comité Français de la Cuir, Maroquinerie, Chaussure (French Leather Goods Committee). These sources were utilized to collect production statistics, international trade flows, tannery capacity data, raw material pricing trends, regulatory compliance standards (REACH, ISO 17234 for azo dyes, chromium VI regulations), and sustainability certification patterns across genuine leather, synthetic leather, and alternative material categories.


Primary Research

During the primary research process, both supply-side and demand-side stakeholders were interviewed to get both qualitative and quantitative information. Supply-side sources were CEOs, Chief Sustainability Officers, VP of Manufacturing Operations, tannery owners, heads of raw material procurement, and product development directors from luxury leather goods companies, mass-market brands, and OEM/ODM manufacturers. Demand-side sources included fashion house creative directors, chief merchandising officers from department stores and luxury retail groups, e-commerce platform category managers, and procurement leads from specialty boutiques and duty-free stores. Primary research confirmed the splits between real and fake leather, confirmed the timelines for the transition to sustainability, and gathered information on how channels change, how prices change by tier, and how demand for handbags, shoes, small leather goods, and clothing changes by region.

Primary Respondent Breakdown:

By Designation: C-level Primaries (28%), Director Level (32%), Others (40%)

By Region: North America (32%), Europe (30%), Asia-Pacific (35%), Rest of World (3%)


Market Size Estimation

Global market valuation was derived through revenue mapping, production volume analysis, and trade flow reconciliation. The methodology included:

Identification of 60+ key manufacturers and luxury conglomerates across North America, Europe (Italy, France, Germany, Spain), Asia-Pacific (China, India, Vietnam, Japan), and Latin America (Brazil, Mexico)

Product mapping across handbags, footwear, small leather goods (wallets, belts, accessories), and apparel categories, with material split between genuine leather (cowhide, calf, exotic), synthetic leather (PU, PVC, microfiber), and innovative alternatives (mycelium, cactus, pineapple leather)

Analysis of reported and modeled annual revenues specific to leather goods portfolios, including captive tannery operations and third-party sourcing costs

Coverage of manufacturers and brands representing 65-70% of global market share in 2024

Extrapolation using bottom-up (production volume × ASP by country/segment) and top-down (conglomerate revenue validation and retail markup reconciliation) approaches to derive material-specific and category-specific valuations

Cross-validation against export statistics from key leather-producing nations (Italy, China, India, Vietnam) and import data from major consuming markets (US, EU, Japan, UAE) to ensure supply-side and demand-side alignment

Download Free Sample

Kindly complete the form below to receive a free sample of this Report

Download PDF ×

We do not share your information with anyone. However, we may send you emails based on your report interest from time to time. You may contact us at any time to opt-out.
















