Download Free Sample
Kindly complete the form below to receive a free sample of this Report
Legal Technology and Automation Services Market Size, Share and Trends Analysis Research Report Information By End Use (Law Firms, Corporate Legal Departments, Government Agencies, Legal Service Providers), By Application (Document Automation, E-Discovery, Legal Research, Contract Management, Case Management), By Service Type (Consulting, Implementation, Support & Maintenance), By Deployment Type (Cloud-Based, On-Premises, Hybrid), By Technology Type (AI, Machine Learning, Blockchain, NLP), And By Region – Market Forecast Till 2035.
As per MRFR analysis, the Legal Technology and Automation Services Market was estimated at 16.5 USD Billion in 2024. The Legal Technology and Automation Services industry is projected to grow from 17.43 USD Billion in 2025 to 30.2 USD Billion by 2035, exhibiting a compound annual growth rate (CAGR) of 5.65% during the forecast period 2025 - 2035.
The Legal Technology and Automation Services Market is experiencing robust growth driven by technological advancements and evolving client needs.
| 2024 Market Size | 16.5 (USD Billion) |
| 2035 Market Size | 30.2 (USD Billion) |
| CAGR (2025 - 2035) | 5.65% |
Thomson Reuters (CA), LexisNexis (US), Clio (CA), Everlaw (US), Relativity (US), DocuSign (US), iManage (US), ZyLAB (NL), Onit (US)
Our Impact
Enabled $4.3B Revenue Impact for Fortune 500 and Leading Multinationals
Partnering with 2000+ Global Organizations Each Year
30K+ Citations by Top-Tier Firms in the Industry
The Legal Technology and Automation Services Market is currently experiencing a transformative phase, driven by the increasing demand for efficiency and cost-effectiveness within the legal sector. Legal professionals are increasingly adopting technology solutions to streamline operations, enhance client service, and improve overall productivity. This shift appears to be influenced by the growing complexity of legal processes and the need for firms to remain competitive in a rapidly evolving landscape. As a result, various stakeholders, including law firms, corporate legal departments, and technology providers, are actively exploring innovative solutions that can address these challenges. Moreover, the market seems to be characterized by a heightened focus on artificial intelligence and machine learning applications. These technologies are being integrated into legal workflows to automate routine tasks, such as document review and contract analysis. This trend indicates a potential shift in the skill sets required for legal professionals, as they may need to adapt to new tools and methodologies. Additionally, the emphasis on data security and compliance is becoming increasingly paramount, as firms seek to protect sensitive information while leveraging technology. Overall, the Legal Technology and Automation Services Market is poised for continued growth, with advancements in technology likely to shape its future trajectory.
The integration of artificial intelligence into legal practices is becoming more prevalent. Legal professionals are utilizing AI to automate mundane tasks, thereby allowing them to focus on more complex legal issues. This trend suggests a potential shift in the operational dynamics of law firms, as efficiency becomes a key driver of success.
As legal firms increasingly rely on technology, the importance of data security and compliance is rising. Legal Technology and Automation Services are being designed with robust security features to protect sensitive information. This trend indicates a growing awareness of the need to safeguard client data in a digital environment.
Cloud technology is gaining traction within the Legal Technology and Automation Services Market. Firms are adopting cloud-based platforms for their flexibility and scalability. This trend may lead to enhanced collaboration among legal teams, as well as improved access to resources and information.
The Legal Technology and Automation Services Market is witnessing a pronounced demand for enhanced operational efficiency. Law firms and legal departments are increasingly seeking solutions that streamline workflows, reduce manual tasks, and minimize errors. This trend is underscored by a report indicating that automation can lead to a 30% reduction in time spent on routine tasks. As legal professionals strive to allocate more time to strategic activities, the adoption of technology that automates document management, case tracking, and billing processes is becoming essential. Consequently, the market is evolving to meet these needs, with innovative solutions emerging that promise to transform traditional legal practices into more agile and responsive entities.
The shift towards remote work has significantly influenced the Legal Technology and Automation Services Market. As legal professionals adapt to new working environments, there is a growing need for technology that supports remote collaboration, document sharing, and virtual client interactions. This trend is reflected in the increasing adoption of cloud-based legal solutions, which facilitate seamless access to case files and communication tools from any location. Reports indicate that firms utilizing remote work technologies have experienced improved productivity and client satisfaction. As the preference for flexible work arrangements continues, the demand for robust remote work solutions within the legal sector is expected to expand.
In the Legal Technology and Automation Services Market, the pressure to comply with an ever-evolving landscape of regulations is a significant driver. Legal firms are increasingly required to adhere to stringent compliance standards, which necessitates the implementation of technology solutions that can ensure adherence to these regulations. The market is responding to this need by offering tools that facilitate compliance tracking, reporting, and risk management. For instance, a notable percentage of legal professionals report that compliance-related tasks consume a substantial portion of their time, prompting a shift towards automated solutions that can alleviate this burden. As regulatory frameworks continue to tighten, the demand for compliance-focused legal technology is likely to grow.
The integration of advanced analytics into the Legal Technology and Automation Services Market is reshaping how legal professionals approach case management and decision-making. By leveraging data analytics, law firms can gain insights into case outcomes, client behavior, and operational efficiencies. This trend is supported by findings that suggest firms utilizing analytics tools can improve their case success rates by up to 25%. As the legal landscape becomes increasingly data-driven, the ability to harness analytics for predictive modeling and strategic planning is becoming indispensable. Consequently, the market is witnessing a surge in demand for analytics-driven solutions that empower legal practitioners to make informed decisions based on empirical data.
The Legal Technology and Automation Services Market is experiencing a surge in investment directed towards innovative legal tech startups. Venture capitalists and private equity firms are recognizing the potential for technology to disrupt traditional legal practices, leading to a wave of funding aimed at developing cutting-edge solutions. This influx of capital is fostering a vibrant ecosystem of startups focused on areas such as artificial intelligence, blockchain, and process automation. As these startups bring novel solutions to market, they are likely to drive competition and innovation within the industry. The growing interest in legal tech investments suggests a robust future for the market, as new entrants challenge established players and enhance service offerings.
The Legal Technology and Automation Services market is characterized by diverse application segments, with Document Automation commanding the largest share due to its wide adoption among legal professionals seeking efficiency and cost savings. E-Discovery follows closely, recognized as the fastest-growing segment driven by increasing data volumes and the necessity for effective electronic evidence management in legal proceedings.
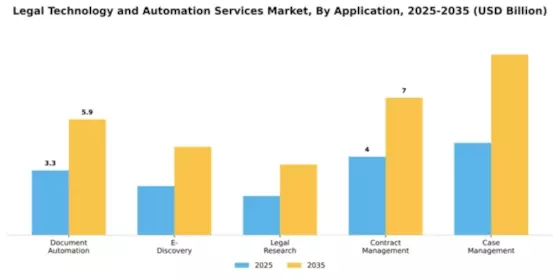
Document Automation (Dominant) vs. E-Discovery (Emerging)
Document Automation stands out as a dominant force in the legal technology landscape, streamlining document creation and management processes, thus significantly enhancing productivity within legal practices. It allows firms to produce high-quality, accurate documents rapidly, reducing errors and improving turnaround times. Conversely, E-Discovery, as an emerging trend, highlights the shift towards digital evidence processing. Its growth is spurred by technological advancements and heightened compliance requirements, compelling law firms to adopt sophisticated tools for efficient data retrieval and analysis in litigation.
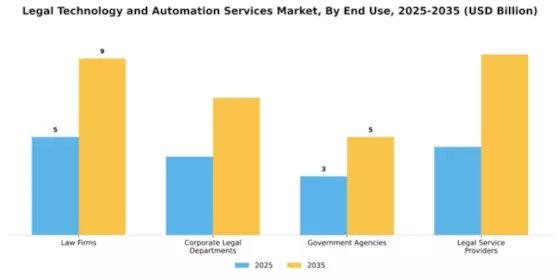
In the Legal Technology and Automation Services Market, Law Firms represent the largest segment, capturing a significant portion of the overall market share. Their demand for innovative technology solutions has been driven by the need to enhance operational efficiency, improve service delivery, and cater to increasingly tech-savvy client bases. Meanwhile, Corporate Legal Departments, while smaller in share, are emerging as the fastest-growing segment, capitalizing on the shift toward in-house legal solutions and the rising trend for automation within internal processes. The growth trends for these segments are distinctly influenced by technological advancements and changing business dynamics. Law Firms are investing in legal tech to streamline workflows, reduce overheads, and provide enhanced client services. On the other hand, Corporate Legal Departments are increasingly adopting automation services to manage their legal demands more effectively and efficiently, thus showcasing a rapid growth trajectory compared to other segments in the market.
Law Firms (Dominant) vs. Government Agencies (Emerging)
Law Firms hold a dominant position in the Legal Technology and Automation Services Market due to their substantial investment in legal tech solutions such as document automation, legal research tools, and case management systems. These firms leverage technology to stay competitive, improve attorney productivity, and deliver superior client service. As they integrate innovative legal technologies, Law Firms aim to enhance collaboration, data management, and case resolution efficiency. In contrast, Government Agencies are emerging as a key segment, driven by the increasing demand for legal automation in public service operations. These agencies are beginning to adopt legal tech solutions to streamline their processes, reduce time-consuming tasks, and improve compliance with regulatory requirements, which positions them as a rising player in the legal tech landscape.
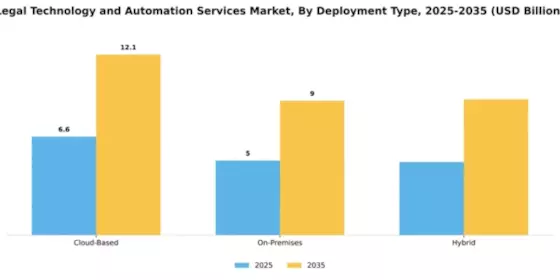
In the Legal Technology and Automation Services Market, the deployment type segment is dominated by cloud-based solutions, reflecting a shift in preference among firms towards more flexible and scalable options. This segment occupies the largest share due to its ability to provide effective collaboration tools, high accessibility, and lower upfront costs. On-premises deployments, while traditionally favored for their perceived security benefits, are losing ground to cloud solutions in many sectors, particularly among small to mid-sized firms seeking cost efficiency and ease of use.
Deployment: Cloud-Based (Dominant) vs. On-Premises (Emerging)
Cloud-based solutions represent the dominant deployment method in the Legal Technology and Automation Services Market, offering numerous advantages including real-time integration, automatic updates, and minimal IT overhead. These solutions cater to the needs of legal professionals by facilitating remote access and collaboration, essential in today's hybrid work environments. On the other hand, on-premises deployments are emerging steadily as firms with stringent data security requirements seek control over their IT infrastructure. While they may require higher initial capital expenditures, these solutions appeal to organizations that prioritize compliance and data sovereignty, thus fostering a unique niche within the sector.
In the Legal Technology and Automation Services Market, Artificial Intelligence (AI) holds the largest market share, driven by its extensive applications in legal research, document management, and case analysis. Meanwhile, Machine Learning (ML) is emerging as a significant competitor, carving out a rapidly growing segment as firms increasingly adopt intelligent systems that enhance efficiency and accuracy in legal processes. Both AI and ML are reshaping the landscape of legal technologies, with firms continuously exploring innovative applications to streamline practices. The growth trends within this segment are underscored by advancements in AI and ML technologies, which are becoming indispensable in legal tasks such as predictive analytics, contract review, and compliance monitoring. The demand for more efficient processes and the need for improved accuracy in legal work are substantial drivers for AI and ML technologies. As law firms and legal departments seek to reduce operational costs and improve service delivery, the adoption of these technologies is expected to escalate, favoring the continued evolution of the market.
Artificial Intelligence: Dominant vs. Machine Learning: Emerging
Artificial Intelligence is currently the dominant technology in the Legal Technology and Automation Services Market, primarily due to its comprehensive capabilities in improving decision-making and efficiency in legal processes. AI solutions enable faster access to vast legal databases and support sophisticated analysis, making them essential for modern legal practice. On the other hand, Machine Learning represents an emerging force within the market, driven by its ability to learn from data, identify patterns, and provide automated insights that enhance legal workflows. As legal professionals increasingly seek automation and predictive insights, Machine Learning's relevance is poised to grow, presenting itself as a key supplement to existing AI capabilities in driving innovation within the sector.
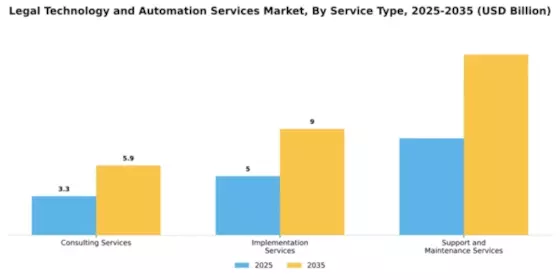
In the Legal Technology and Automation Services Market, the distribution of service types reveals Consulting Services as the largest segment, reflecting the critical need for expert guidance and strategy development. This segment plays a pivotal role in helping firms navigate the complex landscape of legal technology solutions. Meanwhile, Support and Maintenance Services are emerging rapidly, capturing attention for their essential function in ensuring seamless operation and minimal downtime for technology implementations. This balance between large and growing segments highlights the varied needs of legal firms in adopting these technologies. Growth trends in the service type segment are driven by the increasing reliance on technology in legal processes. As firms modernize their operations, the demand for Consulting Services has surged, assisting in devising tailored solutions. Conversely, the fastest-growing Support and Maintenance Services cater to the ongoing need for system upkeep and user support, showing that as firms invest in legal tech, they simultaneously prioritize sustaining their technological investments. This interplay emphasizes an increasing trend towards comprehensive service offerings that encompass both strategy and maintenance extensively.
Consulting Services (Dominant) vs. Support and Maintenance Services (Emerging)
Consulting Services are dominant in the Legal Technology and Automation Services Market, characterized by their consultative approach to adopting innovative legal technologies. These services often involve in-depth assessments of clients' needs, crafting personalized implementation strategies, and offering insights into the best technologies suited for specific legal practices. On the other hand, Support and Maintenance Services are emerging as crucial players in the market, reflecting the growing recognition of the necessity for ongoing assistance post-implementation. These services ensure that legal tech tools function smoothly, offering troubleshooting, updates, and training to users. The synergy between these two segments underlines a complete service approach, where strategic planning meets the necessity of ongoing support, ensuring firms can fully leverage their technology investments.
Get more detailed insights about Legal Technology and Automation Services Market Request Free Sample
North America continues to lead the Legal Technology and Automation Services Market, holding a significant share of 8.25B in 2024. The growth is driven by increasing demand for efficiency in legal processes, regulatory compliance, and the adoption of AI technologies. The region's robust legal framework and investment in technology further catalyze market expansion, making it a hub for innovation in legal services. The competitive landscape is characterized by major players such as Thomson Reuters, LexisNexis, and DocuSign, which dominate the market. The U.S. is the primary contributor, with Canada also showing strong growth. The presence of established firms and startups alike fosters a dynamic environment, ensuring continuous advancements in legal technology solutions.
Europe's Legal Technology and Automation Services Market is valued at 4.95B, reflecting a growing trend towards digital transformation in the legal sector. Factors such as stringent data protection regulations and the need for operational efficiency are driving demand. The European Union's initiatives to promote digital innovation in legal services further support this growth, making the region a focal point for legal tech advancements. Leading countries like the UK, Germany, and France are at the forefront of this transformation, with a competitive landscape featuring key players like ZyLAB and Onit. The presence of a diverse range of startups and established firms enhances innovation, while regulatory frameworks encourage the adoption of legal technology solutions. "The European legal market is evolving rapidly, with technology playing a crucial role in enhancing service delivery," states a report from the European Commission.
The Asia-Pacific region is witnessing a burgeoning Legal Technology and Automation Services Market, currently valued at 2.75B. The growth is fueled by increasing legal complexities, a rising number of startups, and the demand for cost-effective solutions. Countries like Australia and Singapore are leading the charge, supported by favorable government policies that encourage technological adoption in the legal sector. The competitive landscape is diverse, with both local and international players vying for market share. Companies like Clio and Everlaw are making significant inroads, while the region's unique challenges present opportunities for innovative solutions. As legal professionals increasingly embrace technology, the market is poised for substantial growth in the coming years.
The Middle East and Africa region, with a market size of 0.45B, is gradually emerging in the Legal Technology and Automation Services sector. The growth is driven by increasing legal needs, economic diversification efforts, and a push towards digital transformation. Governments are recognizing the importance of legal tech in enhancing service delivery and efficiency, which is catalyzing market development. Countries like South Africa and the UAE are leading the way, with a growing number of startups and initiatives aimed at modernizing legal services. The competitive landscape is still developing, but the presence of key players and increasing investment in technology are promising signs for future growth. "The legal sector in the Middle East is on the brink of a technological revolution," states a report from the African Union.
The Legal Technology and Automation Services Market is currently characterized by a dynamic competitive landscape, driven by rapid technological advancements and an increasing demand for efficiency in legal processes. Key players such as Thomson Reuters (CA), LexisNexis (US), and Clio (CA) are strategically positioning themselves through innovation and partnerships. Thomson Reuters (CA) focuses on integrating AI capabilities into its legal research tools, enhancing user experience and operational efficiency. Meanwhile, LexisNexis (US) emphasizes its commitment to data analytics and machine learning, which allows for more precise legal insights. Clio (CA) is expanding its cloud-based solutions, catering to small and medium-sized law firms, thereby broadening its market reach. Collectively, these strategies contribute to a competitive environment that is increasingly reliant on technological innovation and customer-centric solutions.In terms of business tactics, companies are increasingly localizing their services to better meet regional demands, optimizing their supply chains to enhance service delivery. The market appears moderately fragmented, with a mix of established players and emerging startups. This structure allows for a diverse range of offerings, although the influence of key players remains substantial, as they set benchmarks for quality and innovation.In November Thomson Reuters (CA) announced a partnership with a leading AI firm to enhance its legal research platform, aiming to streamline workflows for legal professionals. This strategic move is likely to bolster its competitive edge by providing users with more intuitive and efficient tools, thereby reinforcing its market leadership. The integration of advanced AI capabilities could significantly reduce research time, allowing legal practitioners to focus on higher-value tasks.In October LexisNexis (US) launched a new suite of analytics tools designed to assist law firms in predicting case outcomes based on historical data. This initiative not only showcases the company's commitment to innovation but also positions it as a thought leader in the legal analytics space. By leveraging data-driven insights, LexisNexis (US) aims to empower legal professionals to make informed decisions, potentially transforming traditional legal practices.In September Clio (CA) expanded its operations into Europe, launching localized versions of its software tailored to the specific needs of European law firms. This strategic expansion reflects Clio's ambition to capture a larger share of the global market, particularly in regions where cloud-based legal solutions are gaining traction. By adapting its offerings to meet local regulations and practices, Clio is likely to enhance its competitive positioning in the international arena.As of December the competitive trends in the Legal Technology and Automation Services Market are increasingly defined by digitalization, sustainability, and the integration of AI technologies. Strategic alliances among key players are shaping the landscape, fostering innovation and enhancing service offerings. The shift from price-based competition to a focus on technological differentiation and supply chain reliability is evident. Moving forward, companies that prioritize innovation and adaptability are likely to thrive, as the market continues to evolve in response to emerging technologies and changing client expectations.





The Legal Technology and Automation Services Market is projected to grow at a 5.65% CAGR from 2025 to 2035, driven by increasing demand for efficiency, compliance, and digital transformation.
New opportunities lie in:
By 2035, the market is expected to be robust, reflecting substantial advancements in legal technology.
| MARKET SIZE 2024 | 16.5(USD Billion) |
| MARKET SIZE 2025 | 17.43(USD Billion) |
| MARKET SIZE 2035 | 30.2(USD Billion) |
| COMPOUND ANNUAL GROWTH RATE (CAGR) | 5.65% (2025 - 2035) |
| REPORT COVERAGE | Revenue Forecast, Competitive Landscape, Growth Factors, and Trends |
| BASE YEAR | 2024 |
| Market Forecast Period | 2025 - 2035 |
| Historical Data | 2019 - 2024 |
| Market Forecast Units | USD Billion |
| Key Companies Profiled | Thomson Reuters (CA), LexisNexis (US), Clio (CA), Everlaw (US), Relativity (US), DocuSign (US), iManage (US), ZyLAB (NL), Onit (US) |
| Segments Covered | Application, End Use, Deployment Type, Technology Type, Service Type |
| Key Market Opportunities | Integration of artificial intelligence enhances efficiency in the Legal Technology and Automation Services Market. |
| Key Market Dynamics | Rising demand for automation in legal processes drives innovation and competition among technology providers. |
| Countries Covered | North America, Europe, APAC, South America, MEA |
The projected market valuation for the Legal Technology and Automation Services Market in 2035 is 30.2 USD Billion.
The overall market valuation for the Legal Technology and Automation Services Market was 16.5 USD Billion in 2024.
The expected CAGR for the Legal Technology and Automation Services Market during the forecast period 2025 - 2035 is 5.65%.
The Contract Management segment is projected to grow from 4.0 USD Billion in 2024 to 7.0 USD Billion by 2035.
Key players in the market include Thomson Reuters, LexisNexis, Clio, Everlaw, Relativity, DocuSign, iManage, ZyLAB, and Onit.
The Cloud-Based deployment type is expected to grow from 6.6 USD Billion in 2024 to 12.1 USD Billion by 2035, surpassing the On-Premises segment.
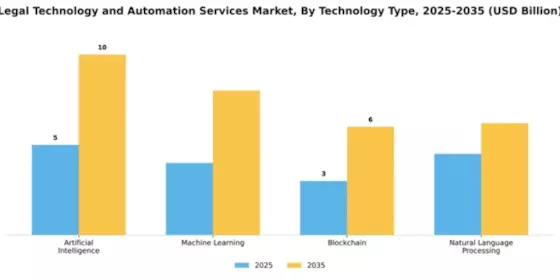
The market size for Artificial Intelligence is projected to reach 10.0 USD Billion by 2035, up from 5.0 USD Billion in 2024.
The Legal Service Providers segment is anticipated to grow from 4.5 USD Billion in 2024 to 9.2 USD Billion by 2035.
Support and Maintenance Services are expected to grow from 8.2 USD Billion in 2024 to 15.3 USD Billion by 2035.
By 2035, the market for Machine Learning is projected to reach 8.0 USD Billion, while Blockchain is expected to reach 6.0 USD Billion.


Kindly complete the form below to receive a free sample of this Report

“This is really good guys. Excellent work on a tight deadline. I will continue to use you going forward and recommend you to others. Nice job”


“Thanks. It’s been a pleasure working with you, please use me as reference with any other Intel employees.”


“Thanks for sending the report it gives us a good global view of the Betaïne market.”


“Thank you, this will be very helpful for OQS.”


“We found the report very insightful! we found your research firm very helpful. I'm sending this email to secure our future business.”


“I am very pleased with how market segments have been defined in a relevant way for my purposes (such as "Portable Freezers & refrigerators" and "last-mile"). In general the report is well structured. Thanks very much for your efforts.”


“I have been reading the first document or the study, ,the Global HVAC and FP market report 2021 till 2026. Must say, good info! I have not gone in depth at all parts, but got a good indication of the data inside!”


“We got the report in time, we really thank you for your support in this process. I also thank to all of your team as they did a great job.”


“The Automotive 48V ECU Components Procurement Intelligence Study” was a complex project, but the Market Research Future (MRFR) team handled it with quality, agility, and customer-centricity. They delivered all requested data on time and within the agreed scope. The team, including Shubhendra Anand and Rahul Gotadki, was always readily available to clarify questions and swiftly implement necessary adjustments, driving the project to a successful conclusion within a very demanding timeframe.
I would also like to specifically commend Akshay Agarwal for his responsiveness and support at every stage—from our initial inquiry on May 6th through to final delivery on June 18th. His dedication made the entire process seamless.”



