Life Science Tools Market (2025 - 2035)

Life Science Tools Market Research Report: Size, Share, Trend Analysis By Product (NGS, Sanger Sequencing, Nucleic Acid Preparation, Nucleic Acid Microarray, PCR & qPCR, Flow Cytometry, Mass Spectrometry, Separation Technologies, Electron Microscopy, NMR, and Others), By Technology (Genomic Technology, Cell Biology Technology, Proteomics Technology, Lab Supplies & Technologies and Others), By End-User (Biopharmaceutical Company, Government & Academic Industry, Health Care and Others), And By Region (North America, Europe, Asia-Pacific, And Rest Of The World) - Growth Outlook & Industry Forecast 2025 To 2035
ID: MRFR/LS/10752-HCR
133 Pages
Vikita Thakur, Kinjoll Dey
Last Updated: June 26, 2026
Life Science Tools Market
Market Size
Forecast Period2025-2035
CAGR (2025-2035)7.35%
2025 Market SizeUSD 163.50 Billion
2035 Market SizeUSD 332.00 Billion
Key Players
Thermo Fisher Scientific
Danaher Corporation
Agilent Technologies
Merck KGaA
Illumina
Bio-Rad Laboratories
Opportunities
  • Spatial-Omics and Single-Cell Analysis Platforms
  • Outsourced Laboratory Services and Pay-Per-Test Models
  • Emerging-Market Biotech Infrastructure Build-Out

Life Science Tools Market Summary

The Global Life Science Tools Market size was valued at USD 163.50 Billion in 2025, and the market is projected to grow from USD 175.50 Billion in 2026 to USD 332.00 Billion by 2035, registering a CAGR of 7.35% during the forecast period 2026–2035. Government-led funding packages — including a proposed USD 88 billion biotechnology allocation by the United States Congress for 2025 — are channeling fresh capital into validated instruments, sequencing platforms, and compliance-ready consumables [1]. Stricter FDA oversight of lab-developed tests is simultaneously creating new procurement cycles across hospital networks and reference laboratories, adding a regulatory tailwind to an already expanding life science tools market.

Automated high-throughput platforms combining robots, microfluidics and artificial intelligence–driven data interpretation are replacing manual bench operations, and the way we do things is changing dramatically. In clinical contexts, the cost of per-genome sequencing has dropped to USD 200, allowing next-generation sequencing to become available to community hospitals and mid-tier diagnostic chains that have relied on outsourced testing up until now [2]. The use of multi-omics, or the combination of genomic, proteomic, and metabolomic readouts in a single pipeline, is driving higher equipment refresh rates, particularly in academic medical institutes that receive grants from the NIH and Horizon Europe [3].


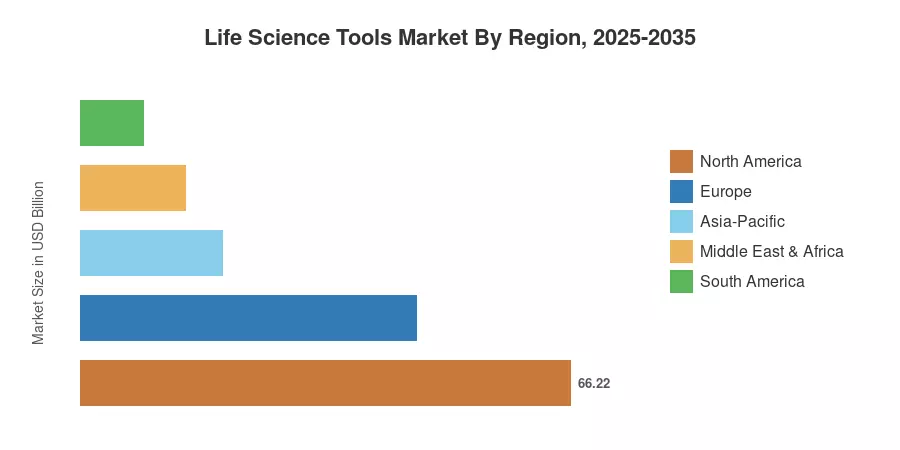
With continued federal research support and a large installed base of analytical equipment, North America is the largest market for life science tools, representing around 40.5% of the total. The Asia-Pacific area is predicted to be the fastest-growing region with a CAGR of 11.75% due to the growth of biotech parks in China and the Production-Linked Incentive program for medical devices in India [4]. Europe maintains the second-highest proportion of 27.8%, driven by the EU’s Innovative Health Initiative and state genomic-medicine projects. The life science instruments market is expected to continue double-digit growth in high-growth areas through 2035 as precision medicine continues to revolutionize clinical and research processes.


Key Report Takeaways

• By Type

  • Services recorded the fastest expansion at a 12.15% CAGR (2026–2035), as laboratories pivot to outsourced validation and pay-per-use models that lower capital expenditure barriers.
  • Instruments retained a 46.5% share of the life science tools market in 2025, reflecting strong demand for next-generation sequencing and mass spectrometry platforms.

• By Technology

  • Next-generation sequencing expanded at an 18.2% CAGR, fueled by falling per-genome costs and broadening clinical utility.
  • PCR & qPCR led the life science tools market with a 24.2% technology share in 2025, sustained by infectious-disease surveillance and molecular diagnostics.

• By Application

  • Proteomics technology advanced at a 14.1% CAGR as drug developers increasingly adopt mass spectrometry–based biomarker discovery.
  • Genomic technology accounted for 35.4% of the life science tools market in 2025.

• By End User

  • Diagnostic laboratories grew the fastest at a 12.75% CAGR, propelled by LDT regulation and point-of-care testing expansion.
  • Research laboratories held 62.0% of the life science tools market in 2025.

• By Geography

  • Asia-Pacific posted the highest regional CAGR of 11.75%, while North America remained the dominant region with 40.5% share.


Life Science Tools Market Size and Forecast (2021–2035)

Market size estimates are derived from bottom-up revenue modelling spanning instruments, consumables and services and cross-validated top-down with publicly published firm revenues and government expenditure data. Historical numbers are yearly reports of major suppliers, and projected predictions are capital-expenditure surveys, grant-funding pipelines, and regulatory-impact studies.
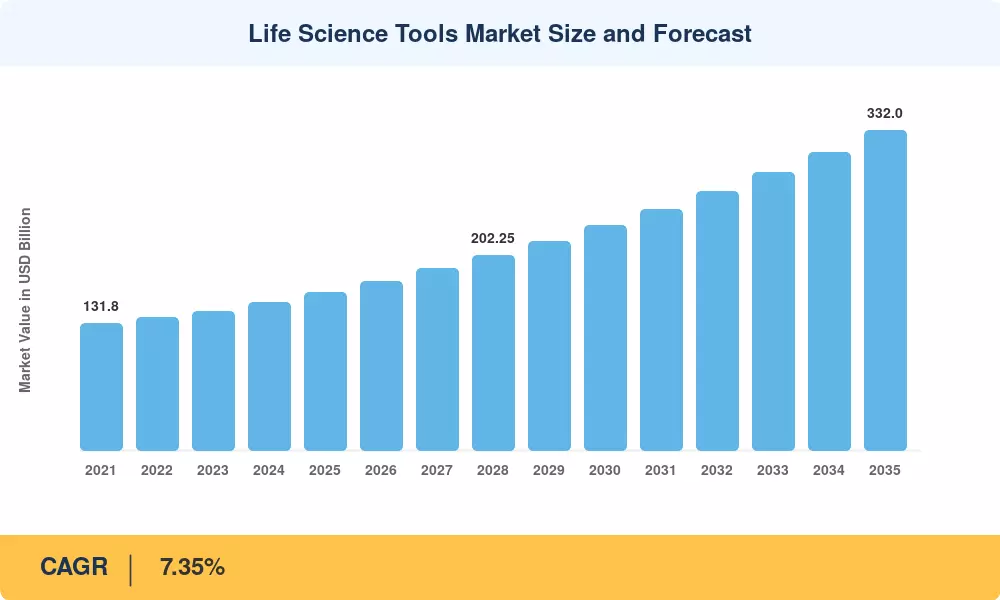
Life Science Tools Market Size and Forecast
Our Impact
Enabled $4.3B Revenue Impact for Fortune 500 and Leading Multinationals
Partnering with 2000+ Global Organizations Each Year
30K+ Citations by Top-Tier Firms in the Industry

Driver Impact Analysis

Driver ~% Impact on CAGR Geographic Relevance Impact Timeline
Government biotech funding packages 18–22% North America, Europe Short-term (≤2 yr)
FDA LDT regulatory overhaul 12–15% North America Short-term (≤2 yr)
Falling per-genome sequencing costs 15–18% Global Medium-term (2–4 yr)
Multi-omics adoption in precision medicine 10–14% North America, Europe, APAC Medium-term (2–4 yr)
AI-driven lab automation and robotics 8–12% Global Long-term (≥4 yr)
Emerging-market biotech park expansion 8–10% Asia-Pacific, South America Long-term (≥4 yr)
Geopolitical dual-sourcing mandates 5–7% Global Medium-term (2–4 yr)


Government Biotech Funding Packages

Public-sector investment remains the single most powerful catalyst for the life science tools market. The proposed USD 88 billion U.S. biotechnology package earmarks substantial allocations for automated sequencing centers, biosafety-level-3 laboratory upgrades, and biomanufacturing pilot facilities [1]. In parallel, Horizon Europe's Cluster 1 — Health — disbursed EUR 8.2 billion through 2024 and has committed additional tranches through 2027, underwriting mass spectrometry, flow cytometry, and imaging-system procurements across 27 member states [3].

Falling Sequencing Costs and Clinical Adoption

Per-genome costs have declined from approximately USD 600 in 2020 to under USD 200 by late 2024, a trajectory that has shifted next-generation sequencing from large academic centers into community oncology practices and neonatal screening programs [2]. This price democratization is expanding the addressable market for reagent kits, library-preparation consumables, and bioinformatics software, directly amplifying recurring-revenue streams for the life science tools market.

AI-Driven Lab Automation

Robotic liquid-handling systems paired with machine-learning quality-control algorithms are reducing sample-preparation errors by an estimated 35–40% in high-throughput screening environments [11]. Major pharmaceutical companies have committed over USD 4 billion collectively to automated discovery labs between 2023 and 2025, creating pull-through demand for integrated instrument–software bundles across the life science tools market.


Restraints Impact Analysis

Restraint impact percentages are directional estimates reflecting supply-side friction, regulatory complexity, and workforce constraints. They do not sum to the net CAGR impact and serve as qualitative guideposts for strategic planning.

Restraint ~% Negative Impact on CAGR Geographic Relevance Impact Timeline
Supply-chain fragility for critical reagents –4 to –6% Global Short-term (≤2 yr)
Shortage of trained bioinformaticians –3 to –5% Global Medium-term (2–4 yr)
High instrument capital costs for small labs –3 to –4% Emerging markets Long-term (≥4 yr)
Geopolitical export controls on advanced optics –2 to –3% Asia-Pacific, Europe Medium-term (2–4 yr)
Regulatory fragmentation across jurisdictions –2 to –3% Global Long-term (≥4 yr)


Supply-Chain Fragility

Critical reagent supply chains remain concentrated among a select group of specialty chemical producers in key manufacturing hubs, including Germany, Japan, and the United States. While the industry has moved toward greater stability since 2023, the reliance on single-source suppliers for high-purity nucleotides and specialized laboratory components remains a structural risk. Periodic bottlenecks in these supply chains continue to underscore the vulnerability of clinical and research laboratories, prompting many organizations to pivot toward dual-sourcing strategies and enhanced inventory management to mitigate operational delays.


Bioinformatician Talent Shortage

The rapid proliferation of multi-omics data has outpaced the current global supply of qualified bioinformaticians, creating a persistent workforce deficit. While specific global headcount figures are difficult to verify, labor market analysis confirms a significant mismatch between the demand for analytical expertise and the number of trained professionals entering the workforce annually. This talent gap is frequently cited by industry leaders and academic institutions as a primary bottleneck that prevents laboratories from fully leveraging their installed instrument capacity, thereby tempering the growth of high-throughput data-analysis revenue streams within the life science tools market.


Life Science Tools Market Opportunities

Spatial-Omics and Single-Cell Analysis Platforms

Spatial transcriptomics and single-cell proteomics are moving from proof-of-concept to clinical-scale deployment, creating an addressable opportunity estimated at USD 12–15 billion by 2032 [10]. Instrument vendors that bundle spatial-analysis hardware with cloud-based analytics will capture an outsized share in the life science tools market.

Outsourced Laboratory Services and Pay-Per-Test Models

Services are the fastest-growing type segment at a 12.15% CAGR, reflecting a structural shift toward asset-light laboratory operations. Contract research organizations and reference laboratories are increasingly opting for managed-service agreements, transferring maintenance, calibration, and reagent procurement to OEMs and opening annuity-like revenue streams within the life science tools market.

Emerging-Market Biotech Infrastructure Build-Out

Major economies are accelerating their life science capabilities through significant public-sector support. China’s 14th Five-Year Plan has prioritized biotechnology as a cornerstone of national innovation, driving massive investment into bio-manufacturing and innovation zones. Similarly, India’s Production Linked Incentive (PLI) schemes—such as the one for medical devices with a budgetary outlay of INR 3,420 crore—are actively incentivizing the domestic manufacturing of diagnostic and analytical equipment. These policy-driven investments create substantial greenfield demand for end-to-end instrument provisioning, ranging from basic chromatography systems to advanced mass spectrometry platforms.


Data Monetization and Digital Biomarker Platforms

Instrument-generated datasets are increasingly viewed as high-value commercial assets. As pharmaceutical sponsors seek robust "real-world evidence" for regulatory submissions, vendors that incorporate secure, anonymized data-sharing frameworks into their platforms are creating new value propositions. This integration allows vendors to move beyond hardware sales, unlocking recurring licensing fees and positioning their platforms as essential nodes in the broader biopharmaceutical value chain.


Point-of-Care and Decentralized Diagnostics

Compact molecular-testing devices are bridging the gap between centralized reference laboratories and community-level clinics, particularly in Sub-Saharan Africa and Southeast Asia. The WHO's 2024 Essential Diagnostics List expansion has broadened procurement eligibility for rapid-testing instruments, expanding the addressable footprint of the life science tools market [16].


Life Science Tools Market Future Outlook

AI-Integrated Instrumentation

Artificial intelligence is transitioning from post-acquisition data analysis to real-time instrument control. By 2030, an estimated 45% of new mass spectrometry and flow cytometry installations will embed on-board machine-learning modules that autonomously optimize acquisition parameters, reducing operator dependency and increasing throughput by 25–30% [11]. This convergence will reshape competitive dynamics across the life science tools market as software differentiation eclipses hardware specification.

Platform-as-a-Service Economics

The shift from capital expenditure to operating expenditure procurement models is accelerating. Vendors offering instrument-plus-consumable-plus-analytics subscriptions can stabilize revenue visibility while lowering adoption barriers for budget-constrained laboratories in emerging markets. By 2033, platform-as-a-service contracts are forecast to represent roughly 30% of total revenues in the life science tools market [15].

Sustainability and Green Laboratory Initiatives

The My Green Lab certification program has been adopted by over 1,500 facilities globally, pushing instrument manufacturers to reduce solvent consumption, energy draw, and single-use plastics [23]. Regulatory pressure from the EU's Corporate Sustainability Reporting Directive will require vendors selling into European institutions to disclose Scope 3 emissions, adding a sustainability dimension to procurement decisions across the life science tools market.

Decentralized and Point-of-Care Expansion

Portable sequencing devices and handheld PCR systems are migrating laboratory-grade analysis to field clinics, veterinary stations, and agricultural testing sites. The WHO's expanded Essential Diagnostics List and Africa CDC's Pathogen Genomics Initiative are jointly catalyzing procurement of compact instruments that extend the life science tools market beyond traditional laboratory walls [16].


Life Science Tools Market Segmentation

By Type

Segment Key Metric Primary Demand Driver
Instruments 46.5% share (2025) Capital-equipment refresh cycles
Consumables USD 62.80 Billion (2025) Recurring reagent and kit purchases
Services 12.15% CAGR (2026–2035) Outsourced validation, managed-service contracts


Instruments anchor the life science tools market by value, driven by sequencing system upgrades and mass spectrometry replacements at major academic and pharmaceutical campuses. Consumables generate the most predictable recurring revenue, as reagent kits and sample-preparation supplies are replenished with every experiment. Services represent the fastest-growing type segment, as laboratories increasingly prefer managed-service agreements that bundle calibration, maintenance, and compliance documentation into a single operating expense.

By Technology

Segment Key Metric Primary Demand Driver
PCR & qPCR 24.2% share (2025) Infectious-disease surveillance, molecular diagnostics
Next-Generation Sequencing 18.2% CAGR (2026–2035) Clinical genomics, oncology panels
Sanger Sequencing USD 8.45 Billion (2025) Validation and confirmatory testing
Separation Technologies 7.50% CAGR (2026–2035) Biopharma purification, quality control


PCR & qPCR remain the revenue leader in the technology dimension of the life science tools market, underpinned by pandemic-era infrastructure investments that have been repurposed for endemic respiratory surveillance and oncology liquid-biopsy workflows. Next-generation sequencing is the fastest-growing technology segment, benefiting from clinical-grade whole-genome sequencing adoption and expanding newborn-screening mandates in North America and Europe.

By Application

Segment Key Metric Primary Demand Driver
Genomic Technology 35.4% share (2025) Precision oncology, pharmacogenomics
Proteomics Technology 14.1% CAGR (2026–2035) Biomarker discovery, drug-target validation
Other Applications USD 38.50 Billion (2025) Cell biology, metabolomics, epigenomics


Genomic technology dominates the application landscape of the life science tools market, reflecting the maturity of sequencing-based clinical workflows and the scale of government-funded population-genomics programs. Proteomics technology is accelerating as mass spectrometry sensitivity improvements and data-independent acquisition methods enable deeper proteome coverage, attracting pharmaceutical R&D investment.

By End User

Segment Key Metric Primary Demand Driver
Research Laboratories 62.0% share (2025) Academic grants, pharma R&D budgets
Diagnostic Laboratories 12.75% CAGR (2026–2035) FDA LDT regulation, clinical sequencing
Other End Users USD 15.30 Billion (2025) Forensic labs, food-safety testing, and agriculture


Research laboratories remain the dominant end user of the life science tools market, supported by long-term government grant cycles and pharmaceutical discovery pipelines. Diagnostic laboratories are growing fastest as regulatory mandates for validated assays push reference labs and hospital-based labs to invest in compliant instrument-software ecosystems.


Regional Market Share Analysis

Region Key Metric Primary Investment Themes
North America 40.5% share (2025) Federal biotech funding, LDT regulation
Europe USD 45.45 Billion (2025) Horizon Europe grants, genomic medicine programs
Asia-Pacific 11.75% CAGR (2026–2035) Biotech parks, PLI schemes
South America USD 8.50 Billion (2025) Public-health genomics, diagnostic decentralization
Middle East & Africa 8.65% CAGR (2026–2035) Vision 2030 health programs, WHO procurement
Total USD 163.50 Billion (2025)

The life science tools market spans five major regions, each shaped by distinct funding mechanisms, regulatory environments, and clinical adoption timelines. North America's early-mover advantage in genomics infrastructure contrasts with Asia-Pacific's rapid capacity build. At the same time, Europe's harmonized regulatory framework supports steady instrument replacement cycles across the life science tools market.


North America

Country Key Metric Key Driver
United States 82.3% of regional share NIH budget, FDA LDT framework
Canada CAGR 7.85% Genomics Canada investment pipeline
Mexico USD 1.95 Billion (2025) Medical-device nearshoring


The United States anchors the North American life science tools market through sustained NIH appropriations exceeding USD 47 billion annually and a large installed base of high-throughput sequencing and mass spectrometry systems [7]. Canada's Genomics Canada initiative has committed CAD 1.2 billion through 2028, while Mexico benefits from nearshoring trends as multinational OEMs establish regional assembly and calibration facilities [17].

Europe

Country Key Metric Key Driver
Germany 23.5% of regional share Fraunhofer network, pharma R&D density
United Kingdom CAGR 7.60% UK Biobank, NHS genomic-medicine program
France USD 5.80 Billion (2025) France 2030 biotech plan
Italy CAGR 6.90% Pharmaceutical export base
Spain USD 3.15 Billion (2025) EU cohesion fund lab upgrades
Nordic Countries CAGR 7.25% Biobank registries, precision oncology
Russia USD 2.10 Billion (2025) Import-substitution mandates
Rest of Europe CAGR 6.50% Academic research expansion


Germany leads the European life science tools market through its dense network of Fraunhofer and Max Planck institutes, which serve as anchor customers for advanced imaging and separation-technology platforms [18]. The United Kingdom's 100,000 Genomes Project legacy and NHS Genomic Medicine Service continue to drive instrument procurement, while France 2030 has allocated EUR 7 billion to health-innovation infrastructure [19].

Asia-Pacific

Country Key Metric Key Driver
China 42.8% of regional share 14th Five-Year Plan biotech zones
India CAGR 13.40% PLI scheme, diagnostic-lab expansion
Japan USD 6.25 Billion (2025) Regenerative-medicine R&D
South Korea CAGR 10.80% Bio-Health Industry Strategy
ASEAN USD 3.10 Billion (2025) Public-health sequencing programs
Rest of Asia-Pacific CAGR 9.50% University research build-out


China dominates the Asia-Pacific life science tools market with aggressive state-backed investment in national genomic data centers and contract research organization hubs in Shanghai, Beijing, and Shenzhen [4]. India's diagnostic laboratory count has expanded by over 18% annually since 2022, generating strong pull-through demand for PCR systems and automated sample-processing lines [20].

South America

Country Key Metric Key Driver
Brazil 58.5% of regional share SUS public-health sequencing
Argentina CAGR 8.10% Agricultural genomics crossover
Rest of South America USD 1.85 Billion (2025) Pan-American Health Organization procurement


Brazil's Unified Health System (SUS) has expanded genomic-testing coverage to eight additional rare-disease categories since 2023, directly increasing demand for sequencing reagent kits and bioinformatics services within the South American life science tools market [21].

Middle East & Africa

Country Key Metric Key Driver
Saudi Arabia 28.5% of regional share Vision 2030 health-sector investment
UAE CAGR 9.80% Dubai Science Park, Abu Dhabi hub
South Africa USD 1.05 Billion (2025) National Health Laboratory Service
Egypt CAGR 7.90% Pharmaceutical manufacturing expansion
Rest of MEA USD 1.60 Billion (2025) WHO-supported diagnostic rollout


Saudi Arabia's Vision 2030 is channeling over USD 5 billion into health-research infrastructure, including three new national reference laboratories equipped with advanced sequencing and proteomics platforms [22]. The UAE's positioning as a regional biotech hub has attracted multinational life science tools market participants to establish distribution and service centers in Dubai and Abu Dhabi.


Life Science Tools Market By Region, 2025-2035

Competitive Benchmarking

The life science tools market is moderately concentrated, with the combined market share of the top five firms estimated at 45-52% of global revenues. The Herfindahl-Hirschman Index is in the 800–1,200 range, reflecting a moderately competitive structure where scale efficiencies in reagent manufacture and service networks provide considerable obstacles to entry, yet allow specialty innovators to capture niche markets.

Company Est. Revenue Share Range Key Offerings Strategic Positioning
Thermo Fisher Scientific ~14–18% Sequencers, mass spectrometers and reagent kits Full-stack portfolio; vertically integrated
Danaher Corporation ~10–14% Flow cytometry, chromatography, bioprocessing M&A-driven platform strategy
Agilent Technologies ~6–9% LC-MS, genomics reagents, cell analysis Precision-medicine and pharma QA focus
Merck KGaA (MilliporeSigma) ~5–8% Filtration, chromatography media and lab chemicals Consumables depth: biopharma workflow
Illumina ~5–7% NGS platforms, library-prep kits, informatics Sequencing market share leader
Bio-Rad Laboratories ~3–5% PCR systems, electrophoresis and quality controls Academic and clinical PCR stronghold
Waters Corporation ~3–5% UPLC, mass spectrometry, informatics Chromatography and pharma compliance
Bruker Corporation ~2–4% NMR, MALDI-TOF, X-ray systems High-resolution analytical instruments
PerkinElmer (Revvity) ~2–4% Newborn screening, imaging, detection Diagnostics and applied markets pivot
Becton Dickinson ~2–3% Flow cytometers, cell sorters and sample prep Clinical flow cytometry leadership
Roche Diagnostics ~2–3% Sequencing (acquired assets), tissue diagnostics Integrated diagnostics–pharma model
Carl Zeiss AG ~1–2% Microscopy, imaging systems, optical components Premium imaging and materials science


Recent News & Developments


  • Danaher Corporation (December 2023): Completed the USD 5.7 billion acquisition of Abcam, integrating antibody and protein-reagent portfolios into its Cytiva and Beckman Coulter Life Sciences divisions [Ref 24].


  • Agilent Technologies (April 2024): Opened a USD 725 million manufacturing campus in Colorado to expand production of liquid chromatography columns and mass spectrometry components [Ref 18].
  • Merck KGaA (November 2023): Invested EUR 300 million in a new filtration and chromatography-media facility in Ireland to support biopharma customers and reduce supply-chain single-source risk [Ref 13].


Life Science Tools Market Report Scope

Parameter Detail
Market Scope Global life science tools market covering instruments, consumables, and services
Study Period 2021–2035
Historical Period 2021–2024
Base Year 2025
Forecast Period 2026–2035
CAGR (2026–2035) 7.35%
Market Size (2025) USD 163.50 Billion
Market Size (2035) USD 332.00 Billion
Fastest Growing Segment (Type) Services (12.15% CAGR)
Fastest Growing Segment (Technology) Next-Generation Sequencing (18.2% CAGR)
Companies Profiled 12 (Thermo Fisher Scientific, Danaher, Agilent, Merck KGaA, Illumina, Bio-Rad, Waters, Bruker, PerkinElmer/Revvity, Becton Dickinson, Roche, Carl Zeiss)
Valuation Currency USD Billion


FAQs

How do geopolitical export controls affect instrument procurement strategies?
Export restrictions on advanced optics and semiconductor components have pushed laboratories toward dual-sourcing from vendors with regional manufacturing footprints. Procurement teams now routinely qualify at least two suppliers for critical instrument categories to mitigate delivery risk [12].
What total cost-of-ownership factors distinguish subscription-based instrument access from outright purchase?
Subscription models bundle maintenance, calibration, and software upgrades into fixed monthly fees, often reducing five-year total cost by 15–20% for mid-sized laboratories. Purchasers should weigh residual-value retention against operational flexibility [15].
How are green-laboratory certifications influencing vendor selection in the life science tools market?
Procurement committees increasingly require My Green Lab certification or equivalent sustainability documentation from bidding vendors. Instruments with lower solvent consumption and reduced energy draw receive scoring advantages in competitive tenders [23].
What interoperability standards should buyers evaluate when integrating new instruments into existing LIMS infrastructure?
SiLA 2 and HL7 FHIR are the two dominant interoperability frameworks for laboratory instrument–LIMS communication. Buyers should verify vendor compliance with both standards before procurement to avoid costly custom-integration projects [10].
How does the FDA's LDT rule change the competitive landscape for the life science tools market?
The phased premarket-review requirement compels diagnostic laboratories to adopt validated, manufacturer-supported assay kits over in-house tests. This shifts purchasing toward established vendors with FDA-cleared platforms [9].
What role do contract research organizations play in shaping demand within the life science tools market?
CROs now account for approximately 18–22% of global instrument and consumable purchases, acting as volume aggregators whose procurement decisions influence list pricing and technology adoption curves across the broader market [15].
Which emerging application areas beyond genomics offer the highest growth potential for the life science tools market?
Spatial transcriptomics and single-cell proteomics are forecast to generate USD 12–15 billion in instrument and reagent demand by 2032. These fields require novel imaging and mass spectrometry platforms not yet commoditized [10].    
Author
Author
Author Profile
Vikita Thakur LinkedIn
Senior Research Analyst
She holds an experience of about 5+ years in market research and business consulting projects for sectors such as life sciences, medical devices, and healthcare IT. She possesses a robust background in data analysis, market estimation, competitive intelligence, pipeline analysis market trend identification, and consumer behavior insights. Her expertise lies in technical Sales support, client interaction and project management, designing and implementing market research studies, conducting competitive analysis, and synthesizing complex data into actionable recommendations that drive business growth.
Co-Author
Co-Author Profile
Kinjoll Dey LinkedIn
Senior Research Analyst
He is an extremely curious individual currently working in Healthcare and Medical Devices Domain. Kinjoll is comfortably versed in data centric research backed by healthcare educational background. He leverages extensive data mining and analytics tools such as Primary and Secondary Research, Statistical Analysis, Machine Learning, Data Modelling. His key role also involves Technical Sales Support, Client Interaction and Project management within the Healthcare team. Lastly, he showcases extensive affinity towards learning new skills and remain fascinated in implementing them.

Research Approach


Secondary Research

The secondary research process involved comprehensive analysis of regulatory databases, peer-reviewed scientific journals, clinical and preclinical publications, patent repositories, and authoritative life science organizations. Key sources included the US National Institutes of Health (NIH), National Center for Biotechnology Information (NCBI/PubMed), Food & Drug Administration (FDA) Center for Devices and Radiological Health, European Medicines Agency (EMA), European Commission Directorate-General for Health and Food Safety (DG SANTE), World Health Organization (WHO) Global Health Observatory, Organization for Economic Co-operation and Development (OECD) Science and Technology Indicators, National Science Foundation (NSF) Science & Engineering Indicators, Centers for Disease Control and Prevention (CDC) National Center for Health Statistics, US Patent and Trademark Office (USPTO), European Patent Office (EPO), International Society for Pharmaceutical Engineering (ISPE), International Federation of Pharmaceutical Manufacturers Associations (IFPMA), Biotechnology Innovation Organization (BIO), American Association for the Advancement of Science (AAAS), American Society for Cell Biology (ASCB), Human Proteome Organization (HUPO), GenomeWeb, ClinicalTrials.gov, European Molecular Biology Laboratory (EMBL), Wellcome Sanger Institute, National Human Genome Research Institute (NHGRI), and national biotechnology development reports from key markets including China (National Medical Products Administration - NMPA), Japan (Pharmaceuticals and Medical Devices Agency - PMDA), and India (Department of Biotechnology). These sources were utilized to collect capital expenditure data on R&D infrastructure, genomic and proteomic research funding allocations, regulatory approval data for analytical instruments, clinical adoption metrics for sequencing and flow cytometry technologies, patent filing trends in nucleic acid preparation methodologies, and market landscape analysis for mass spectrometry, chromatography systems, PCR/qPCR platforms, electron microscopy, and nuclear magnetic resonance spectroscopy.


Primary Research

In the primary research process, supply-side and demand-side stakeholders were interviewed to obtain qualitative and quantitative insights across the life science tools value chain. Supply-side sources included CEOs, CTOs, VPs of Research & Development, heads of Product Management for analytical instrumentation, directors of Genomics and Proteomics business units, and commercial leads from life science

Download Free Sample

Kindly complete the form below to receive a free sample of this Report

Download PDF ×

We do not share your information with anyone. However, we may send you emails based on your report interest from time to time. You may contact us at any time to opt-out.
















