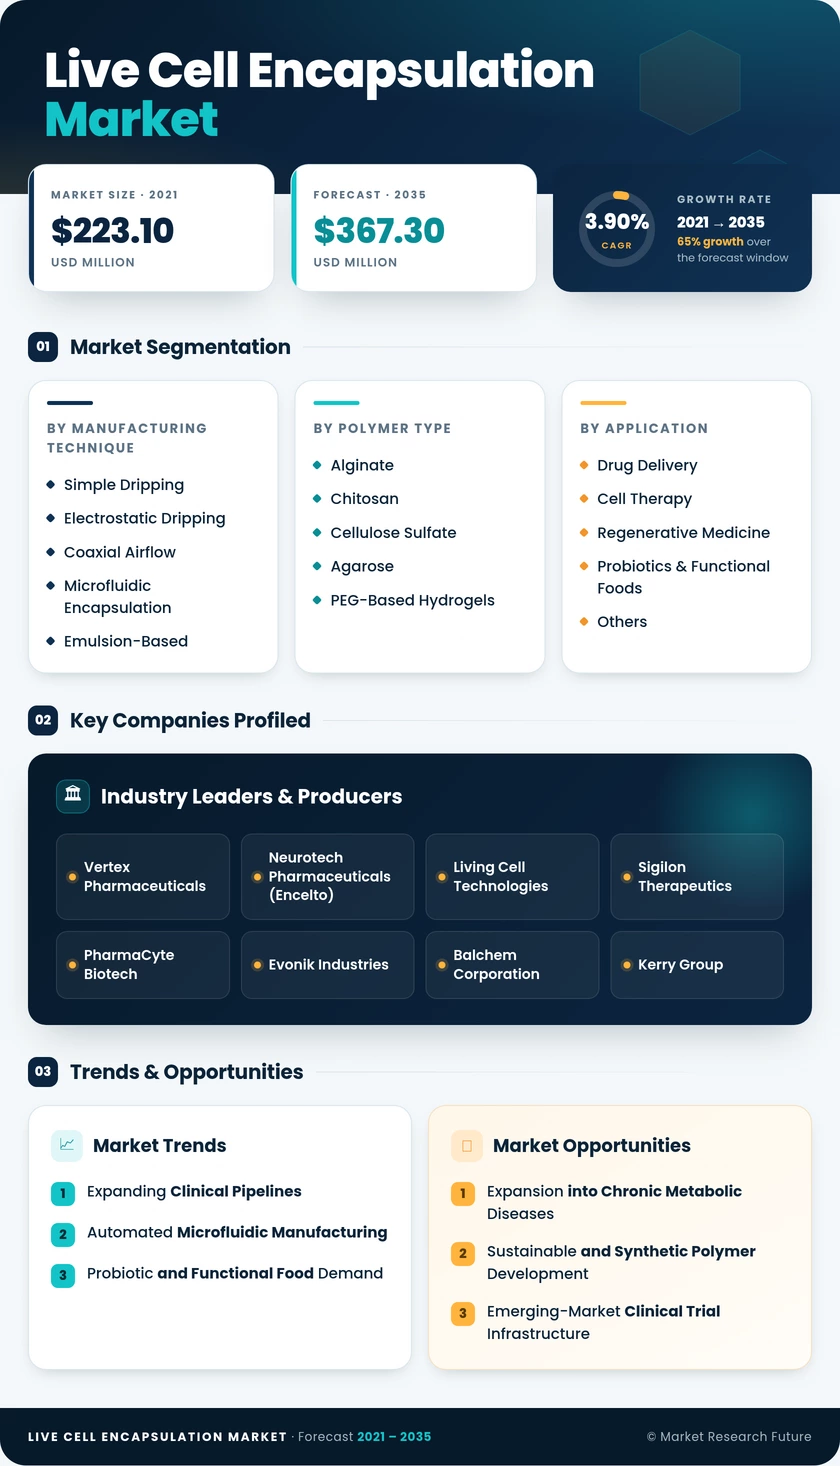
Live Cell Encapsulation Market (2026 - 2035)

Live Cell Encapsulation Market Research Report: Size, Share, Trend Analysis By Applications (Drug Delivery, Tissue Engineering, Regenerative Medicine, Biological Research), By Technology (Microencapsulation, Nanoencapsulation, Spray Drying, Coacervation), By End Use (Pharmaceuticals, Biotechnology, Research Laboratories, Academic Institutions), By Material (Polymers, Alginate, Hydrogels, Silicon) and By Regional (North America, Europe, South America, Asia Pacific, Middle East and Africa) - Growth Outlook & Industry Forecast 2025 To 2035

Forecast Period
2026-2035
CAGR
3.90%
2025 Market Size
USD 251.05 Million (2025)
2035 Market Size
USD 367.30 Million (2035)
Life Sciences ● Updated August 2026 Report ID: MRFR/LS/6302-HCR | Pages: 200 | Author: Vikita Thakur, Rahul Gotadki
  1. 1 Market Overview |
    1. 1.1 Study Assumptions & Market Definition |
    2. 1.2 Scope of the Study |
    3. 1.3 Research Methodology
  2. 2 Market Summary & Key Takeaways
  3. 3 Market Dynamics |
    1. 3.1 Market Drivers Analysis | |
      1. 3.1.1 Expanding Clinical Pipelines in Diabetes and Retinal Disease | |
      2. 3.1.2 Automated Microfluidic Manufacturing Platforms | |
      3. 3.1.3 Regulatory Acceptance of Encapsulated Probiotics | |
      4. 3.1.4 Rising Chronic Disease Prevalence Globally | |
      5. 3.1.5 Venture Capital Inflows into Biomaterial Start-Ups | |
      6. 3.1.6 Government Biotech Funding Programs (NIH, Horizon Europe) | |
      7. 3.1.7 Outsourcing Boom Lowering GMP Manufacturing Barriers |
    2. 3.2 Market Restraints Analysis | |
      1. 3.2.1 Limited GMP-Grade Raw-Material Supply | |
      2. 3.2.2 High Fixed Costs of Sterile Manufacturing | |
      3. 3.2.3 Regulatory Complexity for Combination Products | |
      4. 3.2.4 Immunogenicity and Fibrotic Host Responses | |
      5. 3.2.5 Reimbursement Uncertainty for Advanced Therapies |
    3. 3.3 Market Opportunity Analysis | |
      1. 3.3.1 Expansion into Chronic Metabolic Diseases | |
      2. 3.3.2 Sustainable and Synthetic Polymer Development | |
      3. 3.3.3 Emerging-Market Clinical Trial Infrastructure | |
      4. 3.3.4 Data-Driven Quality Control and Digital Twins | |
      5. 3.3.5 Personalized Autologous Encapsulation at Point-of-Care |
    4. 3.4 Industry Value Chain Analysis |
    5. 3.5 Porter's Five Forces Analysis
  4. 4 Global Live Cell Encapsulation Market Size & Forecast (2021–2035) |
    1. 4.1 Historical Market Size (2021–2025) |
    2. 4.2 Current & Forecast Market Size (2026–2035) |
    3. 4.3 Market Size by Revenue (USD Million) |
    4. 4.4 Year-over-Year Growth Analysis
  5. 5 Segmentation Analysis |
    1. 5.1 By Manufacturing Technique | |
      1. 5.1.1 Simple Dripping | |
      2. 5.1.2 Electrostatic Dripping | |
      3. 5.1.3 Coaxial Airflow | |
      4. 5.1.4 Microfluidic Encapsulation | |
      5. 5.1.5 Emulsion-Based |
    2. 5.2 By Polymer Type | |
      1. 5.2.1 Alginate | |
      2. 5.2.2 Chitosan | |
      3. 5.2.3 Cellulose Sulfate | |
      4. 5.2.4 Agarose | |
      5. 5.2.5 PEG-Based Hydrogels | |
      6. 5.2.6 Others |
    3. 5.3 By Application | |
      1. 5.3.1 Drug Delivery | |
      2. 5.3.2 Cell Therapy | |
      3. 5.3.3 Regenerative Medicine | |
      4. 5.3.4 Probiotics & Functional Foods | |
      5. 5.3.5 Others |
    4. 5.4 By Cell Source | |
      1. 5.4.1 Autologous | |
      2. 5.4.2 Allogeneic | |
      3. 5.4.3 Xenogeneic |
    5. 5.5 By Encapsulation Scale | |
      1. 5.5.1 Micro-Encapsulation | |
      2. 5.5.2 Macro-Encapsulation | |
      3. 5.5.3 Nano-Encapsulation |
    6. 5.6 By End User | |
      1. 5.6.1 Biopharma & Biotech Firms | |
      2. 5.6.2 Academic & Research Institutes | |
      3. 5.6.3 CROs | |
      4. 5.6.4 Food & Nutrition Companies
  6. 6 Regional Analysis |
    1. 6.1 North America | |
      1. 6.1.1 United States | |
      2. 6.1.2 Canada | |
      3. 6.1.3 Mexico |
    2. 6.2 Europe | |
      1. 6.2.1 Germany | |
      2. 6.2.2 United Kingdom | |
      3. 6.2.3 France | |
      4. 6.2.4 Italy | |
      5. 6.2.5 Spain | |
      6. 6.2.6 Nordic Countries | |
      7. 6.2.7 Russia | |
      8. 6.2.8 Rest of Europe |
    3. 6.3 Asia-Pacific | |
      1. 6.3.1 China | |
      2. 6.3.2 Japan | |
      3. 6.3.3 India | |
      4. 6.3.4 South Korea | |
      5. 6.3.5 ASEAN | |
      6. 6.3.6 Rest of Asia-Pacific |
    4. 6.4 South America | |
      1. 6.4.1 Brazil | |
      2. 6.4.2 Argentina | |
      3. 6.4.3 Rest of South America |
    5. 6.5 Middle East & Africa | |
      1. 6.5.1 Saudi Arabia | |
      2. 6.5.2 UAE | |
      3. 6.5.3 South Africa | |
      4. 6.5.4 Egypt | |
      5. 6.5.5 Rest of MEA
  7. 7 Competitive Landscape |
    1. 7.1 Market Share Analysis (2025) |
    2. 7.2 Competitive Benchmarking Matrix |
    3. 7.3 Company Profiles | |
      1. 7.3.1 Vertex Pharmaceuticals | |
      2. 7.3.2 Neurotech Pharmaceuticals (Encelto) | |
      3. 7.3.3 Living Cell Technologies | |
      4. 7.3.4 Sigilon Therapeutics | |
      5. 7.3.5 PharmaCyte Biotech | |
      6. 7.3.6 Evonik Industries | |
      7. 7.3.7 Balchem Corporation | |
      8. 7.3.8 Kerry Group | |
      9. 7.3.9 Microtek Inc. | |
      10. 7.3.10 Capsulae
  8. 8 Future Outlook & Strategic Recommendations (2026–2035) |
    1. 8.1 AI-Integrated Manufacturing and Process Optimization |
    2. 8.2 Platform Economics and CDMO Consolidation |
    3. 8.3 Convergence with Gene-Editing Technologies |
    4. 8.4 Sustainability and Circular Biomaterials
  9. 9 Recent Developments & News
  10. 10 Frequently Asked Questions (FAQs)
  11. 11 Report Scope & Methodology |
    1. 11.1 Study Period & Base Year |
    2. 11.2 Data Sources & Citations |
    3. 11.3 Abbreviations
  12. 12 LIST OF TABLES |
  13. TABLE 1 Global Live Cell Encapsulation Market Size & Forecast, by Revenue (USD Million), 2021–2035 |
  14. TABLE 2 Global Live Cell Encapsulation Market – Year-over-Year Growth Analysis, 2021–2035 |
  15. TABLE 3 Global Live Cell Encapsulation Market – Driver Impact Analysis, 2026–2035 |
  16. TABLE 4 Global Live Cell Encapsulation Market – Restraint Impact Analysis, 2026–2035 |
  17. TABLE 5 Global Live Cell Encapsulation Market Size, by Manufacturing Technique, 2021–2035 (USD Million) |
  18. TABLE 6 Global Live Cell Encapsulation Market Size, by Polymer Type, 2021–2035 (USD Million) |
  19. TABLE 7 Global Live Cell Encapsulation Market Size, by Application, 2021–2035 (USD Million) |
  20. TABLE 8 Global Live Cell Encapsulation Market Size, by Cell Source, 2021–2035 (USD Million) |
  21. TABLE 9 Global Live Cell Encapsulation Market Size, by Encapsulation Scale, 2021–2035 (USD Million) |
  22. TABLE 10 Global Live Cell Encapsulation Market Size, by End User, 2021–2035 (USD Million) |
  23. TABLE 11 Global Live Cell Encapsulation Market Size, by Region, 2021–2035 (USD Million) |
  24. TABLE 12 North America Live Cell Encapsulation Market Size, by Country, 2021–2035 (USD Million) |
  25. TABLE 13 Europe Live Cell Encapsulation Market Size, by Country, 2021–2035 (USD Million) |
  26. TABLE 14 Asia-Pacific Live Cell Encapsulation Market Size, by Country, 2021–2035 (USD Million) |
  27. TABLE 15 South America Live Cell Encapsulation Market Size, by Country, 2021–2035 (USD Million) |
  28. TABLE 16 Middle East & Africa Live Cell Encapsulation Market Size, by Country, 2021–2035 (USD Million) |
  29. TABLE 17 Competitive Benchmarking Matrix – Global Live Cell Encapsulation Market, 2025 |
  30. TABLE 18 Company Profiles – Key Players, Global Live Cell Encapsulation Market |
  31. TABLE 19 Recent Developments & Strategic Announcements, 2023–2025 |
  32. TABLE 20 Report Scope & Methodology Summary |
  33. TABLE 21 Detailed Sources and Citations |
  34. TABLE 22 North America Live Cell Encapsulation Market Size, by Manufacturing Technique, 2021–2035 (USD Million) |
  35. TABLE 23 North America Live Cell Encapsulation Market Size, by Polymer Type, 2021–2035 (USD Million) |
  36. TABLE 24 North America Live Cell Encapsulation Market Size, by Application, 2021–2035 (USD Million) |
  37. TABLE 25 North America Live Cell Encapsulation Market Size, by Cell Source, 2021–2035 (USD Million) |
  38. TABLE 26 North America Live Cell Encapsulation Market Size, by Encapsulation Scale, 2021–2035 (USD Million) |
  39. TABLE 27 North America Live Cell Encapsulation Market Size, by End User, 2021–2035 (USD Million) |
  40. TABLE 28 Europe Live Cell Encapsulation Market Size, by Manufacturing Technique, 2021–2035 (USD Million) |
  41. TABLE 29 Europe Live Cell Encapsulation Market Size, by Polymer Type, 2021–2035 (USD Million) |
  42. TABLE 30 Europe Live Cell Encapsulation Market Size, by Application, 2021–2035 (USD Million) |
  43. TABLE 31 Europe Live Cell Encapsulation Market Size, by Cell Source, 2021–2035 (USD Million) |
  44. TABLE 32 Europe Live Cell Encapsulation Market Size, by Encapsulation Scale, 2021–2035 (USD Million) |
  45. TABLE 33 Europe Live Cell Encapsulation Market Size, by End User, 2021–2035 (USD Million) |
  46. TABLE 34 Asia-Pacific Live Cell Encapsulation Market Size, by Manufacturing Technique, 2021–2035 (USD Million) |
  47. TABLE 35 Asia-Pacific Live Cell Encapsulation Market Size, by Polymer Type, 2021–2035 (USD Million) |
  48. TABLE 36 Asia-Pacific Live Cell Encapsulation Market Size, by Application, 2021–2035 (USD Million) |
  49. TABLE 37 Asia-Pacific Live Cell Encapsulation Market Size, by Cell Source, 2021–2035 (USD Million) |
  50. TABLE 38 Asia-Pacific Live Cell Encapsulation Market Size, by Encapsulation Scale, 2021–2035 (USD Million) |
  51. TABLE 39 Asia-Pacific Live Cell Encapsulation Market Size, by End User, 2021–2035 (USD Million) |
  52. TABLE 40 South America Live Cell Encapsulation Market Size, by Manufacturing Technique, 2021–2035 (USD Million) |
  53. TABLE 41 South America Live Cell Encapsulation Market Size, by Polymer Type, 2021–2035 (USD Million) |
  54. TABLE 42 South America Live Cell Encapsulation Market Size, by Application, 2021–2035 (USD Million) |
  55. TABLE 43 South America Live Cell Encapsulation Market Size, by Cell Source, 2021–2035 (USD Million) |
  56. TABLE 44 South America Live Cell Encapsulation Market Size, by Encapsulation Scale, 2021–2035 (USD Million) |
  57. TABLE 45 South America Live Cell Encapsulation Market Size, by End User, 2021–2035 (USD Million) |
  58. TABLE 46 Middle East & Africa Live Cell Encapsulation Market Size, by Manufacturing Technique, 2021–2035 (USD Million) |
  59. TABLE 47 Middle East & Africa Live Cell Encapsulation Market Size, by Polymer Type, 2021–2035 (USD Million) |
  60. TABLE 48 Middle East & Africa Live Cell Encapsulation Market Size, by Application, 2021–2035 (USD Million) |
  61. TABLE 49 Middle East & Africa Live Cell Encapsulation Market Size, by Cell Source, 2021–2035 (USD Million) |
  62. TABLE 50 Middle East & Africa Live Cell Encapsulation Market Size, by Encapsulation Scale, 2021–2035 (USD Million) |
  63. TABLE 51 Middle East & Africa Live Cell Encapsulation Market Size, by End User, 2021–2035 (USD Million)
  64. 13 LIST OF FIGURES |
  65. FIGURE 1 Global Live Cell Encapsulation Market Dynamics Overview |
  66. FIGURE 2 Industry Value Chain Analysis – Live Cell Encapsulation Market |
  67. FIGURE 3 Porter's Five Forces Analysis – Live Cell Encapsulation Market |
  68. FIGURE 4 Global Live Cell Encapsulation Market Size Trend (USD Million), 2021–2035 |
  69. FIGURE 5 Global Live Cell Encapsulation Market Share, by Manufacturing Technique, 2025 |
  70. FIGURE 6 Global Live Cell Encapsulation Market Share, by Polymer Type, 2025 |
  71. FIGURE 7 Global Live Cell Encapsulation Market Share, by Application, 2025 |
  72. FIGURE 8 Global Live Cell Encapsulation Market Share, by Cell Source, 2025 |
  73. FIGURE 9 Global Live Cell Encapsulation Market Share, by Encapsulation Scale, 2025 |
  74. FIGURE 10 Global Live Cell Encapsulation Market Share, by End User, 2025 |
  75. FIGURE 11 Global Live Cell Encapsulation Market Share, by Region, 2025 |
  76. FIGURE 12 North America Live Cell Encapsulation Market Size (USD Million), 2021–2035 |
  77. FIGURE 13 Europe Live Cell Encapsulation Market Size (USD Million), 2021–2035 |
  78. FIGURE 14 Asia-Pacific Live Cell Encapsulation Market Size (USD Million), 2021–2035 |
  79. FIGURE 15 South America Live Cell Encapsulation Market Size (USD Million), 2021–2035 |
  80. FIGURE 16 Middle East & Africa Live Cell Encapsulation Market Size (USD Million), 2021–2035 |
  81. FIGURE 17 Competitive Landscape – Market Share Analysis, 2025 |
  82. FIGURE 18 Competitive Benchmarking Radar Chart – Top 10 Players
Share::
Request Free Sample

Segmentation Quick Reference

DimensionSub-SegmentsDominant SegmentFastest Growing Segment
Manufacturing TechniqueSimple Dripping, Electrostatic Dripping, Coaxial Airflow, Microfluidic Encapsulation, Emulsion-BasedSimple DrippingMicrofluidic Encapsulation
Polymer TypeAlginate, Chitosan, Cellulose Sulfate, Agarose, PEG-Based Hydrogels, OthersAlginatePEG-Based Hydrogels
ApplicationDrug Delivery, Cell Therapy, Regenerative Medicine, Probiotics & Functional Foods, OthersDrug DeliveryProbiotics & Functional Foods
Cell SourceAutologous, Allogeneic, XenogeneicAutologousAllogeneic
Encapsulation ScaleMicro-Encapsulation, Macro-Encapsulation, Nano-EncapsulationMicro-EncapsulationNano-Encapsulation
End UserBiopharma & Biotech Firms, Academic & Research Institutes, CROs, Food & Nutrition CompaniesBiopharma & Biotech FirmsFood & Nutrition Companies


Market Segmentation Overview

By Manufacturing Technique

Sub-SegmentKey Trend
Simple DrippingContinued dominance in early-stage research due to low equipment costs
Electrostatic DrippingImproved bead uniformity attracting mid-scale producers
Coaxial AirflowGaining traction for scalable industrial-grade production
Microfluidic EncapsulationRapid adoption of automated GMP-certified platforms
Emulsion-BasedNiche applications in nano-scale encapsulation research


Manufacturing technique selection is driven by trade-offs between throughput, capsule uniformity, and regulatory readiness. Microfluidic platforms are closing the gap on simple dripping in terms of installed base as automation reduces operator dependency and improves batch reproducibility.

By Polymer Type

Sub-SegmentKey Trend
AlginateRemains gold standard with broadest regulatory precedent
ChitosanGrowing use in wound-healing and antimicrobial applications
Cellulose SulfateSynthetic alternative gaining momentum in non-animal-derived formulations
AgarosePreferred for temperature-sensitive cell types requiring thermal gelation
PEG-Based HydrogelsFastest-growing class due to chemically tunable degradation profiles
OthersEmerging silk-elastin and collagen-based materials in preclinical development


Polymer selection is increasingly guided by application-specific requirements rather than one-size-fits-all approaches. The trend toward synthetic and plant-derived alternatives reflects both supply-chain resilience concerns and growing demand for non-animal-origin materials.

By Application

Sub-SegmentKey Trend
Drug DeliveryLate-stage diabetes and retinal disease programs driving investment
Cell TherapyImmunoprotected implant programs advancing toward commercialization
Regenerative MedicineConvergence with tissue-engineering scaffolds and 3D bioprinting
Probiotics & Functional FoodsRegulatory acceptance enabling premium consumer products
OthersEmerging biosensor and agricultural biocontrol applications


Drug delivery remains the core application, but functional food applications are growing disproportionately fast as consumer health awareness and regulatory harmonization expand the addressable market.

By Cell Source

Sub-SegmentKey Trend
AutologousPersonalized medicine approach minimizing rejection risk
AllogeneicOff-the-shelf scalability enabling standardized production
XenogeneicPorcine islet programs providing alternative cell supply


The shift toward allogeneic cell sources reflects the industry's need for scalable, inventory-ready products that can serve larger patient populations without per-patient cell harvesting.

By Encapsulation Scale

Sub-SegmentKey Trend
Micro-EncapsulationDominant clinical and commercial format across therapeutic applications
Macro-EncapsulationRetrievable device designs preferred for implantable applications
Nano-EncapsulationEarly-stage research exploring targeted intracellular delivery


Micro-encapsulation dominates due to superior diffusion kinetics and established manufacturing protocols, while nano-encapsulation remains largely in the research phase.

By End User

Sub-SegmentKey Trend
Biopharma & Biotech FirmsLargest spenders driving clinical pipeline investments
Academic & Research InstitutesGrant-funded discovery programs feeding early-stage innovation
CROsGrowing outsourced preclinical and manufacturing services
Food & Nutrition CompaniesRapidly expanding into encapsulated probiotic product lines


Biopharma and biotech firms dominate end-user spending, but food and nutrition companies represent the fastest-growing end-user category as encapsulated probiotics move from specialty ingredients to mainstream consumer products.


 

Share::
Request Free Sample
Download PDF ×

We do not share your information with anyone. However, we may send you emails based on your report interest from time to time. You may contact us at any time to opt-out.