Segmentation Quick Reference
| Dimension | Sub-Segments | Dominant Segment | Fastest Growing Segment |
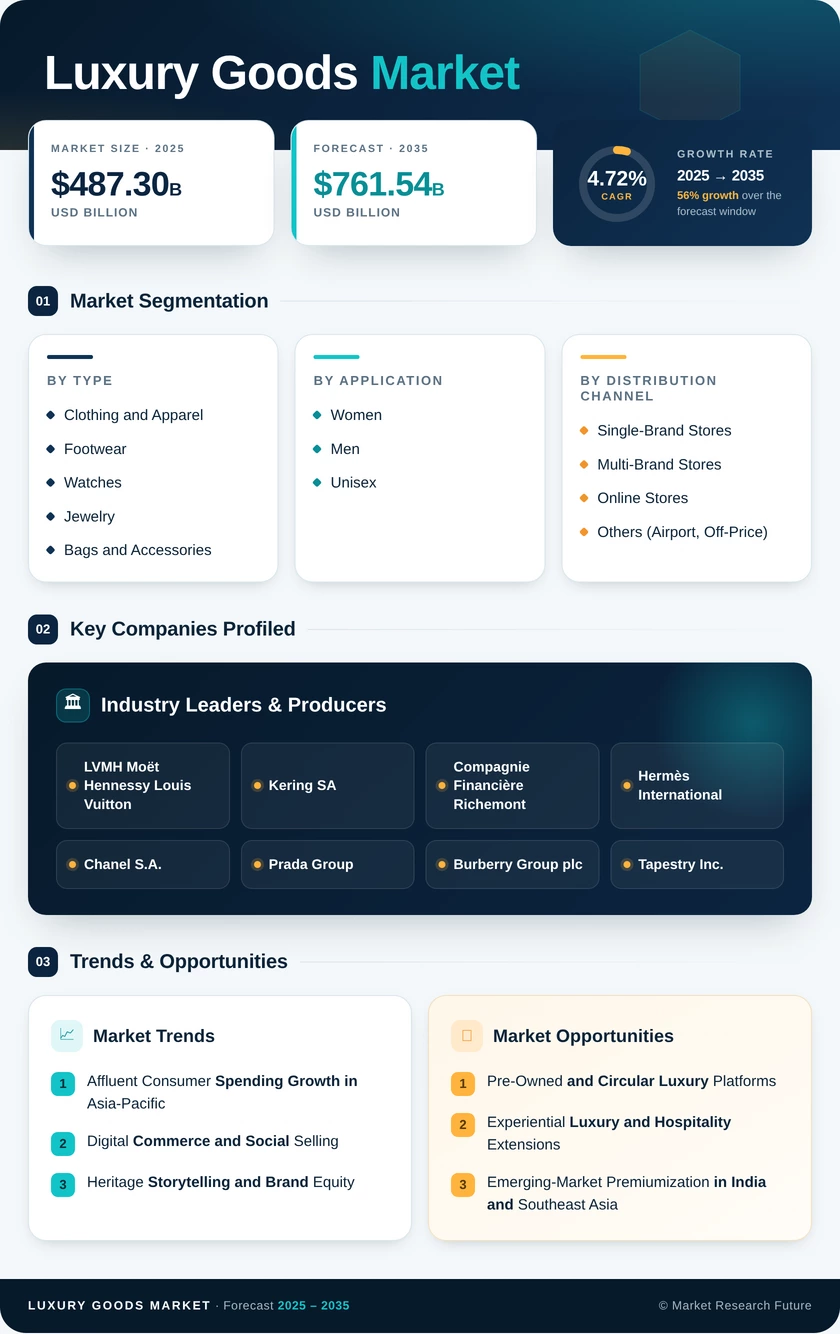
| Product Type | Clothing and Apparel, Footwear, Watches, Jewelry, Bags and Accessories, Others | Clothing and Apparel | Watches |
| End User | Women, Men, Unisex | Women | Men |
| Distribution Channel | Single-Brand Stores, Multi-Brand Stores, Online Stores, Others | Single-Brand Stores | Online Stores |
| Geography | North America, Europe, Asia-Pacific, South America, Middle East & Africa | Europe | Asia-Pacific |
Market Segmentation Overview
By Product Type
| Sub-Segment | Key Trend |
| Clothing and Apparel | Gender-fluid collections and direct-to-consumer drops driving volume |
| Footwear | Luxury sneaker collaborations bridging streetwear and couture |
| Watches | Investment-grade timepieces and certified pre-owned programs gaining traction |
| Jewelry | Lab-grown diamond disruption alongside traditional fine jewelry demand |
| Bags and Accessories | Waitlist-based scarcity models sustaining price premiums |
| Others (Fragrances, Cosmetics) | Niche perfumery and clean beauty formulations entering premium tier |
Clothing and apparel remains the revenue anchor, while watches and bags command the highest average transaction values — making product-type segmentation a critical lens for understanding revenue composition across the Luxury Goods Market.
By End User
| Sub-Segment | Key Trend |
| Women | Cross-category loyalty driving repeat purchasing and brand advocacy |
| Men | Menswear premiumization expanding from formal to casual and grooming |
| Unisex | Gender-neutral collections attracting Gen-Z consumers globally |
Women continue to represent the majority of luxury purchases, but the male segment is closing the gap at an accelerated pace as brands invest in dedicated menswear creative directors and standalone boutiques.
By Distribution Channel
| Sub-Segment | Key Trend |
| Single-Brand Stores | Flagship experiential investments exceeding USD 50 million per location |
| Multi-Brand Stores | Department-store concession model under pressure from DTC shifts |
| Online Stores | Social commerce and mobile-first checkout accelerating digital adoption |
| Others (Airport, Off-Price) | Travel-retail luxury concessions expanding in Gulf and APAC hubs |
Single-brand stores remain the primary revenue channel, but online stores are rapidly gaining share as digital infrastructure matures and consumer comfort with purchasing high-value items remotely increases.
By Geography
| Sub-Segment | Key Trend |
| North America | Resilient demand anchored by US department stores and digital DTC |
| Europe | Heritage tourism and artisanal manufacturing driving sustained dominance |
| Asia-Pacific | Wealth creation in China and India reshaping global demand patterns |
| South America | Brazil-centric premiumization with currency-hedged pricing strategies |
| Middle East & Africa | Mega-project retail developments and zero-tax shopping corridors |
Europe's established infrastructure and cultural capital sustain its leading position, while Asia-Pacific's rapid wealth accumulation is positioning the region as the primary growth engine for the next decade.