Download Free Sample
Kindly complete the form below to receive a free sample of this Report
Marine Structural Repair Services Market Research Report Information By End Use (Commercial Vessels, Naval Vessels, Fishing Vessels, Yachts, Research Vessels), By Application (Shipbuilding, Ship Repair, Offshore Structures, Marine Infrastructure, Dredging), By Service Type (Inspection Services, Maintenance Services, Repair Services, Reconstruction Services, Consultation Services), By Material Type (Steel, Aluminum, Composite Materials, Concrete, Fiberglass) And By Region (North America, Europe, Asia-Pacific, And Rest Of The World) – Market Forecast Till 2035.
As per MRFR analysis, the Marine Structural Repair Services Market was estimated at 3.5 USD Billion in 2024. The Marine Structural Repair Services industry is projected to grow from 3.65 USD Billion in 2025 to 5.5 USD Billion by 2035, exhibiting a compound annual growth rate (CAGR) of 4.19% during the forecast period 2025 - 2035.
The Marine Structural Repair Services Market is poised for growth driven by technological advancements and increasing regulatory demands.
| 2024 Market Size | 3.5 (USD Billion) |
| 2035 Market Size | 5.5 (USD Billion) |
| CAGR (2025 - 2035) | 4.19% |
Damen Shipyards Group (NL), Babcock International Group (GB), Fincantieri (IT), Thyssenkrupp Marine Systems (DE), Huntington Ingalls Industries (US), Naval Group (FR), BAE Systems (GB), Austal (AU), Kawasaki Heavy Industries (JP)
Our Impact
Enabled $4.3B Revenue Impact for Fortune 500 and Leading Multinationals
Partnering with 2000+ Global Organizations Each Year
30K+ Citations by Top-Tier Firms in the Industry
The Marine Structural Repair Services Market is currently experiencing a dynamic evolution, driven by various factors including technological advancements and increasing environmental regulations. As the global maritime industry continues to expand, the demand for specialized repair services is likely to rise. This market encompasses a wide range of services, including maintenance, inspection, and rehabilitation of marine structures such as ships, offshore platforms, and harbors. The emphasis on sustainability and safety is becoming more pronounced, prompting stakeholders to seek innovative solutions that not only address structural integrity but also minimize environmental impact. Moreover, the competitive landscape of the Marine Structural Repair Services Market is characterized by a growing number of players, each striving to differentiate themselves through enhanced service offerings and customer engagement. Collaboration between service providers and technology firms appears to be a key strategy, as it enables the integration of advanced materials and techniques into repair processes. This trend suggests a shift towards more efficient and effective repair methodologies, which could potentially reshape the market dynamics in the coming years. As the industry adapts to these changes, the focus on quality, reliability, and compliance with international standards remains paramount, ensuring that marine structures can withstand the challenges posed by harsh marine environments.
The Marine Structural Repair Services Market is witnessing a notable trend towards the integration of advanced technologies. Innovations such as robotics, drones, and artificial intelligence are being increasingly utilized to enhance inspection and repair processes. This technological shift not only improves efficiency but also reduces the risks associated with traditional methods, thereby ensuring higher safety standards.
There is a growing emphasis on sustainability within the Marine Structural Repair Services Market. Stakeholders are increasingly prioritizing eco-friendly materials and practices in repair operations. This trend reflects a broader commitment to environmental stewardship, as companies seek to minimize their ecological footprint while maintaining structural integrity.
The Marine Structural Repair Services Market is also influenced by stringent regulatory frameworks aimed at ensuring safety and environmental protection. Compliance with these regulations is becoming a critical factor for service providers, as failure to adhere can result in significant penalties. This trend underscores the importance of maintaining high standards in repair services to meet both legal and customer expectations.
The Marine Structural Repair Services Market is influenced by the aging fleet of vessels currently in operation. Many shipping companies are operating older ships that require more frequent maintenance and repair services. As vessels age, they become more susceptible to structural issues, which can lead to costly downtime if not addressed promptly. Data indicates that a significant portion of the global fleet is over 20 years old, highlighting the urgent need for repair services. This trend creates a robust market for structural repair services, as operators seek to extend the lifespan of their vessels while ensuring compliance with safety standards. The Marine Structural Repair Services Market is thus positioned to capitalize on the increasing demand for repairs and refurbishments of aging maritime assets.
The Marine Structural Repair Services Market is experiencing growth due to the rising maritime trade activities. As international trade expands, the demand for shipping vessels increases, leading to a higher need for maintenance and repair services. According to recent data, the volume of global maritime trade is projected to grow significantly, which in turn drives the demand for structural repairs on ships and offshore platforms. This trend suggests that as more vessels are in operation, the likelihood of wear and tear increases, necessitating timely repair services to ensure safety and compliance with maritime regulations. Consequently, companies in the Marine Structural Repair Services Market are likely to benefit from this surge in trade, as they provide essential services to maintain the operational integrity of maritime assets.
The Marine Structural Repair Services Market is significantly influenced by the rising offshore oil and gas activities. As exploration and production in offshore environments expand, the need for structural integrity in platforms and vessels becomes paramount. The offshore sector is characterized by harsh conditions that can lead to accelerated wear and tear on structures. Consequently, there is a growing demand for specialized repair services to maintain the safety and functionality of these assets. Data suggests that investments in offshore oil and gas are expected to increase, further driving the need for repair services. This trend indicates that the Marine Structural Repair Services Market is well-positioned to benefit from the ongoing expansion of offshore activities, as companies seek reliable partners for their structural repair needs.
The Marine Structural Repair Services Market is increasingly shaped by stringent environmental regulations. Governments and international bodies are implementing stricter guidelines to minimize the environmental impact of maritime operations. This has led to a heightened focus on the maintenance and repair of vessels to ensure compliance with these regulations. Companies in the Marine Structural Repair Services Market are now required to adopt eco-friendly practices and materials in their repair processes. As a result, there is a growing demand for services that not only address structural integrity but also adhere to environmental standards. This trend indicates that businesses that prioritize compliance and sustainability are likely to gain a competitive edge in the market, as they align with the evolving regulatory landscape.
The Marine Structural Repair Services Market is benefiting from technological advancements that enhance repair techniques. Innovations such as advanced materials, robotics, and digital monitoring systems are revolutionizing the way repairs are conducted. These technologies not only improve the efficiency of repair processes but also enhance the quality and durability of repairs. For instance, the use of composite materials can significantly extend the lifespan of repaired structures. Furthermore, data suggests that companies adopting these advanced techniques are likely to see a reduction in repair times and costs, making them more competitive in the Marine Structural Repair Services Market. As technology continues to evolve, it is expected that the industry will see further improvements in repair methodologies, leading to better service offerings.
In the Marine Structural Repair Services Market, the application segments show diverse dynamics with Ship Repair holding the largest market share. This dominance arises from the continual demand for maintenance and retrofitting of existing vessels, which is crucial for operational efficiency and longevity. Ship Repair services are essential for ensuring safety and compliance with regulatory standards, thereby reinforcing their significance in this market. Conversely, Shipbuilding is recognized as the fastest-growing segment in this market. The surge in demand for new vessels, driven by expanding global trade and advancements in marine technology, is stimulating rapid growth in shipbuilding. Factors such as increased investments in new ship technologies and renovation projects are fueling this trend, resulting in heightened competition among shipbuilders to meet emerging needs.
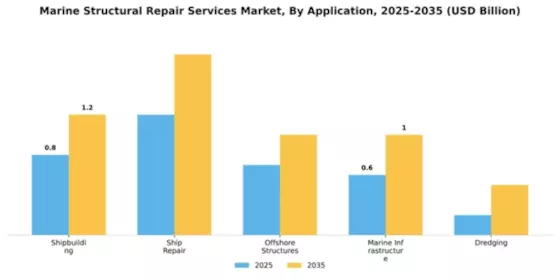
Ship Repair (Dominant) vs. Offshore Structures (Emerging)
Ship Repair services play a dominant role in the Marine Structural Repair Services Market due to their critical importance in maintaining operational vessels. This segment includes a range of activities aimed at restoring and enhancing the structural integrity of ships, ensuring compliance with safety regulations, and minimizing downtimes. The nature of this service often involves both routine and unexpected repairs, which increasing demand from aging fleets and regulatory pressures. In contrast, Offshore Structures represent an emerging market segment as the demand for oil and gas exploration continues to rise. These services involve the maintenance of infrastructural assets like oil rigs and wind farms, adapting to evolving energy requirements. While Ship Repair remains foundational, Offshore Structures are increasingly gaining attention due to shifts towards sustainable energy solutions, positioning them as a forward-looking priority for service providers.
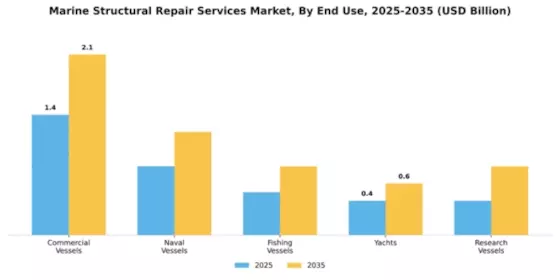
In the Marine Structural Repair Services Market, Inspection Services hold the largest market share among various service types. This dominance can be attributed to the increasing emphasis on safety regulations and the need for regular inspections to maintain the integrity of marine structures. On the other hand, Repair Services, while not the largest, are recognized as the fastest-growing segment, driven by the rising incidence of structural damages due to environmental impacts and wear over time. The growth trends in this segment reflect a broader shift towards proactive maintenance and timely interventions to extend the lifecycle of marine structures. As vessels age and regulatory pressures increase, the demand for both Inspection and Repair Services is accelerating. Factors such as advancements in repair technologies and growing awareness of the importance of preventive measures further bolster the growth potential for these services, particularly in emerging markets.
Inspection Services (Dominant) vs. Repair Services (Emerging)
Inspection Services are characterized by their fundamental role in ensuring compliance with safety standards in the marine industry. As the dominant segment within the Marine Structural Repair Services Market, this service encompasses thorough evaluations of marine structures to identify potential issues before they escalate. Emphasizing quality and regulatory adherence, Inspection Services not only protect assets but also support sustainability through regular assessments. On the other hand, Repair Services are emerging due to their essential function in addressing and rectifying damage. This segment is increasingly vital as vessels and infrastructure face more consistent operational stresses and environmental challenges. Repair Services focus on restoring structural integrity and ensuring reliability, thus contributing significantly to the longevity and operational efficiency of marine assets.
The Marine Structural Repair Services Market is significantly influenced by the type of materials used in marine structures, where Steel currently dominates the market. Its durability and strength make it the preferred choice for shipbuilding and repair, capturing the largest share among the various material types. In contrast, Composite Materials are witnessing rapid growth, driven by their lightweight nature and resistance to corrosion, attracting increasing demand in modern marine applications. Moreover, Aluminum, Concrete, and Fiberglass also play essential roles, albeit at a smaller scale. Aluminum is favored for its lightweight properties, while Concrete is strong in certain structural applications. Fiberglass, known for its resistance to environmental degradation, although smaller in share, is slowly gaining traction in niche markets, showcasing the diverse material landscape in marine structural repairs.
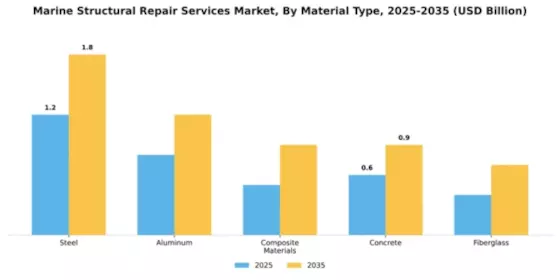
Steel (Dominant) vs. Composite Materials (Emerging)
Steel remains a dominant material in the Marine Structural Repair Services Market due to its unbeatable strength, longevity, and repairability, making it the backbone of many vessels' structural integrity. Its properties ensure that ships can withstand harsh marine environments, leading to its widespread use. Conversely, Composite Materials are emerging as a viable alternative, particularly in new builds and repairs. With advancements in technology, these materials offer benefits like reduced weight and enhanced fuel efficiency, appealing to shipbuilders looking to innovate. The flexibility and growing acceptance of composites in applications traditionally reserved for metal highlight a significant shift in repair methodologies, signaling stronger market penetration, especially for environmentally-conscious ship owners.
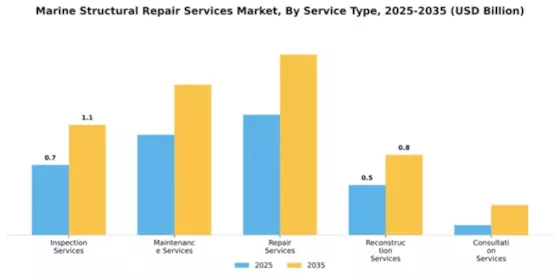
In the Marine Structural Repair Services Market, commercial vessels hold the largest market share among all end-use segments. They include cargo ships, tankers, and container ships, which require regular maintenance and repair due to their extensive use in global trade. Following behind are naval vessels, which also represent a significant portion of the market, driven by government investments in defense and maritime security. Fishing vessels and research vessels follow, with yachts capturing a growing interest due to increased leisure activities and tourism. Yachts are recognized as the fastest-growing segment in the Marine Structural Repair Services Market. The expansion of the luxury goods market, coupled with rising disposable incomes, has led to an increase in yacht ownership and usage. This trend is supported by a growing emphasis on leisure and recreational activities, especially in coastal regions. Additionally, environmental regulations are pushing for more advanced repair solutions, ensuring that even luxury vessels remain compliant and well-maintained as they become more popular among affluent consumers.
Commercial Vessels: Dominant vs. Yachts: Emerging
Commercial vessels are the backbone of global shipping, demanding regular structural repairs and extensive maintenance to ensure safety and compliance. Their dominance in the market is fueled by the critical role they play in international trade, necessitating prompt repair services to minimize downtime. In contrast, yachts represent an emerging segment characterized by their appeal to affluent consumers seeking personalized luxury experiences. This segment benefits from growing interest in sailing and recreational boating, which drives demand for specialized repair services tailored to luxury specifications. While commercial vessels rely heavily on larger repair docks and facilities, yacht repairs often occur in more varied settings, from small local shops to specialized marine yards, reflecting the diverse preferences of yacht owners.
Get more detailed insights about Marine Structural Repair Services Market Request Free Sample
North America leads the Marine Structural Repair Services Market with a share of 1.75B in 2024. The region's growth is driven by a robust maritime industry, increasing demand for ship maintenance, and stringent regulatory standards aimed at enhancing safety and environmental compliance. The presence of advanced shipyards and a skilled workforce further catalyze market expansion, making it a hub for innovation and service excellence. The United States stands out as the primary player, hosting key companies like Huntington Ingalls Industries and BAE Systems. The competitive landscape is characterized by significant investments in technology and infrastructure, ensuring high-quality repair services. Additionally, government initiatives to modernize the naval fleet and enhance maritime security are expected to bolster demand, solidifying North America's position as a market leader.
Europe's Marine Structural Repair Services Market is valued at 1.0B, reflecting a growing demand for repair and maintenance services driven by an aging fleet and increasing environmental regulations. The region benefits from strong maritime policies and funding initiatives aimed at enhancing sustainability and safety in marine operations. Regulatory frameworks are evolving to support innovation, which is crucial for meeting the challenges of modern maritime activities. Leading countries such as Germany, France, and Italy are at the forefront, with companies like Fincantieri and Thyssenkrupp Marine Systems playing pivotal roles. The competitive landscape is marked by collaborations between private firms and governmental bodies to advance repair technologies. As Europe invests in green technologies and sustainable practices, the market is poised for significant growth, supported by a commitment to maintaining high standards in marine operations.
The Asia-Pacific region, with a market size of 0.6B, is witnessing rapid growth in Marine Structural Repair Services, driven by increasing shipping activities and a rising number of vessels in operation. Countries like China, Japan, and Australia are investing heavily in their maritime infrastructure, which is essential for supporting the growing demand for repair services. Regulatory frameworks are also evolving to enhance safety and environmental standards, further stimulating market growth. China is emerging as a key player, with significant investments in shipbuilding and repair facilities. The competitive landscape features major companies like Kawasaki Heavy Industries and Austal, which are expanding their service offerings to meet the diverse needs of the maritime sector. As the region continues to develop its capabilities, the demand for high-quality repair services is expected to rise, positioning Asia-Pacific as a vital player in the global market.
The Middle East and Africa region, with a market size of 0.15B, presents untapped opportunities in the Marine Structural Repair Services Market. The growth is driven by increasing maritime trade and investments in port infrastructure, which are essential for enhancing regional shipping capabilities. Regulatory bodies are beginning to implement standards aimed at improving safety and environmental practices, which will further support market development. Countries like the UAE and South Africa are leading the way, with investments in ship repair facilities and services. The competitive landscape is still developing, with local and international players vying for market share. As the region focuses on expanding its maritime industry, the demand for repair services is expected to grow, making it a promising area for future investments and innovations.
The Marine Structural Repair Services Market is characterized by a competitive landscape that is increasingly shaped by technological advancements and strategic partnerships. Key players such as Damen Shipyards Group (NL), Babcock International Group (GB), and Fincantieri (IT) are actively pursuing innovation and regional expansion to enhance their market positions. Damen Shipyards Group (NL) focuses on integrating digital solutions into its repair services, which appears to be a response to the growing demand for efficiency and transparency in operations. Meanwhile, Babcock International Group (GB) emphasizes its commitment to sustainability, aligning its repair services with environmental regulations and customer expectations. Fincantieri (IT) is leveraging its extensive experience in shipbuilding to offer comprehensive repair solutions, thereby reinforcing its competitive edge in the market.The business tactics employed by these companies reflect a nuanced understanding of the market's structure, which is moderately fragmented yet dominated by a few key players. Localizing manufacturing and optimizing supply chains are prevalent strategies that enhance operational efficiency and reduce costs. The collective influence of these major companies fosters a competitive environment where innovation and service quality are paramount, potentially leading to a shift in market dynamics as smaller players strive to keep pace.In November Damen Shipyards Group (NL) announced the launch of a new digital platform aimed at streamlining repair service requests and enhancing customer engagement. This strategic move is likely to position the company as a leader in digital transformation within the sector, potentially attracting a broader client base seeking modernized service solutions. The emphasis on digitalization may also serve to improve operational efficiencies, thereby reducing turnaround times for repairs.In October Babcock International Group (GB) secured a multi-million £ contract to provide repair services for the Royal Navy's fleet. This contract not only underscores Babcock's strong relationship with governmental entities but also highlights its strategic focus on defense-related services, which could provide a stable revenue stream amidst fluctuating market conditions. The alignment with national defense initiatives may enhance Babcock's reputation and reliability in the sector.In September Fincantieri (IT) expanded its repair capabilities by acquiring a specialized repair facility in the Mediterranean region. This acquisition is indicative of Fincantieri's strategy to enhance its geographical footprint and service offerings, potentially allowing for quicker response times and improved service delivery to clients in that area. Such strategic expansions may also facilitate cross-selling opportunities within its existing client base.As of December the competitive trends in the Marine Structural Repair Services Market are increasingly defined by digitalization, sustainability, and the integration of AI technologies. Strategic alliances among key players are shaping the landscape, fostering innovation and collaborative solutions. The shift from price-based competition to a focus on technological advancement and supply chain reliability is becoming evident. Companies that prioritize these aspects are likely to differentiate themselves in a market that is evolving rapidly, suggesting a future where innovation and service quality take precedence over traditional competitive metrics.




The Marine Structural Repair Services Market is projected to grow at a 4.19% CAGR from 2025 to 2035, driven by increasing maritime activities and aging infrastructure.
New opportunities lie in:
By 2035, the market is expected to be robust, driven by innovation and strategic service expansions.
| MARKET SIZE 2024 | 3.5(USD Billion) |
| MARKET SIZE 2025 | 3.65(USD Billion) |
| MARKET SIZE 2035 | 5.5(USD Billion) |
| COMPOUND ANNUAL GROWTH RATE (CAGR) | 4.19% (2025 - 2035) |
| REPORT COVERAGE | Revenue Forecast, Competitive Landscape, Growth Factors, and Trends |
| BASE YEAR | 2024 |
| Market Forecast Period | 2025 - 2035 |
| Historical Data | 2019 - 2024 |
| Market Forecast Units | USD Billion |
| Key Companies Profiled | Damen Shipyards Group (NL), Babcock International Group (GB), Fincantieri (IT), Thyssenkrupp Marine Systems (DE), Huntington Ingalls Industries (US), Naval Group (FR), BAE Systems (GB), Austal (AU), Kawasaki Heavy Industries (JP) |
| Segments Covered | Application, Service Type, Material Type, End Use |
| Key Market Opportunities | Integration of advanced materials and technologies enhances efficiency in the Marine Structural Repair Services Market. |
| Key Market Dynamics | Rising demand for sustainable repair solutions drives innovation and competition in the Marine Structural Repair Services Market. |
| Countries Covered | North America, Europe, APAC, South America, MEA |
The Marine Structural Repair Services Market was valued at 3.5 USD Billion in 2024.
The market is projected to reach 5.5 USD Billion by 2035.
The expected CAGR for the market during the forecast period is 4.19%.
Key players include Damen Shipyards Group, Babcock International Group, Fincantieri, and others.
Main application segments include Shipbuilding, Ship Repair, Offshore Structures, Marine Infrastructure, and Dredging.
The Ship Repair segment is projected to grow from 1.2 USD Billion to 1.8 USD Billion by 2035.
Services include Inspection Services, Maintenance Services, Repair Services, Reconstruction Services, and Consultation Services.
The Repair Services segment is expected to increase from 1.2 USD Billion to 1.8 USD Billion by 2035.
Significant material types include Steel, Aluminum, Composite Materials, Concrete, and Fiberglass.
The Commercial Vessels segment is anticipated to grow from 1.4 USD Billion to 2.1 USD Billion by 2035.



Kindly complete the form below to receive a free sample of this Report

“This is really good guys. Excellent work on a tight deadline. I will continue to use you going forward and recommend you to others. Nice job”


“Thanks. It’s been a pleasure working with you, please use me as reference with any other Intel employees.”


“Thanks for sending the report it gives us a good global view of the Betaïne market.”


“Thank you, this will be very helpful for OQS.”


“We found the report very insightful! we found your research firm very helpful. I'm sending this email to secure our future business.”


“I am very pleased with how market segments have been defined in a relevant way for my purposes (such as "Portable Freezers & refrigerators" and "last-mile"). In general the report is well structured. Thanks very much for your efforts.”


“I have been reading the first document or the study, ,the Global HVAC and FP market report 2021 till 2026. Must say, good info! I have not gone in depth at all parts, but got a good indication of the data inside!”


“We got the report in time, we really thank you for your support in this process. I also thank to all of your team as they did a great job.”


“The Automotive 48V ECU Components Procurement Intelligence Study” was a complex project, but the Market Research Future (MRFR) team handled it with quality, agility, and customer-centricity. They delivered all requested data on time and within the agreed scope. The team, including Shubhendra Anand and Rahul Gotadki, was always readily available to clarify questions and swiftly implement necessary adjustments, driving the project to a successful conclusion within a very demanding timeframe.
I would also like to specifically commend Akshay Agarwal for his responsiveness and support at every stage—from our initial inquiry on May 6th through to final delivery on June 18th. His dedication made the entire process seamless.”



