• Cat-intel
  • MedIntelliX
  • Resources
  • About Us
  • Hero Background
    English
    Chinese
    French
    Japanese
    Korean
    German
    Spanish

    Medical Imaging Displays Market Share

    ID: MRFR/MED/6599-HCR
    90 Pages
    Kinjoll Dey
    October 2025

    Medical Imaging Displays Market Research Report Information by Display Technology (LED, TFT-LCD, CRT, PM-LCD, PMOLED, AMOLED), Panel Size (Less than 22.9 Inch, 23.0-26.9 Inch, 27.0-41.9 Inch and more than 42 Inch), Resolution (Up to 2MP, 2.1–4MP, 4.1–8MP and above 8MP), Application (Diagnostic, General Radiology, Mammography, Digital Pathology, Multi-modality, Surgical/ Interventional, Dentistr...

    Share:
    Download PDF ×

    We do not share your information with anyone. However, we may send you emails based on your report interest from time to time. You may contact us at any time to opt-out.

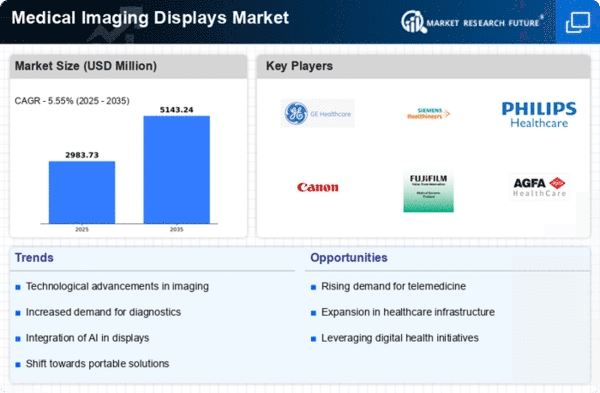
    Medical Imaging Displays Market Infographic
    $ 4,950.0
    $ 5,950.0
    $ 7,250.0

    Market Share

    Medical Imaging Displays Market Share Analysis

    In the realm of the Medical Imaging Displays Market, market share positioning strategies are pivotal for companies striving to carve out their niche and assert their presence. These strategies serve as the blueprint for companies to navigate the competitive landscape, differentiate themselves, and secure a significant slice of the market pie. One predominant tactic in market share positioning revolves around product innovation and differentiation. Companies endeavor to develop cutting-edge medical imaging displays that offer unique features, superior image quality, and enhanced functionality compared to their competitors. By highlighting these advantages, companies can attract healthcare providers and institutions seeking top-tier imaging solutions, thus gaining traction and expanding their market share.

    Price positioning is another key aspect of market share strategies in the Medical Imaging Displays Market. Companies may adopt various pricing strategies to gain a competitive edge and capture market share. Some may opt for a premium pricing strategy, positioning their displays as high-end products synonymous with quality, reliability, and advanced technology. This appeals to customers who prioritize performance and are willing to pay a premium for top-of-the-line imaging solutions. Conversely, other companies may choose a more aggressive pricing approach, offering their displays at a lower price point to penetrate new market segments or attract cost-conscious buyers. By strategically adjusting pricing strategies, companies can effectively position themselves within the market and capture a broader customer base.

    Distribution channels play a crucial role in market share positioning strategies within the Medical Imaging Displays Market. Companies must ensure their products are readily available and accessible to healthcare facilities, imaging centers, and practitioners. This involves establishing strong partnerships with distributors, resellers, and healthcare networks to ensure widespread coverage and reach. Additionally, companies may leverage online sales channels and e-commerce platforms to expand their market reach and cater to customers' evolving purchasing preferences. By optimizing distribution channels, companies can enhance their visibility, streamline product availability, and effectively compete for market share.

    Marketing and branding strategies are also instrumental in market share positioning within the Medical Imaging Displays Market. Companies need to develop compelling marketing campaigns that highlight the unique features, benefits, and value propositions of their displays. This may involve targeted advertising, participation in industry conferences and events, and collaborations with key opinion leaders and influencers within the healthcare community. Building a strong brand presence and reputation can instill confidence in customers and differentiate companies from their competitors, ultimately driving market share growth.

    Furthermore, strategic partnerships and collaborations can significantly impact market share positioning in the Medical Imaging Displays Market. Companies may forge alliances with healthcare institutions, imaging equipment manufacturers, and software developers to create integrated solutions that offer enhanced functionality and seamless interoperability. By leveraging complementary strengths and resources, companies can deliver comprehensive imaging solutions that meet the diverse needs of healthcare providers and gain a competitive edge in the market. Strategic partnerships also facilitate access to new markets, distribution channels, and customer segments, enabling companies to expand their market share and solidify their position as industry leaders.

    Market Summary

    As per Market Research Future Analysis, the global medical imaging displays market is projected to reach USD 3.7 Billion by 2032, growing at a CAGR of 5.3% from 2025 to 2032. The market is driven by the increasing demand for minimally invasive procedures, the popularity of large displays, and advancements in diagnostic imaging technologies. The COVID-19 pandemic initially hindered growth, but recovery is anticipated as healthcare demands rise. Key regions include North America, which is expected to dominate the market, followed by Europe and Asia-Pacific, the latter being the fastest-growing region due to rising healthcare investments and technology adoption.

    Key Market Trends & Highlights

    The medical imaging displays market is influenced by several key trends and factors.

    • Market value expected to reach USD 3.7 Billion by 2032.
    • CAGR of 5.3% during the forecast period 2025-2032.
    • Increasing demand for diagnostic imaging procedures such as CT scans and MRIs.
    • Growing number of diagnostic and imaging facilities creating opportunities.

    Market Size & Forecast

    Market Size USD 1.98 Billion in 2018
    Forecast Market Size USD 3.7 Billion by 2032
    CAGR 5.3% from 2025 to 2032.

    Major Players

    Key players include Carestream Health, Koninklijke Philips N.V., Siemens Healthcare, Barco, General Electric Company, and Canon Medical Systems Corporation.

    Market Trends

    Drivers 

    A few factors may drive the growth of thehealthcare imaging displays market. The rising demand for minimally invasive procedures, the growing popularity of large displays and their benefits, the increasing demand for diagnostic imaging procedures such as CT scans, MRIs, and other methods, as well as rapid technological advancements in the imaging sector, are some driving factors in themedical imaging displays market forecast.

    Opportunities 

    The growing number of diagnostic and imaging facilities creates several opportunities, which will boost the medical display market throughout the forecast period. The market players are adopting various trends such as acquisitions and product launches, which are expected to boost the medical imaging displays market growth.

    Restraints 

    Some factors that may inhibit the growth of medical imaging displays market value, such as the cost of the equipment. The rising demand for refurbished medical displays and the high cost of medical imaging displays are expected to hinder the market's growth.

    Challenges 

    Some factors that may challenge the key medical imaging displays providers include the cost of the equipment. Moreover, there is a lack of healthcare infrastructure in many places. The population may also not be aware of the need for medical imaging equipment in healthcare. Hence, these factors challenge the key players of the global market.

    Cumulative Growth Analysis

    The medical imaging displays market is anticipated to grow substantially in the years to come. The healthcare imaging displays market value is expected to grow at a CAGR (Compound Annual Growth Rate) of about 5.4%. The market value was evaluated at approximately USD 1.98 billion by the end of the year 2018.

    Value Chain Analysis

    The increasing adoption of minimally invasive procedures, the growing popularity of large displays and their perks, the rising demand for diagnostic imaging procedures such as CT scans, MRIs, and other imaging procedures, and rapid technological advancements in the imaging sector are all driving the market. However, in the projection period, downward pricing pressure because of its commodity nature and a rise in the number of refurbished medical display adoptions are limiting the medical imaging displays market growth.

    Medical Imaging Displays Market Segmentation

    The globalmedical imaging displays marketis classified into many segments such as display technology, resolution, panel size, display color, and application. Listed below are the healthcare imaging displays market segments:

    Medical Imaging Displays Technology Outlook

    LED AMOLED PMOLED CRT TFT-LCD PM-LCD

    Medical Imaging Displays Resolution Outlook

    2MP 1–4MP 1–8MP Above 8MP

    Medical Imaging Displays Panel Size Outlook

    9 Inch 0-26.9 Inch 0-41.9 Inch More than 42 Inch

    Medical Imaging Displays Display Color Outlook

    Monochrome display Color display

    Medical Imaging Displays Application Outlook

    Diagnostic Dentistry General radiology Surgical/interventional Digital pathology Mammography Multi-modality Others

    Medical Imaging Displays Market Regional Analysis

    The regional division of the medical imaging displays market analysis comprises North America, Europe, Asia Pacific, and the rest of the world. Because of technical advancements, rising healthcare expenditure, the availability of venture capital and government support, and the rising frequency of chronic illnesses in the area, the Americas are estimated to dominate the medical imaging displays market.

    Due to the well-developed healthcare industry, significant government funding for research and development, and high healthcare spending in European nations, Europe is likely to occupy the second biggest market for medical imaging displays. The expansion of the market has also been aided by well-developed technology in the region.

    Due to the increased usage of digital imaging systems, higher disposable income increased awareness programs and symposia, and growing venture capital investments, Asia-Pacific is expected to be the fastest expanding region in the medical imaging displays market. The Middle East and Africa region have the smallest market share for medical imaging displays. Also, due to increased government initiatives in the healthcare sector, the Middle East is likely to have the largest market share in the region.

    Medical Imaging Displays Competitive Landscape

    The medical imaging displays industry is dominated by a few companies that play a vital role in the market growth. These healthcare imaging displays companies are called key companies of the market. They contribute to the largest share of the market profit.

    The companies account for the market profits by adopting various medical imaging displays market trends such as joint ventures, product launches, company expansions, and procurements.

    Medical Imaging Displays Key Players

    Below are the key companies that offer medical imaging displays in the global market:

    Carestream Health Koninklijke Philips N.V. Siemens Healthcare Private Limited Barco NDS Surgical Imaging LLC Ampronix General Electric Company Canon Medical Systems Corporation Hitachi Medical Systems Europe Holding AG PHC Holdings Corporation The Contec Group EIZO Corporation Others

    Recent Developments 

    Novarad introduced its OpenSight AR system, an imaging display based on Augmented Reality. It has also been authorized by the US Food and Drug Administration (FDA). Patients are exposed to less radiation as a result of this, and surgeons have superior planning skills. Siemens Healthineers introduced their organ digital twin technology, which Artificial Intelligence powers. It helps stimulate the organ's physiology and assist clinicians in selecting the best potential therapy based on virtual testing on the digital twin. The "ProFound AI" solution from iCAD is a digital breast tomosynthesis solution (DBT). It allows radiologists to see each tissue layer more clearly, allowing them to spot cancer up to 8% earlier on average. This can save radiologists up to 50% of the time they spend reading breast imaging. Google's DeepMind can analyze 3D retinal OCT images and accurately identify 50 distinct ophthalmic diseases. It can identify signs of eye illness. It ranks patients according to their urgency and makes therapy recommendations. These skills have the potential to reduce the time between scan and therapy. This enables patients to receive life-saving treatments promptly.

    Report Overview

    Geographically

    Europe Asia-Pacific North America Middle East & Africa Rest of the world

    The ongoing advancements in imaging technologies and the increasing demand for high-resolution displays in healthcare settings appear to be driving a transformative shift in the global medical imaging displays market.

    U.S. Food and Drug Administration (FDA)

    Medical Imaging Displays Market Market Drivers

    Aging Population

    An aging global population is a crucial factor influencing the Global Medical Imaging Displays Market Industry. Older individuals typically require more medical attention, leading to increased imaging procedures. As the demographic shift continues, healthcare facilities are compelled to upgrade their imaging technologies to cater to this growing patient base. This demographic trend is expected to drive the market significantly, contributing to a compound annual growth rate of 5.34% from 2025 to 2035, as healthcare systems adapt to the needs of an older population.

    Technological Advancements

    The Global Medical Imaging Displays Market Industry is experiencing rapid technological advancements, particularly in display resolution and image processing capabilities. Innovations such as 4K and 8K resolution displays enhance diagnostic accuracy by providing clearer images. For instance, hospitals adopting these advanced displays report improved detection rates of subtle pathologies. As technology evolves, the market is projected to grow from 3.5 USD Billion in 2024 to 6.2 USD Billion by 2035, indicating a robust demand for high-quality imaging solutions.

    Regulatory Support and Standards

    Regulatory support and the establishment of standards for medical imaging technologies are vital drivers for the Global Medical Imaging Displays Market Industry. Governments and health organizations are implementing guidelines that promote the use of high-quality imaging displays in clinical settings. Compliance with these regulations not only enhances patient safety but also encourages manufacturers to innovate. This regulatory landscape is likely to foster market growth, as adherence to standards becomes increasingly critical in the healthcare sector.

    Increasing Healthcare Expenditure

    Rising healthcare expenditure globally is a significant driver for the Global Medical Imaging Displays Market Industry. Governments and private sectors are investing heavily in healthcare infrastructure, leading to the procurement of advanced imaging systems. For example, countries with increasing healthcare budgets are prioritizing the acquisition of state-of-the-art imaging displays. This trend is expected to contribute to a compound annual growth rate of 5.34% from 2025 to 2035, reflecting a sustained commitment to enhancing diagnostic capabilities.

    Growing Demand for Early Diagnosis

    The growing emphasis on early diagnosis in healthcare is propelling the Global Medical Imaging Displays Market Industry forward. Early detection of diseases such as cancer and cardiovascular conditions relies heavily on high-quality imaging. As healthcare providers recognize the importance of timely interventions, the demand for advanced imaging displays is likely to surge. This trend aligns with the projected market growth from 3.5 USD Billion in 2024 to 6.2 USD Billion by 2035, underscoring the critical role of imaging technology in modern medicine.

    Market Segment Insights

    Regional Insights

    Key Companies in the Medical Imaging Displays Market market include

    Industry Developments

    Future Outlook

    Medical Imaging Displays Market Future Outlook

    The Medical Imaging Displays Market is projected to grow at a 5.34% CAGR from 2024 to 2035, driven by technological advancements, increasing healthcare expenditure, and rising demand for diagnostic imaging.

    New opportunities lie in:

    • Develop AI-integrated imaging displays to enhance diagnostic accuracy and workflow efficiency.
    • Expand product lines to include portable imaging displays for remote healthcare services.
    • Invest in sustainable manufacturing practices to meet growing environmental regulations and consumer preferences.

    By 2035, the Medical Imaging Displays Market is expected to achieve substantial growth, reflecting advancements in technology and healthcare demands.

    Market Segmentation

    Medical Imaging Displays Panel Size Outlook

    • 9 Inch
    • 0-26.9 Inch
    • 0-41.9 Inch
    • More than 42 Inch

    Medical Imaging Displays Resolution Outlook

    • 2MP
    • 1–4MP
    • 1–8MP
    • Above 8MP

    Medical Imaging Displays Technology Outlook

    • LED
    • AMOLED
    • PMOLED
    • CRT
    • TFT-LCD
    • PM-LCD

    Medical Imaging Displays Application Outlook

    • Diagnostic
    • Dentistry
    • General radiology
    • Surgical/interventional
    • Digital pathology
    • Mammography
    • Multi-modality
    • Others
    • Carestream Health
    • Koninklijke Philips N.V.
    • Siemens Healthcare Private Limited
    • Barco
    • NDS Surgical Imaging LLC
    • Ampronix
    • General Electric Company
    • Canon Medical Systems Corporation
    • Hitachi Medical Systems Europe Holding AG
    • PHC Holdings Corporation
    • The Contec Group
    • EIZO Corporation
    • Novarad introduced its OpenSight AR system, an imaging display based on Augmented Reality. It has also been authorized by the US Food and Drug Administration (FDA). Patients are exposed to less radiation as a result of this, and surgeons have superior planning skills.
    • Siemens Healthineers introduced their organ digital twin technology, which Artificial Intelligence powers. It helps stimulate the organ's physiology and assist clinicians in selecting the best potential therapy based on virtual testing on the digital twin.
    • The "ProFound AI" solution from iCAD is a digital breast tomosynthesis solution (DBT). It allows radiologists to see each tissue layer more clearly, allowing them to spot cancer up to 8% earlier on average. This can save radiologists up to 50% of the time they spend reading breast imaging.
    • Google's DeepMind can analyze 3D retinal OCT images and accurately identify 50 distinct ophthalmic diseases. It can identify signs of eye illness. It ranks patients according to their urgency and makes therapy recommendations. These skills have the potential to reduce the time between scan and therapy. This enables patients to receive life-saving treatments promptly.
    • Europe
    • Asia-Pacific
    • North America
    • Middle East & Africa
    • Rest of the world

    Medical Imaging Displays Display Color Outlook

    • Monochrome display
    • Color display

    Report Scope

    Report Attribute/Metric Details
      Market Size   2032: USD 3.7 Billion
      CAGR   5.3% (2023-2032)
      Base Year   2022
      Forecast Period   2023-2032
      Historical Data   2021
      Forecast Units   Value (USD Billion)
      Report Coverage   Revenue Forecast, Competitive Landscape, Growth Factors, and Trends
      Segments Covered   By Display technology, By Resolution, By Panel Size, By Display color and By Application
      Geographies Covered   North America, Europe, Asia-Pacific, and Rest of the World (RoW)
      Key Vendors   Carestream Health, Koninklijke Philips N.V., Siemens Healthcare Private Limited, Barco, NDS Surgical Imaging LLC, Ampronix, General Electric Company, Canon Medical Systems Corporation, Hitachi Medical Systems Europe Holding AG, PHC Holdings Corporation, The Contec Group, EIZO Corporation
      Key Market Opportunities ·  The growing number of diagnostic and imaging facilities ·  Acquisitions and product launches
      Key Market Drivers   The rising demand for minimally invasive procedures, the growing popularity of large displays and their benefits, the increasing demand for diagnostic imaging procedures such as CT scans, MRIs, and other methods, as well as rapid technological advancements.

    Market Highlights

    Author

    Kinjoll Dey
    Research Analyst Level I

    She holds an experience of about 6+ years in market research and business consulting, working under the spectrum of information communication technology, telecommunications and semiconductor domains. aarti conceptualizes and implements a scalable business strategy and provides strategic leadership to the clients. her expertise lies in market estimation, competitive intelligence, pipeline analysis, customer assessment, etc.

    Leave a Comment

    Latest Comments

    John Doe
    john@example.com

    This is a great article! Really helped me understand the topic better.

    Posted on July 23, 2025, 10:15 AM
    Jane Smith
    jane@domain.com

    Thanks for sharing this. I’ve bookmarked it for later reference.

    Posted on July 22, 2025, 7:45 PM

    FAQs

    What is the valuation of the Medical Imaging Displays Market?

    Medical Imaging Displays Marketwas valued at USD 3.7 billion in 2032.

    What is the Medical Imaging Displays Marketgrowth rate?

    Medical Imaging Displays Market is expected to exhibit a strong 5.3% CAGR over the forecast period from 2023 to 2032.

    What is the leading driver for the Medical Imaging Displays Market?

    Medical Imaging Displays Market is mainly driven by the growing demand for minimally invasive medical imaging.

    What is the key restraint on the Medical Imaging Displays Market?

    The high cost of advanced medical imaging display systems is the major restraint on the global market.

    What is the leading regional Medical Imaging Displays Market?

    The Americas and Europe hold the dominant shares in the global medical imaging displays market.

    1. Market Introduction
      1. Definition
      2. Scope of the Study
        1. Assumptions
        2. Limitations
      3. 2.2.1
      4. Research Objective
      5. Chapter 3.
      6. Research Methodology
      7. Introduction
      8. Primary Research
      9. Secondary
      10. Research
      11. Market Size Estimation
      12. Chapter 4. Market Dynamics
      13. 4.1
      14. Drivers
      15. Restraints
      16. Opportunities
      17. Chapter 5. Market Factor
      18. Analysis
      19. Porter’s Five Forces Analysis
        1. Bargaining Power
        2. Bargaining Power of Buyers
        3. Threat of New Entrants
        4. Threat of Substitutes
        5. Intensity of Rivalry
      20. of Suppliers
      21. Value Chain
      22. Analysis
    2. Chapter 6. Global Medical Imaging Displays Market, by Display Technology
      1. Introduction
      2. LED
    3. Market Estimates & Forecast, by Region,
    4. Market Estimates & Forecast, by Country, 2023-2032
      1. TFT-LCD
    5. Market Estimates & Forecast, by Region, 2023-2032
      1. Market Estimates &
      2. Forecast, by Country, 2023-2032
      3. CRT
      4. Market Estimates & Forecast,
      5. by Region, 2023-2032
    6. Market Estimates & Forecast, by Country, 2023-2032
      1. PM-LCD
    7. Market Estimates & Forecast, by Region, 2023-2032
      1. Market
      2. Estimates & Forecast, by Country, 2023-2032
      3. PMOLED
      4. Market Estimates
      5. & Forecast, by Region, 2023-2032
    8. Market Estimates & Forecast, by Country,
      1. AMOLED
    9. Market Estimates & Forecast, by Region, 2023-2032
    10. Market Estimates & Forecast, by Country, 2023-2032
      1. Chapter 7. Global
    11. Medical Imaging Displays Market, by Panel Size
      1. Introduction
      2. Less
      3. than 22.9 Inch
    12. Market Estimates & Forecast, by Region, 2023-2032
      1. Market
      2. Estimates & Forecast, by Country, 2023-2032
      3. 23.0-26.9 Inch
      4. Market
      5. Estimates & Forecast, by Region, 2023-2032
      6. Market Estimates & Forecast,
      7. by Country, 2023-2032
      8. 27.0-41.9 Inch
      9. Market Estimates & Forecast,
      10. by Region, 2023-2032
    13. Market Estimates & Forecast, by Country, 2023-2032
      1. More than 42 Inch
    14. Market Estimates & Forecast, by Region, 2023-2032
    15. Market Estimates & Forecast, by Country, 2023-2032
      1. Chapter 8. Global
    16. Medical Imaging Displays Market, by Resolution
      1. Introduction
      2. Up
      3. to 2MP
    17. Market Estimates & Forecast, by Region, 2023-2032
      1. Market Estimates
      2. & Forecast, by Country, 2023-2032
      3. 2.1–4MP
      4. Market Estimates
      5. & Forecast, by Region, 2023-2032
    18. Market Estimates & Forecast, by Country,
      1. 4.1–8MP
    19. Market Estimates & Forecast, by Region,
    20. Market Estimates & Forecast, by Country, 2023-2032
      1. Above
      2. 8MP
    21. Market Estimates & Forecast, by Region, 2023-2032
      1. Market Estimates
      2. & Forecast, by Country, 2023-2032
      3. Chapter 9. Global Medical Imaging Displays
    22. Market, by Application
      1. Introduction
      2. Diagnostic
      3. Market Estimates
      4. & Forecast, by Region, 2023-2032
    23. Market Estimates & Forecast, by Country,
      1. General Radiology
    24. Market Estimates & Forecast, by Region,
    25. Market Estimates & Forecast, by Country, 2023-2032
      1. Mammography
    26. Market Estimates & Forecast, by Region, 2023-2032
      1. Market Estimates &
      2. Forecast, by Country, 2023-2032
      3. Digital Pathology
      4. Market Estimates
      5. & Forecast, by Region, 2023-2032
    27. Market Estimates & Forecast, by Country,
      1. Multi-modality
    28. Market Estimates & Forecast, by Region,
    29. Market Estimates & Forecast, by Country, 2023-2032
      1. Surgical/
      2. Interventional
    30. Market Estimates & Forecast, by Region, 2023-2032
      1. Market
      2. Estimates & Forecast, by Country, 2023-2032
      3. Dentistry
      4. Market Estimates
      5. & Forecast, by Region, 2023-2032
    31. Market Estimates & Forecast, by Country,
      1. Others
    32. Market Estimates & Forecast, by Region, 2023-2032
    33. Market Estimates & Forecast, by Country, 2023-2032
      1. Chapter 10. Global
    34. Medical Imaging Displays Market, by Display Color
      1. Introduction
      2. 10.2
      3. Color Display
    35. Market Estimates & Forecast, by Region, 2023-2032
      1. Market
      2. Estimates & Forecast, by Country, 2023-2032
      3. Monochrome Display
    36. Market Estimates & Forecast, by Region, 2023-2032
      1. Market Estimates &
      2. Forecast, by Country, 2023-2032
      3. Chapter 11. Global Medical Imaging Displays
    37. Market, by Region
      1. Introduction
      2. Americas
        1. North America
        2. US
        3. Canada
        4. Latin America
      3. Europe
      4. 11.3.1
      5. Western Europe
      6. 11.3.2
      7. Eastern Europe
      8. 11.4.3
      9. India
      10. Chapter
    38. Germany
    39. France
    40. Italy
    41. Spain
    42. UK
    43. Rest of Western Europe
      1. Asia-Pacific
        1. Japan
        2. China
        3. Australia
        4. South Korea
        5. Rest of Asia-Pacific
      2. Middle East & Africa
        1. Middle East
        2. Africa
    44. Company Landscape
      1. Introduction
      2. Market Share Analysis
      3. Key Development & Strategies
        1. Company Overview
        2. Display Technology
        3. Financials Overview
        4. Key Developments
      4. Chapter 13. Company Profiles
      5. 13.1
      6. General Electric Company
      7. Overview
      8. 13.1.5
      9. SWOT Analysis
      10. Carestream Health
        1. Company Overview
        2. Financial Overview
        3. Key Developments
        4. SWOT Analysis
      11. 13.2.2
      12. Display Technology Overview
      13. Canon Medical Systems Corporation
        1. Company
        2. Display Technology Overview
        3. Financial Overview
        4. Key Development
        5. SWOT Analysis
      14. Overview
      15. Koninklijke Philips
        1. Company Overview
        2. Display Technology Overview
        3. Key Development
        4. SWOT Analysis
        5. Company Overview
        6. Financial overview
        7. Key Developments
        8. SWOT Analysis
      16. N.V.
      17. 13.4.3
      18. Financial Overview
      19. 13.5
      20. Hitachi Medical Systems Europe Holding AG
      21. 13.5.2
      22. Display Technology Overview
      23. Siemens Healthcare Private Limited
        1. Display Technology Overview
        2. Financial Overview
        3. Key Developments
        4. SWOT Analysis
      24. 13.6.1
      25. Company Overview
      26. PHC Holdings Corporation
        1. Overview
        2. Display Technology Overview
        3. Financial
        4. Key Developments
        5. SWOT Analysis
      27. Overview
      28. Barco
        1. Overview
        2. Display Technology Overview
        3. Financials
        4. Key Developments
        5. SWOT Analysis
      29. The Contec Group
        1. Overview
        2. Display Technology Overview
        3. Financials
        4. Key Developments
        5. SWOT Analysis
      30. NDS Surgical Imaging,
        1. Overview
        2. Display Technology Overview
        3. Key Developments
        4. SWOT Analysis
      31. LLC
      32. 13.10.3
      33. Financials
      34. EIZO
        1. Overview
        2. Display Technology Overview
        3. Key Developments
        4. SWOT Analysis
      35. Corporation
      36. 13.11.3
      37. Financials
      38. Ampronix
        1. Overview
        2. Display Technology Overview
        3. Financials
        4. Key Developments
        5. SWOT Analysis
      39. Others
      40. Chapter
    45. MRFR Conclusion
      1. Key Findings
        1. From CEO’s Viewpoint
        2. Unmet Needs of the Market
      2. Key Companies to Watch
      3. Predictions
      4. for the Medical Imaging Displays Industry
      5. Chapter 15. Appendix
    46. LIST OF TABLES
    47. Global Medical Imaging Displays Market Synopsis, 2023-2032
    48. Global Medical Imaging Displays Market Estimates and Forecast, 2023-2032(USD
      1. Million)
    49. Global Medical Imaging Displays Market, by Region, 2023-2032(USD
      1. Million)
    50. Global Medical Imaging Displays Market, by Display Technology,
    51. Global Medical Imaging Displays Market, by Panel
      1. Size, 2023-2032(USD Million)
    52. Global Medical Imaging Displays Market,
      1. by Resolution, 2023-2032(USD Million)
    53. Global Medical Imaging Displays
    54. Market, by Application, 2023-2032(USD Million)
    55. Global Medical Imaging
    56. Displays Market, by Display Color, 2023-2032(USD Million)
    57. North America:
    58. Medical Imaging Displays Market, by Display Technology, 2023-2032(USD Million)
    59. North America: Medical Imaging Displays Market, by Panel Size, 2023-2032(USD
      1. Million)
    60. North America: Medical Imaging Displays Market, by Resolution,
    61. North America: Medical Imaging Displays Market,
      1. by Application, 2023-2032(USD Million)
    62. North America: Medical Imaging
    63. Displays Market, by Display Color, 2023-2032(USD Million)
    64. US: Medical
    65. Imaging Displays Market, by Display Technology, 2023-2032(USD Million)
      1. Table
    66. US: Medical Imaging Displays Market, by Panel Size, 2023-2032(USD Million)
    67. US: Medical Imaging Displays Market, by Resolution, 2023-2032(USD Million)
    68. US: Medical Imaging Displays Market, by Application, 2023-2032(USD Million)
    69. US: Medical Imaging Displays Market, by Display Color, 2023-2032(USD
      1. Million)
    70. Canada: Medical Imaging Displays Market, by Display Technology,
    71. Canada: Medical Imaging Displays Market, by
      1. Panel Size, 2023-2032(USD Million)
    72. Canada: Medical Imaging Displays
    73. Market, by Resolution, 2023-2032(USD Million)
    74. Canada: Medical Imaging
    75. Displays Market, by Application, 2023-2032(USD Million)
    76. Canada: Medical
    77. Imaging Displays Market, by Display Color, 2023-2032(USD Million)
      1. Table 24
    78. South America: Medical Imaging Displays Market, by Display Technology, 2023-2032(USD
      1. Million)
    79. South America: Medical Imaging Displays Market, by Panel
      1. Size, 2023-2032(USD Million)
    80. South America: Medical Imaging Displays
    81. Market, by Resolution, 2023-2032(USD Million)
    82. South America: Medical
    83. Imaging Displays Market, by Application, 2023-2032(USD Million)
    84. South
    85. America: Medical Imaging Displays Market, by Display Color, 2023-2032(USD Million)
    86. Europe: Medical Imaging Displays Market, by Display Technology, 2023-2032(USD
      1. Million)
    87. Europe: Medical Imaging Displays Market, by Panel Size, 2023-2032(USD
      1. Million)
    88. Europe: Medical Imaging Displays Market, by Resolution, 2023-2032(USD
      1. Million)
    89. Europe: Medical Imaging Displays Market, by Application,
    90. Europe: Medical Imaging Displays Market, by
      1. Display Color, 2023-2032(USD Million)
    91. Western Europe: Medical Imaging
    92. Displays Market, by Display Technology, 2023-2032(USD Million)
    93. Western
    94. Europe: Medical Imaging Displays Market, by Panel Size, 2023-2032(USD Million)
    95. Western Europe: Medical Imaging Displays Market, by Resolution, 2023-2032(USD
      1. Million)
    96. Western Europe: Medical Imaging Displays Market, by Application,
    97. Western Europe: Medical Imaging Displays Market,
      1. by Display Color, 2023-2032(USD Million)
    98. Eastern Europe: Medical Imaging
    99. Displays Market, by Display Technology, 2023-2032(USD Million)
    100. Eastern
    101. Europe: Medical Imaging Displays Market, by Panel Size, 2023-2032(USD Million)
    102. Eastern Europe: Medical Imaging Displays Market, by Resolution, 2023-2032(USD
      1. Million)
    103. Eastern Europe: Medical Imaging Displays Market, by Application,
    104. Eastern Europe: Medical Imaging Displays Market,
      1. by Display Color, 2023-2032(USD Million)
    105. Asia-Pacific: Medical Imaging
    106. Displays Market, by Display Technology, 2023-2032(USD Million)
    107. Asia-Pacific:
    108. Medical Imaging Displays Market, by Panel Size, 2023-2032(USD Million)
      1. Table
    109. Asia-Pacific: Medical Imaging Displays Market, by Resolution, 2023-2032(USD Million)
    110. Asia-Pacific: Medical Imaging Displays Market, by Application, 2023-2032(USD
      1. Million)
    111. Asia-Pacific: Medical Imaging Displays Market, by Display
      1. Color, 2023-2032(USD Million)
    112. Middle East & Africa: Medical Imaging
    113. Displays Market, by Display Technology, 2023-2032(USD Million)
    114. Middle
    115. East & Africa: Medical Imaging Displays Market, by Panel Size, 2023-2032(USD
      1. Million)
    116. Middle East & Africa: Medical Imaging Displays Market,
      1. by Resolution, 2023-2032(USD Million)
    117. Middle East & Africa: Medical
    118. Imaging Displays Market, by Application, 2023-2032(USD Million)
    119. Middle
    120. East & Africa: Medical Imaging Displays Market, by Display Color, 2023-2032(USD
      1. Million)
    121. LIST OF FIGURES
    122. Research Process
      1. Figure 2
      2. Market Structure for Global Medical Imaging Displays Market
    123. Market
      1. Dynamics for Global Medical Imaging Displays Market
    124. Global Medical
    125. Imaging Displays Market Share, by Display Technology, 2023
    126. Global
    127. Medical Imaging Displays Market Share, by Panel Size, 2023
    128. Global
    129. Medical Imaging Displays Market Share, by Resolution, 2023
    130. Global
    131. Medical Imaging Displays Market Share, by Application, 2023
    132. Global
    133. Medical Imaging Displays Market Share, by Display Color, 2023
    134. Global
    135. Medical Imaging Displays Market Share, by Region, 2023
    136. North America:
    137. Medical Imaging Displays Market Share, by Country, 2023
    138. Europe: Medical
    139. Imaging Displays Market Share, by Country, 2023
    140. Asia-Pacific: Medical
    141. Imaging Displays Market Share, by Country, 2023
    142. Middle East &
    143. Africa: Medical Imaging Displays Market Share, by Country, 2023
    144. Global
      1. Medical Imaging Displays Market: Company Share Analysis, 2023 (%)
      2. Figure 15
      3. General Electric Company: Key Financials
    145. General Electric Company:
      1. Segmental Revenue
    146. General Electric Company: Geographical Revenue
    147. Carestream Health: Key Financials
    148. Carestream Health:
      1. Segmental Revenue
    149. Carestream Health: Geographical Revenue
      1. Figure
    150. Canon Medical Systems Corporation: Key Financials
    151. Canon Medical
      1. Systems Corporation: Segmental Revenue
    152. Canon Medical Systems Corporation:
      1. Geographical Revenue
    153. Koninklijke Philips N.V.: Key Financials
    154. Koninklijke Philips N.V.: Segmental Revenue
    155. Koninklijke
      1. Philips N.V.: Geographical Revenue
    156. Hitachi Medical Systems Europe
      1. Holding AG: Key Financials
    157. Hitachi Medical Systems Europe Holding
      1. AG: Segmental Revenue
    158. Hitachi Medical Systems Europe Holding AG:
      1. Geographical Revenue
    159. Siemens Healthcare Private Limited: Key Financials
    160. Siemens Healthcare Private Limited: Segmental Revenue
      1. Figure 32
      2. Siemens Healthcare Private Limited: Geographical Revenue
    161. PHC Holdings
      1. Corporation: Key Financials
    162. PHC Holdings Corporation: Segmental Revenue
    163. PHC Holdings Corporation: Geographical Revenue
    164. Barco:
      1. Key Financials
    165. Barco: Segmental Revenue
    166. Barco: Geographical
      1. Revenue
    167. The Contec Group: Key Financials
    168. The Contec
      1. Group: Segmental Revenue
    169. The Contec Group: Geographical Revenue
    170. NDS Surgical Imaging, LLC: Key Financials
    171. NDS Surgical
      1. Imaging, LLC: Segmental Revenue
    172. NDS Surgical Imaging, LLC: Geographical
      1. Revenue
    173. EIZO Corporation: Key Financials
    174. EIZO Corporation:
      1. Segmental Revenue
    175. EIZO Corporation: Geographical Revenue
      1. Figure
    176. Ampronix: Key Financials
    177. Ampronix: Segmental Revenue
      1. Figure
    178. Ampronix: Geographical Revenue

    Medical Imaging Displays Market Segmentation

    Market Segmentation Overview

    • Detailed segmentation data will be available in the full report
    • Comprehensive analysis by multiple parameters
    • Regional and country-level breakdowns
    • Market size forecasts by segment
    Infographic

    Free Sample Request

    Kindly complete the form below to receive a free sample of this Report

    Get Free Sample

    Customer Strories

    “I am very pleased with how market segments have been defined in a relevant way for my purposes (such as "Portable Freezers & refrigerators" and "last-mile"). In general the report is well structured. Thanks very much for your efforts.”

    Victoria Milne

    Founder
    Case Study
    Chemicals and Materials