×
Hero Background
English
Chinese
French
Japanese
Korean
German
Spanish

Methane Market Share

ID: MRFR/CnM/5904-HCR
140 Pages
Priya Nagrale
October 2025

Methane Market Research Report Information By Source (Natural and Synthetic), By Application (Fuel, Natural Gas, Liquefied Natural Gas, Liquid-Methane Rocket Fuel, and Chemical Feedstock), By End Use Industry (Automotive and Aerospace & Defense), and By Region (North America, Europe, Asia-Pacific, and Rest Of The World) – Market Forecast Till 2035

Share:
Download PDF ×

We do not share your information with anyone. However, we may send you emails based on your report interest from time to time. You may contact us at any time to opt-out.

Methane Market Infographic
Purchase Options

Market Share

Methane Market Share Analysis

In the rapidly evolving Methane Market, companies implement a variety of market share positioning strategies to establish a strong presence and gain a competitive edge. One fundamental strategy involves differentiation, where companies focus on producing high-quality methane with unique features, such as purity levels, extraction methods, or applications in industries like energy production, petrochemicals, and transportation. By investing in research and development, companies can create innovative methane solutions that cater to the diverse needs of customers, setting themselves apart from competitors and securing a significant market share. Differentiation not only attracts customers seeking specific qualities in methane but also enhances the overall perceived value of the gas in the market.

Cost leadership is another pivotal strategy employed by companies in the Methane Market. This approach revolves around becoming a low-cost producer through optimized extraction processes, efficient distribution networks, and strategic partnerships. Emphasizing cost efficiency enables companies to offer competitive pricing for their methane, making them attractive to cost-conscious customers and gaining a larger market share. Successful execution of this strategy demands continuous improvement, innovative production methods, and a keen focus on operational excellence to maintain profitability while providing cost-competitive products.

Strategic alliances and partnerships play a crucial role in shaping the market share positioning of companies in the Methane Market. Collaborating with key stakeholders such as natural gas producers, energy companies, or technology providers allows firms to access essential resources, cutting-edge technologies, and distribution channels. Through strategic partnerships, companies can expand their market reach, leverage shared expertise, and create synergies that enhance their overall competitive position. This collaborative approach fosters innovation, accelerates market penetration, and contributes to a more robust market presence.

Geographical expansion is a strategic imperative for companies aiming to increase their market share in the Methane Market. Identifying and entering new markets or expanding existing operations globally allows companies to tap into regions with growing demand for natural gas and methane. Adapting products to suit the unique requirements of different markets is crucial for success in geographical expansion. This strategy enables companies to diversify their customer base, reduce dependency on specific regions, and strengthen their market share on a global scale.

Furthermore, a customer-centric approach is indispensable for gaining and maintaining market share in the Methane Market. Understanding customer preferences, providing efficient supply chains, and offering excellent customer service contribute to building strong relationships. Companies that prioritize customer satisfaction often benefit from increased loyalty, positive word-of-mouth marketing, and repeat business, ultimately solidifying their market share. As industries increasingly prioritize cleaner energy sources, aligning methane products with customer expectations becomes crucial for sustained success in the Methane Market.

Methane gas is extensively utilized in the manufacturing and processing of fuel and generating electricity. The demand for electricity supply has increased double folds in both urban as well as rural areas. This is driving the Global Methane Market. The rise in demand for various transportation facilities and their use as a raw material in the chemical industry is also pushing its market growth.

Author
Priya Nagrale
Senior Research Analyst

With an experience of over five years in market research industry (Chemicals & Materials domain), I gather and analyze market data from diverse sources to produce results, which are then presented back to a client. Also, provide recommendations based on the findings. As a Senior Research Analyst, I perform quality checks (QC) for market estimations, QC for reports, and handle queries and work extensively on client customizations. Also, handle the responsibilities of client proposals, report planning, report finalization, and execution

Leave a Comment

FAQs

What is the current valuation of the Methane Market as of 2024?

The Methane Market was valued at 101.22 USD Billion in 2024.

What is the projected market valuation for the Methane Market in 2035?

The Methane Market is projected to reach a valuation of 179.05 USD Billion by 2035.

What is the expected CAGR for the Methane Market during the forecast period 2025 - 2035?

The expected CAGR for the Methane Market during the forecast period 2025 - 2035 is 5.32%.

Which companies are considered key players in the Methane Market?

Key players in the Methane Market include ExxonMobil, Chevron, Royal Dutch Shell, TotalEnergies, BP, ConocoPhillips, Eni, Equinor, and Cheniere Energy.

What are the main segments of the Methane Market?

The main segments of the Methane Market include Source, Application, and End Use Industry.

What was the valuation of natural and synthetic methane sources in 2024?

In 2024, natural methane sources were valued at 60.73 USD Billion, while synthetic sources were valued at 40.49 USD Billion.

Market Summary

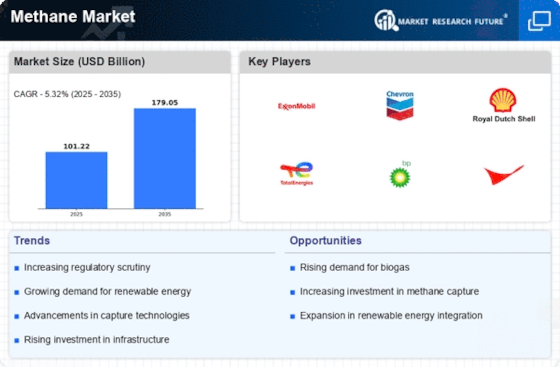
As per MRFR analysis, the Methane Market Size was estimated at 101.22 USD Billion in 2024. The Methane industry is projected to grow from 106.61 USD Billion in 2025 to 179.05 USD Billion by 2035, exhibiting a compound annual growth rate (CAGR) of 5.32 during the forecast period 2025 - 2035.

Key Market Trends & Highlights

The Methane Market is poised for substantial growth driven by regulatory frameworks and technological advancements.

  • North America remains the largest market for methane, driven by robust regulatory frameworks and energy demand.
  • Asia-Pacific is emerging as the fastest-growing region, with increasing investments in renewable energy and innovative technologies.
  • Natural methane continues to dominate the market, while synthetic methane is rapidly gaining traction due to shifting consumer preferences.
  • Rising energy demand and advancements in agricultural practices are key drivers propelling the methane market forward.

Market Size & Forecast

2024 Market Size 101.22 (USD Billion)
2035 Market Size 179.05 (USD Billion)
CAGR (2025 - 2035) 5.32%
Largest Regional Market Share in 2024 North America

Major Players

<p>ExxonMobil (US), Chevron (US), Royal Dutch Shell (GB), TotalEnergies (FR), BP (GB), ConocoPhillips (US), Eni (IT), Equinor (NO), Cheniere Energy (US)</p>

Market Trends

The Methane Market is currently experiencing a dynamic transformation driven by various factors, including regulatory frameworks, technological advancements, and shifting consumer preferences. Governments worldwide are increasingly recognizing the environmental impact of methane emissions, leading to stricter regulations aimed at reducing greenhouse gases. This regulatory push is fostering innovation in methane capture and utilization technologies, which are becoming more economically viable. Furthermore, the growing emphasis on renewable energy sources is prompting industries to explore methane as a cleaner alternative to traditional fossil fuels. As a result, the market is witnessing a surge in investments aimed at enhancing methane production efficiency and sustainability. In addition to regulatory influences, the Methane Market is also shaped by evolving consumer attitudes towards sustainability. There is a noticeable shift towards cleaner energy solutions, with consumers demanding more environmentally friendly options. This trend is encouraging companies to adopt practices that minimize methane emissions throughout their supply chains. Moreover, advancements in research and development are paving the way for innovative applications of methane, such as in the production of hydrogen and biofuels. Overall, the Methane Market appears poised for growth, driven by a combination of regulatory support, technological innovation, and changing consumer preferences.

Regulatory Developments

The Methane Market is significantly influenced by evolving regulations aimed at curbing emissions. Governments are implementing stricter policies that encourage industries to adopt cleaner practices, thereby fostering a more sustainable approach to methane production and utilization.

Technological Innovations

Advancements in technology are playing a crucial role in enhancing the efficiency of methane capture and utilization. Innovations in extraction methods and processing techniques are making it more feasible for industries to harness methane as a viable energy source.

Shifting Consumer Preferences

There is a growing demand for sustainable energy solutions among consumers, which is impacting the Methane Market. As awareness of environmental issues increases, companies are responding by integrating cleaner practices and exploring alternative uses for methane.

Methane Market Market Drivers

Rising Energy Demand

The Methane Market is significantly impacted by the rising demand for energy across various sectors. As populations grow and economies develop, the need for cleaner energy sources is becoming more pronounced. Methane Market, as a cleaner-burning fossil fuel compared to coal and oil, is increasingly being utilized in power generation and transportation. This shift towards natural gas, which is primarily composed of methane, is expected to drive the Methane Market forward. Projections indicate that the demand for natural gas will increase by approximately 30% by 2030, further solidifying methane's role in the energy transition.

Regulatory Frameworks

The Methane Market is currently influenced by evolving regulatory frameworks aimed at reducing greenhouse gas emissions. Governments are implementing stricter regulations to curb methane emissions from various sectors, including agriculture and energy. For instance, the introduction of carbon pricing mechanisms and emission reduction targets is prompting companies to adopt cleaner technologies. This regulatory push is expected to drive investments in methane capture and utilization technologies, thereby expanding the Methane Market. As of 2025, the market is projected to grow significantly, with estimates suggesting a compound annual growth rate of over 10%, driven by compliance with these regulations.

Agricultural Practices

Agricultural practices are a crucial driver of the Methane Market, particularly due to methane emissions from livestock and rice cultivation. The sector is under pressure to adopt sustainable practices that minimize methane emissions. Innovations such as anaerobic digestion and improved manure management techniques are gaining traction, allowing farmers to convert waste into energy. This not only reduces emissions but also provides an additional revenue stream for agricultural producers. As the agricultural sector seeks to align with environmental goals, the Methane Market is likely to experience growth, with estimates suggesting a potential increase in market size by 15% over the next five years.

Technological Advancements

Technological advancements play a pivotal role in shaping the Methane Market. Innovations in methane detection and capture technologies are enhancing efficiency and reducing costs associated with methane management. For example, the development of advanced sensors and monitoring systems allows for real-time tracking of methane emissions, facilitating timely interventions. Furthermore, the integration of artificial intelligence and machine learning in methane management systems is optimizing operational processes. As a result, the Methane Market is witnessing increased adoption of these technologies, which is likely to enhance overall market growth. The market is expected to reach a valuation of several billion dollars by 2026, reflecting the impact of these advancements.

Investment in Renewable Energy

Investment in renewable energy sources is emerging as a significant driver for the Methane Market. As countries strive to meet climate goals, there is a growing emphasis on integrating renewable energy with methane recovery systems. Projects that capture methane from landfills and wastewater treatment facilities are being developed to produce renewable natural gas. This trend is expected to attract substantial investments, as stakeholders recognize the dual benefits of reducing emissions while generating energy. The Methane Market could see an influx of capital, with projections indicating that investments in renewable methane projects may exceed several billion dollars by 2027.

Market Segment Insights

Methane Market Source Insights

The Methane Market segmentation, based on source, includes natural and synthetic. In 2022, the natural category led the market, and this trend is anticipated throughout the forecast period. This is explained by methane's widespread availability in the environment.

Methane Market Application Insights

The Methane Market segmentation, based on application, includes fuel, natural gas, liquefied natural gas, liquid-methane rocket fuel, and chemical feedstock. In 2022, the worldwide liquid-methane rocket fuel market was dominated by the fuel category. This can be linked to the rising demand for gasoline across many industries worldwide.

Methane Market End Use Industry Insights

The Methane Market segmentation, based on End Use Industry, includes automotive and aerospace & defense. Due to the growing use of methane in the automotive industry, the automotive segment led the methane market in 2022.

Figure 1:  Methane Market, by End Use Industry, 2023 & 2032 (USD Billion)

Source: Secondary Research, Primary Research, Market Research Future Database and Analyst Review

Get more detailed insights about Methane Market Research Report – Global Forecast till 2035

Regional Insights

North America : Energy Innovation Leader

North America is the largest market for methane, accounting for approximately 40% of global demand. The region's growth is driven by advancements in extraction technologies, increasing natural gas consumption, and supportive regulatory frameworks aimed at reducing emissions. The U.S. and Canada are the primary contributors, with significant investments in infrastructure and renewable energy initiatives enhancing market dynamics. The competitive landscape is characterized by major players such as ExxonMobil, Chevron, and Cheniere Energy, which dominate the market. These companies are focusing on sustainable practices and innovative technologies to maintain their leadership. The presence of extensive pipeline networks and export facilities further strengthens North America's position in The Methane Market.

Europe : Sustainable Energy Transition

Europe is the second-largest market for methane, holding around 30% of the global share. The region's growth is propelled by stringent environmental regulations and a strong commitment to reducing greenhouse gas emissions. The European Green Deal and various national policies are driving demand for cleaner energy sources, including natural gas as a transitional fuel, which is expected to play a crucial role in the energy mix. Leading countries in this market include Germany, France, and the Netherlands, where major companies like TotalEnergies and BP are actively involved. The competitive landscape is evolving, with a focus on innovation and sustainability. European firms are investing in technologies to capture and utilize methane emissions, aligning with the region's climate goals. The European Commission emphasizes the importance of reducing methane emissions to achieve climate neutrality by 2050.

Asia-Pacific : Emerging Market Potential

Asia-Pacific is witnessing rapid growth in the methane market, accounting for approximately 25% of global demand. The region's expansion is driven by increasing energy needs, urbanization, and a shift towards cleaner energy sources. Countries like China and India are leading this growth, with significant investments in natural gas infrastructure and policies promoting the use of cleaner fuels to combat air pollution and greenhouse gas emissions. China is the largest market in the region, followed by India, where key players such as Eni and Equinor are establishing a strong presence. The competitive landscape is marked by a mix of state-owned enterprises and private companies, all vying for market share. The region's focus on energy security and sustainability is shaping the future of the methane market, with ongoing projects aimed at enhancing production and distribution capabilities.

Middle East and Africa : Resource-Rich Opportunities

The Middle East and Africa region is emerging as a significant player in the methane market, holding about 5% of the global share. The growth is primarily driven by abundant natural gas reserves and increasing investments in energy infrastructure. Countries like Qatar and Nigeria are focusing on expanding their natural gas production capabilities, which is expected to boost methane supply in the coming years. The competitive landscape features a mix of national oil companies and international players, with firms like BP and TotalEnergies actively involved in exploration and production. The region's strategic location for gas exports enhances its attractiveness in the global market. As energy demands rise, the Middle East and Africa are poised to capitalize on their resources, making them key contributors to the global methane supply chain.

Key Players and Competitive Insights

Leading market players are investing heavily in research and development in order to expand their product lines, which will help the Methane Market, grow even more. Market participants are also undertaking a variety of strategic activities to expand their footprint, with important market developments including new product launches, contractual agreements, mergers and acquisitions, higher investments, and collaboration with other organizations. To expand and survive in a more competitive and rising market climate, Methane industry must offer cost-effective items.

Manufacturing locally to minimize operational costs is one of the key business tactics used by manufacturers in the Methane industry to benefit clients and increase the market sector. In recent years, the Methane industry has offered some of the most significant advantages to medicine.

Major players in the Methane Market, including Oil and Natural Gas Corporation, Royal Dutch Shell PLC, Senex Energy Limited, G3 Exploration, Black Diamond Energy Inc., Halliburton Co., IGas Energy, China National Offshore Oil Company, China National Petroleum Corporation, Metgasco Ltd., BP PLC, TLOU Energy Ltd, Dart Energy Corporation, Bow Energy, and American Gas Products, are attempting to increase market demand by investing in research and development operations.

Engineering and industrial gas provider Linde plc (Linde). Industrial, process, and speciality gases are provided by it. producing well producing industrial gases including carbon dioxide, helium, hydrogen, electronic gases, and acetylene, the company also produces atmospheric gases like oxygen, nitrogen, and argon. Additionally, Linde provides a variety of gas production and processing services in addition to designing, engineering, and constructing machinery that produces gases for internal use. Healthcare, petroleum refining, manufacturing, food, beverage carbonation, fiber-optics, steel production, aerospace, chemicals and energy, electronics, and water treatment are just a few of the industries it supports.

In APAC, EMEA, and the Americas, it runs cryogenic air separation plants, hydrogen plants, and carbon dioxide plants. In Guildford, Surrey, United Kingdom, Linde is headquartered.

The industrial and healthcare industries are served by Air Liquide SA (Air Liquide), a provider of gases, technologies, and services. Along with argon and other rare gases, the company also produces gases such as oxygen, nitrogen, and hydrogen. Customers in a variety of industries, including steel, food and pharmaceuticals, chemicals, electronics, automotive, and manufacturing, are served by this company's supply of these gases. The business also creates processing facilities and associated infrastructure. Skin disinfectants, antiseptics, and medical device disinfection products are offered by Air Liquide. The business distributes its goods via local facilities, tanker trucks, and cylinders.

It operates in the Americas, Europe, Africa, the Middle East, and Asia-Pacific. The headquarters of Air Liquide are located in Paris, Ile-de-France, France.

Key Companies in the Methane Market market include

Industry Developments

December 2021: In order to research methods to reduce methane emissions in the oil, coal, and gas industries, the U.S. Department of Energy (DOE) announced a USD35 million investment in twelve projects. In an effort to reduce methane emissions in the United States, the Advanced Research Projects Agency-Energy (ARPA-E) of the DOE announced the Reducing Emissions of Methane Market Every Day of the Year (REMEDY) program earlier this year.

November 2021: For its initial data submission to the UN-sponsored Oil and Gas Methane Market Partnership 2.0 (OGMP 2.0), Jonah Energy LLC was awarded the Gold Standard.

Future Outlook

Methane Market Future Outlook

<p>The Methane Market is projected to grow at a 5.32% CAGR from 2024 to 2035, driven by increasing demand for cleaner energy and technological advancements in methane capture.</p>

New opportunities lie in:

  • <p>Development of advanced methane detection technologies for leak prevention.</p>
  • <p>Expansion of biogas production facilities to harness organic waste.</p>
  • <p>Investment in methane-based fuel cell technologies for transportation.</p>

<p>By 2035, the Methane Market is expected to be robust, driven by innovation and sustainable practices.</p>

Market Segmentation

Methane Market Source Outlook

  • Natural
  • Synthetic

Methane Market Application Outlook

  • Fuel
  • Natural Gas
  • Liquefied Natural Gas
  • Liquid-Methane Rocket Fuel
  • Chemical Feedstock

Methane Market End Use Industry Outlook

  • Automotive
  • Aerospace & Defense

Report Scope

MARKET SIZE 2024101.22(USD Billion)
MARKET SIZE 2025106.61(USD Billion)
MARKET SIZE 2035179.05(USD Billion)
COMPOUND ANNUAL GROWTH RATE (CAGR)5.32% (2024 - 2035)
REPORT COVERAGERevenue Forecast, Competitive Landscape, Growth Factors, and Trends
BASE YEAR2024
Market Forecast Period2025 - 2035
Historical Data2019 - 2024
Market Forecast UnitsUSD Billion
Key Companies ProfiledMarket analysis in progress
Segments CoveredMarket segmentation analysis in progress
Key Market OpportunitiesAdvancements in methane capture technologies enhance sustainability and create new market opportunities.
Key Market DynamicsRising regulatory pressures and technological advancements drive innovation and competition in the methane market.
Countries CoveredNorth America, Europe, APAC, South America, MEA

FAQs

What is the current valuation of the Methane Market as of 2024?

The Methane Market was valued at 101.22 USD Billion in 2024.

What is the projected market valuation for the Methane Market in 2035?

The Methane Market is projected to reach a valuation of 179.05 USD Billion by 2035.

What is the expected CAGR for the Methane Market during the forecast period 2025 - 2035?

The expected CAGR for the Methane Market during the forecast period 2025 - 2035 is 5.32%.

Which companies are considered key players in the Methane Market?

Key players in the Methane Market include ExxonMobil, Chevron, Royal Dutch Shell, TotalEnergies, BP, ConocoPhillips, Eni, Equinor, and Cheniere Energy.

What are the main segments of the Methane Market?

The main segments of the Methane Market include Source, Application, and End Use Industry.

What was the valuation of natural and synthetic methane sources in 2024?

In 2024, natural methane sources were valued at 60.73 USD Billion, while synthetic sources were valued at 40.49 USD Billion.

  1. SECTION I: EXECUTIVE SUMMARY AND KEY HIGHLIGHTS
    1. EXECUTIVE SUMMARY
      1. Market Overview
      2. Key Findings
      3. Market Segmentation
      4. Competitive Landscape
      5. Challenges and Opportunities
      6. Future Outlook
  2. SECTION II: SCOPING, METHODOLOGY AND MARKET STRUCTURE
    1. MARKET INTRODUCTION
      1. Definition
      2. Scope of the study
    2. RESEARCH METHODOLOGY
      1. Overview
      2. Data Mining
      3. Secondary Research
      4. Primary Research
      5. Forecasting Model
      6. Market Size Estimation
      7. Data Triangulation
      8. Validation
  3. SECTION III: QUALITATIVE ANALYSIS
    1. MARKET DYNAMICS
      1. Overview
      2. Drivers
      3. Restraints
      4. Opportunities
    2. MARKET FACTOR ANALYSIS
      1. Value chain Analysis
      2. Porter's Five Forces Analysis
      3. COVID-19 Impact Analysis
  4. SECTION IV: QUANTITATIVE ANALYSIS
    1. Chemicals and Materials, BY Source (USD Billion)
      1. Natural
      2. Synthetic
    2. Chemicals and Materials, BY Application (USD Billion)
      1. Fuel
      2. Natural Gas
      3. Liquefied Natural Gas
      4. Liquid-Methane Rocket Fuel
      5. Chemical Feedstock
    3. Chemicals and Materials, BY End Use Industry (USD Billion)
      1. Automotive
      2. Aerospace & Defense
    4. Chemicals and Materials, BY Region (USD Billion)
      1. North America
      2. Europe
      3. APAC
      4. South America
      5. MEA
  5. SECTION V: COMPETITIVE ANALYSIS
    1. Competitive Landscape
      1. Overview
      2. Competitive Analysis
      3. Market share Analysis
      4. Major Growth Strategy in the Chemicals and Materials
      5. Competitive Benchmarking
      6. Leading Players in Terms of Number of Developments in the Chemicals and Materials
      7. Key developments and growth strategies
      8. Major Players Financial Matrix
    2. Company Profiles
      1. ExxonMobil (US)
      2. Chevron (US)
      3. Royal Dutch Shell (GB)
      4. TotalEnergies (FR)
      5. BP (GB)
      6. ConocoPhillips (US)
      7. Eni (IT)
      8. Equinor (NO)
      9. Cheniere Energy (US)
    3. Appendix
      1. References
      2. Related Reports
  6. LIST OF FIGURES
    1. MARKET SYNOPSIS
    2. NORTH AMERICA MARKET ANALYSIS
    3. US MARKET ANALYSIS BY SOURCE
    4. US MARKET ANALYSIS BY APPLICATION
    5. US MARKET ANALYSIS BY END USE INDUSTRY
    6. CANADA MARKET ANALYSIS BY SOURCE
    7. CANADA MARKET ANALYSIS BY APPLICATION
    8. CANADA MARKET ANALYSIS BY END USE INDUSTRY
    9. EUROPE MARKET ANALYSIS
    10. GERMANY MARKET ANALYSIS BY SOURCE
    11. GERMANY MARKET ANALYSIS BY APPLICATION
    12. GERMANY MARKET ANALYSIS BY END USE INDUSTRY
    13. UK MARKET ANALYSIS BY SOURCE
    14. UK MARKET ANALYSIS BY APPLICATION
    15. UK MARKET ANALYSIS BY END USE INDUSTRY
    16. FRANCE MARKET ANALYSIS BY SOURCE
    17. FRANCE MARKET ANALYSIS BY APPLICATION
    18. FRANCE MARKET ANALYSIS BY END USE INDUSTRY
    19. RUSSIA MARKET ANALYSIS BY SOURCE
    20. RUSSIA MARKET ANALYSIS BY APPLICATION
    21. RUSSIA MARKET ANALYSIS BY END USE INDUSTRY
    22. ITALY MARKET ANALYSIS BY SOURCE
    23. ITALY MARKET ANALYSIS BY APPLICATION
    24. ITALY MARKET ANALYSIS BY END USE INDUSTRY
    25. SPAIN MARKET ANALYSIS BY SOURCE
    26. SPAIN MARKET ANALYSIS BY APPLICATION
    27. SPAIN MARKET ANALYSIS BY END USE INDUSTRY
    28. REST OF EUROPE MARKET ANALYSIS BY SOURCE
    29. REST OF EUROPE MARKET ANALYSIS BY APPLICATION
    30. REST OF EUROPE MARKET ANALYSIS BY END USE INDUSTRY
    31. APAC MARKET ANALYSIS
    32. CHINA MARKET ANALYSIS BY SOURCE
    33. CHINA MARKET ANALYSIS BY APPLICATION
    34. CHINA MARKET ANALYSIS BY END USE INDUSTRY
    35. INDIA MARKET ANALYSIS BY SOURCE
    36. INDIA MARKET ANALYSIS BY APPLICATION
    37. INDIA MARKET ANALYSIS BY END USE INDUSTRY
    38. JAPAN MARKET ANALYSIS BY SOURCE
    39. JAPAN MARKET ANALYSIS BY APPLICATION
    40. JAPAN MARKET ANALYSIS BY END USE INDUSTRY
    41. SOUTH KOREA MARKET ANALYSIS BY SOURCE
    42. SOUTH KOREA MARKET ANALYSIS BY APPLICATION
    43. SOUTH KOREA MARKET ANALYSIS BY END USE INDUSTRY
    44. MALAYSIA MARKET ANALYSIS BY SOURCE
    45. MALAYSIA MARKET ANALYSIS BY APPLICATION
    46. MALAYSIA MARKET ANALYSIS BY END USE INDUSTRY
    47. THAILAND MARKET ANALYSIS BY SOURCE
    48. THAILAND MARKET ANALYSIS BY APPLICATION
    49. THAILAND MARKET ANALYSIS BY END USE INDUSTRY
    50. INDONESIA MARKET ANALYSIS BY SOURCE
    51. INDONESIA MARKET ANALYSIS BY APPLICATION
    52. INDONESIA MARKET ANALYSIS BY END USE INDUSTRY
    53. REST OF APAC MARKET ANALYSIS BY SOURCE
    54. REST OF APAC MARKET ANALYSIS BY APPLICATION
    55. REST OF APAC MARKET ANALYSIS BY END USE INDUSTRY
    56. SOUTH AMERICA MARKET ANALYSIS
    57. BRAZIL MARKET ANALYSIS BY SOURCE
    58. BRAZIL MARKET ANALYSIS BY APPLICATION
    59. BRAZIL MARKET ANALYSIS BY END USE INDUSTRY
    60. MEXICO MARKET ANALYSIS BY SOURCE
    61. MEXICO MARKET ANALYSIS BY APPLICATION
    62. MEXICO MARKET ANALYSIS BY END USE INDUSTRY
    63. ARGENTINA MARKET ANALYSIS BY SOURCE
    64. ARGENTINA MARKET ANALYSIS BY APPLICATION
    65. ARGENTINA MARKET ANALYSIS BY END USE INDUSTRY
    66. REST OF SOUTH AMERICA MARKET ANALYSIS BY SOURCE
    67. REST OF SOUTH AMERICA MARKET ANALYSIS BY APPLICATION
    68. REST OF SOUTH AMERICA MARKET ANALYSIS BY END USE INDUSTRY
    69. MEA MARKET ANALYSIS
    70. GCC COUNTRIES MARKET ANALYSIS BY SOURCE
    71. GCC COUNTRIES MARKET ANALYSIS BY APPLICATION
    72. GCC COUNTRIES MARKET ANALYSIS BY END USE INDUSTRY
    73. SOUTH AFRICA MARKET ANALYSIS BY SOURCE
    74. SOUTH AFRICA MARKET ANALYSIS BY APPLICATION
    75. SOUTH AFRICA MARKET ANALYSIS BY END USE INDUSTRY
    76. REST OF MEA MARKET ANALYSIS BY SOURCE
    77. REST OF MEA MARKET ANALYSIS BY APPLICATION
    78. REST OF MEA MARKET ANALYSIS BY END USE INDUSTRY
    79. KEY BUYING CRITERIA OF CHEMICALS AND MATERIALS
    80. RESEARCH PROCESS OF MRFR
    81. DRO ANALYSIS OF CHEMICALS AND MATERIALS
    82. DRIVERS IMPACT ANALYSIS: CHEMICALS AND MATERIALS
    83. RESTRAINTS IMPACT ANALYSIS: CHEMICALS AND MATERIALS
    84. SUPPLY / VALUE CHAIN: CHEMICALS AND MATERIALS
    85. CHEMICALS AND MATERIALS, BY SOURCE, 2024 (% SHARE)
    86. CHEMICALS AND MATERIALS, BY SOURCE, 2024 TO 2035 (USD Billion)
    87. CHEMICALS AND MATERIALS, BY APPLICATION, 2024 (% SHARE)
    88. CHEMICALS AND MATERIALS, BY APPLICATION, 2024 TO 2035 (USD Billion)
    89. CHEMICALS AND MATERIALS, BY END USE INDUSTRY, 2024 (% SHARE)
    90. CHEMICALS AND MATERIALS, BY END USE INDUSTRY, 2024 TO 2035 (USD Billion)
    91. BENCHMARKING OF MAJOR COMPETITORS
  7. LIST OF TABLES
    1. LIST OF ASSUMPTIONS
    2. North America MARKET SIZE ESTIMATES; FORECAST
      1. BY SOURCE, 2025-2035 (USD Billion)
      2. BY APPLICATION, 2025-2035 (USD Billion)
      3. BY END USE INDUSTRY, 2025-2035 (USD Billion)
    3. US MARKET SIZE ESTIMATES; FORECAST
      1. BY SOURCE, 2025-2035 (USD Billion)
      2. BY APPLICATION, 2025-2035 (USD Billion)
      3. BY END USE INDUSTRY, 2025-2035 (USD Billion)
    4. Canada MARKET SIZE ESTIMATES; FORECAST
      1. BY SOURCE, 2025-2035 (USD Billion)
      2. BY APPLICATION, 2025-2035 (USD Billion)
      3. BY END USE INDUSTRY, 2025-2035 (USD Billion)
    5. Europe MARKET SIZE ESTIMATES; FORECAST
      1. BY SOURCE, 2025-2035 (USD Billion)
      2. BY APPLICATION, 2025-2035 (USD Billion)
      3. BY END USE INDUSTRY, 2025-2035 (USD Billion)
    6. Germany MARKET SIZE ESTIMATES; FORECAST
      1. BY SOURCE, 2025-2035 (USD Billion)
      2. BY APPLICATION, 2025-2035 (USD Billion)
      3. BY END USE INDUSTRY, 2025-2035 (USD Billion)
    7. UK MARKET SIZE ESTIMATES; FORECAST
      1. BY SOURCE, 2025-2035 (USD Billion)
      2. BY APPLICATION, 2025-2035 (USD Billion)
      3. BY END USE INDUSTRY, 2025-2035 (USD Billion)
    8. France MARKET SIZE ESTIMATES; FORECAST
      1. BY SOURCE, 2025-2035 (USD Billion)
      2. BY APPLICATION, 2025-2035 (USD Billion)
      3. BY END USE INDUSTRY, 2025-2035 (USD Billion)
    9. Russia MARKET SIZE ESTIMATES; FORECAST
      1. BY SOURCE, 2025-2035 (USD Billion)
      2. BY APPLICATION, 2025-2035 (USD Billion)
      3. BY END USE INDUSTRY, 2025-2035 (USD Billion)
    10. Italy MARKET SIZE ESTIMATES; FORECAST
      1. BY SOURCE, 2025-2035 (USD Billion)
      2. BY APPLICATION, 2025-2035 (USD Billion)
      3. BY END USE INDUSTRY, 2025-2035 (USD Billion)
    11. Spain MARKET SIZE ESTIMATES; FORECAST
      1. BY SOURCE, 2025-2035 (USD Billion)
      2. BY APPLICATION, 2025-2035 (USD Billion)
      3. BY END USE INDUSTRY, 2025-2035 (USD Billion)
    12. Rest of Europe MARKET SIZE ESTIMATES; FORECAST
      1. BY SOURCE, 2025-2035 (USD Billion)
      2. BY APPLICATION, 2025-2035 (USD Billion)
      3. BY END USE INDUSTRY, 2025-2035 (USD Billion)
    13. APAC MARKET SIZE ESTIMATES; FORECAST
      1. BY SOURCE, 2025-2035 (USD Billion)
      2. BY APPLICATION, 2025-2035 (USD Billion)
      3. BY END USE INDUSTRY, 2025-2035 (USD Billion)
    14. China MARKET SIZE ESTIMATES; FORECAST
      1. BY SOURCE, 2025-2035 (USD Billion)
      2. BY APPLICATION, 2025-2035 (USD Billion)
      3. BY END USE INDUSTRY, 2025-2035 (USD Billion)
    15. India MARKET SIZE ESTIMATES; FORECAST
      1. BY SOURCE, 2025-2035 (USD Billion)
      2. BY APPLICATION, 2025-2035 (USD Billion)
      3. BY END USE INDUSTRY, 2025-2035 (USD Billion)
    16. Japan MARKET SIZE ESTIMATES; FORECAST
      1. BY SOURCE, 2025-2035 (USD Billion)
      2. BY APPLICATION, 2025-2035 (USD Billion)
      3. BY END USE INDUSTRY, 2025-2035 (USD Billion)
    17. South Korea MARKET SIZE ESTIMATES; FORECAST
      1. BY SOURCE, 2025-2035 (USD Billion)
      2. BY APPLICATION, 2025-2035 (USD Billion)
      3. BY END USE INDUSTRY, 2025-2035 (USD Billion)
    18. Malaysia MARKET SIZE ESTIMATES; FORECAST
      1. BY SOURCE, 2025-2035 (USD Billion)
      2. BY APPLICATION, 2025-2035 (USD Billion)
      3. BY END USE INDUSTRY, 2025-2035 (USD Billion)
    19. Thailand MARKET SIZE ESTIMATES; FORECAST
      1. BY SOURCE, 2025-2035 (USD Billion)
      2. BY APPLICATION, 2025-2035 (USD Billion)
      3. BY END USE INDUSTRY, 2025-2035 (USD Billion)
    20. Indonesia MARKET SIZE ESTIMATES; FORECAST
      1. BY SOURCE, 2025-2035 (USD Billion)
      2. BY APPLICATION, 2025-2035 (USD Billion)
      3. BY END USE INDUSTRY, 2025-2035 (USD Billion)
    21. Rest of APAC MARKET SIZE ESTIMATES; FORECAST
      1. BY SOURCE, 2025-2035 (USD Billion)
      2. BY APPLICATION, 2025-2035 (USD Billion)
      3. BY END USE INDUSTRY, 2025-2035 (USD Billion)
    22. South America MARKET SIZE ESTIMATES; FORECAST
      1. BY SOURCE, 2025-2035 (USD Billion)
      2. BY APPLICATION, 2025-2035 (USD Billion)
      3. BY END USE INDUSTRY, 2025-2035 (USD Billion)
    23. Brazil MARKET SIZE ESTIMATES; FORECAST
      1. BY SOURCE, 2025-2035 (USD Billion)
      2. BY APPLICATION, 2025-2035 (USD Billion)
      3. BY END USE INDUSTRY, 2025-2035 (USD Billion)
    24. Mexico MARKET SIZE ESTIMATES; FORECAST
      1. BY SOURCE, 2025-2035 (USD Billion)
      2. BY APPLICATION, 2025-2035 (USD Billion)
      3. BY END USE INDUSTRY, 2025-2035 (USD Billion)
    25. Argentina MARKET SIZE ESTIMATES; FORECAST
      1. BY SOURCE, 2025-2035 (USD Billion)
      2. BY APPLICATION, 2025-2035 (USD Billion)
      3. BY END USE INDUSTRY, 2025-2035 (USD Billion)
    26. Rest of South America MARKET SIZE ESTIMATES; FORECAST
      1. BY SOURCE, 2025-2035 (USD Billion)
      2. BY APPLICATION, 2025-2035 (USD Billion)
      3. BY END USE INDUSTRY, 2025-2035 (USD Billion)
    27. MEA MARKET SIZE ESTIMATES; FORECAST
      1. BY SOURCE, 2025-2035 (USD Billion)
      2. BY APPLICATION, 2025-2035 (USD Billion)
      3. BY END USE INDUSTRY, 2025-2035 (USD Billion)
    28. GCC Countries MARKET SIZE ESTIMATES; FORECAST
      1. BY SOURCE, 2025-2035 (USD Billion)
      2. BY APPLICATION, 2025-2035 (USD Billion)
      3. BY END USE INDUSTRY, 2025-2035 (USD Billion)
    29. South Africa MARKET SIZE ESTIMATES; FORECAST
      1. BY SOURCE, 2025-2035 (USD Billion)
      2. BY APPLICATION, 2025-2035 (USD Billion)
      3. BY END USE INDUSTRY, 2025-2035 (USD Billion)
    30. Rest of MEA MARKET SIZE ESTIMATES; FORECAST
      1. BY SOURCE, 2025-2035 (USD Billion)
      2. BY APPLICATION, 2025-2035 (USD Billion)
      3. BY END USE INDUSTRY, 2025-2035 (USD Billion)
    31. PRODUCT LAUNCH/PRODUCT DEVELOPMENT/APPROVAL
    32. ACQUISITION/PARTNERSHIP

Methane Source Outlook (USD Billion, 2018-2032)

  • Natural
  • Synthetic

Methane Application Outlook (USD Billion, 2018-2032)

  • Fuel
  • Natural Gas
  • Liquefied Natural Gas
  • Liquid-Methane Rocket Fuel
  • Chemical Feedstock

Methane End-User Outlook (USD Billion, 2018-2032)

  • Automotive
  • Aerospace & Defense

Methane Regional Outlook (USD Billion, 2018-2032)

  • North America Outlook (USD Billion, 2018-2032)

    • Methane by Source
      • Natural
      • Synthetic
    • Methane by Application
      • Fuel
      • Natural Gas
      • Liquefied Natural Gas
      • Liquid-Methane Rocket Fuel
      • Chemical Feedstock
    • Methane by End-User
      • Automotive
      • Aerospace & Defense
    • US Outlook (USD Billion, 2018-2032)

    • Methane by Source
      • Natural
      • Synthetic
    • Methane by Application
      • Fuel
      • Natural Gas
      • Liquefied Natural Gas
      • Liquid-Methane Rocket Fuel
      • Chemical Feedstock
    • Methane by End-User
      • Automotive
      • Aerospace & Defense
    • Canada Outlook (USD Billion, 2018-2032)

    • Methane by Source
      • Natural
      • Synthetic
    • Methane by Application
      • Fuel
      • Natural Gas
      • Liquefied Natural Gas
      • Liquid-Methane Rocket Fuel
      • Chemical Feedstock
    • Methane by End-User
      • Automotive
      • Aerospace & Defense
  • Europe Outlook (USD Billion, 2018-2032)

    • Methane by Source
      • Natural
      • Synthetic
    • Methane by Application
      • Fuel
      • Natural Gas
      • Liquefied Natural Gas
      • Liquid-Methane Rocket Fuel
      • Chemical Feedstock
    • Methane by End-User
      • Automotive
      • Aerospace & Defense
    • Germany Outlook (USD Billion, 2018-2032)

    • Methane by Source
      • Natural
      • Synthetic
    • Methane by Application
      • Fuel
      • Natural Gas
      • Liquefied Natural Gas
      • Liquid-Methane Rocket Fuel
      • Chemical Feedstock
    • Methane by End-User
      • Automotive
      • Aerospace & Defense
    • France Outlook (USD Billion, 2018-2032)

    • Methane by Source
      • Natural
      • Synthetic
    • Methane by Application
      • Fuel
      • Natural Gas
      • Liquefied Natural Gas
      • Liquid-Methane Rocket Fuel
      • Chemical Feedstock
    • Methane by End-User
      • Automotive
      • Aerospace & Defense
    • UK Outlook (USD Billion, 2018-2032)

    • Methane by Source
      • Natural
      • Synthetic
    • Methane by Application
      • Fuel
      • Natural Gas
      • Liquefied Natural Gas
      • Liquid-Methane Rocket Fuel
      • Chemical Feedstock
    • Methane by End-User
      • Automotive
      • Aerospace & Defense
    • Italy Outlook (USD Billion, 2018-2032)

    • Methane by Source
      • Natural
      • Synthetic
    • Methane by Application
      • Fuel
      • Natural Gas
      • Liquefied Natural Gas
      • Liquid-Methane Rocket Fuel
      • Chemical Feedstock
    • Methane by End-User
      • Automotive
      • Aerospace & Defense
    • Spain Outlook (USD Billion, 2018-2032)

    • Methane by Source
      • Natural
      • Synthetic
    • Methane by Application
      • Fuel
      • Natural Gas
      • Liquefied Natural Gas
      • Liquid-Methane Rocket Fuel
      • Chemical Feedstock
    • Methane by End-User
      • Automotive
      • Aerospace & Defense
    • Rest Of Europe Outlook (USD Billion, 2018-2032)

    • Methane by Source
      • Natural
      • Synthetic
    • Methane by Application
      • Fuel
      • Natural Gas
      • Liquefied Natural Gas
      • Liquid-Methane Rocket Fuel
      • Chemical Feedstock
    • Methane by End-User
      • Automotive
      • Aerospace & Defense
  • Asia-Pacific Outlook (USD Billion, 2018-2032)

    • Methane by Source
      • Natural
      • Synthetic
    • Methane by Application
      • Fuel
      • Natural Gas
      • Liquefied Natural Gas
      • Liquid-Methane Rocket Fuel
      • Chemical Feedstock
    • Methane by End-User
      • Automotive
      • Aerospace & Defense
    • China Outlook (USD Billion, 2018-2032)

    • Methane by Source
      • Natural
      • Synthetic
    • Methane by Application
      • Fuel
      • Natural Gas
      • Liquefied Natural Gas
      • Liquid-Methane Rocket Fuel
      • Chemical Feedstock
    • Methane by End-User
      • Automotive
      • Aerospace & Defense
    • Japan Outlook (USD Billion, 2018-2032)

    • Methane by Source
      • Natural
      • Synthetic
    • Methane by Application
      • Fuel
      • Natural Gas
      • Liquefied Natural Gas
      • Liquid-Methane Rocket Fuel
      • Chemical Feedstock
    • Methane by End-User
      • Automotive
      • Aerospace & Defense
    • India Outlook (USD Billion, 2018-2032)

    • Methane by Source
      • Natural
      • Synthetic
    • Methane by Application
      • Fuel
      • Natural Gas
      • Liquefied Natural Gas
      • Liquid-Methane Rocket Fuel
      • Chemical Feedstock
    • Methane by End-User
      • Automotive
      • Aerospace & Defense
    • Australia Outlook (USD Billion, 2018-2032)

    • Methane by Source
      • Natural
      • Synthetic
    • Methane by Application
      • Fuel
      • Natural Gas
      • Liquefied Natural Gas
      • Liquid-Methane Rocket Fuel
      • Chemical Feedstock
    • Methane by End-User
      • Automotive
      • Aerospace & Defense
    • Rest of Asia-Pacific Outlook (USD Billion, 2018-2032)

    • Methane by Source
      • Natural
      • Synthetic
    • Methane by Application
      • Fuel
      • Natural Gas
      • Liquefied Natural Gas
      • Liquid-Methane Rocket Fuel
      • Chemical Feedstock
    • Methane by End-User
      • Automotive
      • Aerospace & Defense
  • Rest of the World Outlook (USD Billion, 2018-2032)

    • Methane by Source
      • Natural
      • Synthetic
    • Methane by Application
      • Fuel
      • Natural Gas
      • Liquefied Natural Gas
      • Liquid-Methane Rocket Fuel
      • Chemical Feedstock
    • Methane by End-User
      • Automotive
      • Aerospace & Defense
    • Middle East Outlook (USD Billion, 2018-2032)

    • Methane by Source
      • Natural
      • Synthetic
    • Methane by Application
      • Fuel
      • Natural Gas
      • Liquefied Natural Gas
      • Liquid-Methane Rocket Fuel
      • Chemical Feedstock
    • Methane by End-User
      • Automotive
      • Aerospace & Defense
    • Africa Outlook (USD Billion, 2018-2032)

    • Methane by Source
      • Natural
      • Synthetic
    • Methane by Application
      • Fuel
      • Natural Gas
      • Liquefied Natural Gas
      • Liquid-Methane Rocket Fuel
      • Chemical Feedstock
    • Methane by End-User
      • Automotive
      • Aerospace & Defense
    • Latin America Outlook (USD Billion, 2018-2032)

    • Methane by Source
      • Natural
      • Synthetic
    • Methane by Application
      • Fuel
      • Natural Gas
      • Liquefied Natural Gas
      • Liquid-Methane Rocket Fuel
      • Chemical Feedstock
    • Methane by End-User
      • Automotive
      • Aerospace & Defense
Infographic

Free Sample Request

Kindly complete the form below to receive a free sample of this Report

Get Free Sample

Customer Strories

“I am very pleased with how market segments have been defined in a relevant way for my purposes (such as "Portable Freezers & refrigerators" and "last-mile"). In general the report is well structured. Thanks very much for your efforts.”

Victoria Milne

Founder

Compare Licence

×
Features License Type
Single User Multiuser License Enterprise User
Price $4,950 $5,950 $7,250
Maximum User Access Limit 1 User Upto 10 Users Unrestricted Access Throughout the Organization
Free Customization
Direct Access to Analyst
Deliverable Format
Platform Access
Discount on Next Purchase 10% 15% 15%
Printable Versions