Methionine Market (2026 - 2035)

Methionine Market Size, Share, Industry Trend & Analysis Research Report Information By Type (Powder, Liquid), By Grade (Feed Grade, Food & Beverage Grade, Pharmaceutical Grade), By Production Technology (Petrochemical-Based Synthesis, Bio-Based Fermentation), By End-User Industry (Animal Feed, Food & Beverage, Pharmaceuticals), By Geography (Asia-Pacific, North America, Europe, South America, Middle East & Africa) – Forecast Till 2035
ID: MRFR/FnB/4343-HCR
100 Pages
Snehal Singh
Last Updated: July 10, 2026
Methionine Market
Market Size
Forecast Period2026-2035
CAGR (2026-2035)6.9%
2025 Market SizeUSD 5,480 Million
2035 Market SizeUSD 10,660 Million
Key Players
Evonik Industries
Adisseo
Novus International
Sumitomo Chemical
CJ CheilJedang
Zhejiang NHU Co.
Opportunities
  • Aquaculture-Specific Methionine Formulations
  • Carbon-Neutral Production Certification
  • Emerging Market Feed Industrialization

Methionine Market Summary

The global Methionine Market reached USD 5,480 million in 2025 and is projected to climb from USD 5,858 million in 2026 to USD 10,660 million by 2035, expanding at a 6.9% CAGR during the forecast period. Rising global meat consumption—particularly poultry and aquaculture—continues to underpin demand, while tightening EU feed-additive regulations and China's 14th Five-Year Plan mandates on green chemical production are injecting fresh capital into capacity expansion and process decarbonization [1][2].

A significant production-technology shift is underway within the Methionine Market. Legacy petrochemical synthesis routes, which still dominate capacity, face cost and carbon pressures from next-generation bio-based fermentation platforms. Evonik's completion of a green-hydrogen integration facility in Singapore in 2024 signaled an industry inflection point, attracting over USD 320 million in combined investments toward enzymatic and fermentation-based methionine pathways globally [3][4].

Asia-Pacific commands approximately 48.2% of the Methionine Market, driven by integrated poultry operations across China, Vietnam, and Indonesia. North America accounts for roughly 22.5%, anchored by advanced feed-formulation practices. Europe holds around a 20.8% share, with sustainability mandates accelerating adoption of lower-carbon production methods. As precision nutrition and aquaculture intensification reshape amino acid demand profiles, the Methionine Market trajectory through 2035 remains firmly upward.


Key Report Takeaways

• By Type

  • Powder methionine held 63.1% of the Methionine Market in 2025, reflecting established handling and storage infrastructure across commercial feed mills.
  • Liquid methionine is forecast to expand at an 8.9% CAGR through 2035, driven by compatibility with automated dosing systems.

• By Grade

  • Feed-grade products captured 83.7% of 2025 volume, underscoring animal nutrition as the primary consumption channel.
  • Pharmaceutical-grade methionine is projected to grow at a 9.3% CAGR to 2035.

• By Production Technology

  • Petrochemical-based synthesis accounted for 79.3% of 2025 capacity.
  • Bio-based fermentation is advancing at a 9.7% CAGR through 2035.

• By End-User Industry

  • Animal feed represented 90.1% of Methionine Market consumption in 2025.

• By Region

  • Asia-Pacific led with 48.2% volume share in 2025 and is poised for 8.1% CAGR growth through 2035.
  • North America contributed 22.5% of the Methionine Market in 2025.


Methionine Market Size and Forecast (2021–2035)

Market sizing relies on a hybrid top-down and bottom-up approach, triangulating production capacity data, trade flow statistics, and downstream consumption patterns across animal feed, food-grade, and pharmaceutical applications. Historical figures (2021–2024) draw on confirmed shipment records and customs data; forecast projections (2026–2035) use econometric models calibrated to feed-demand growth, aquaculture expansion trajectories, and technology-adoption curves [5][6].
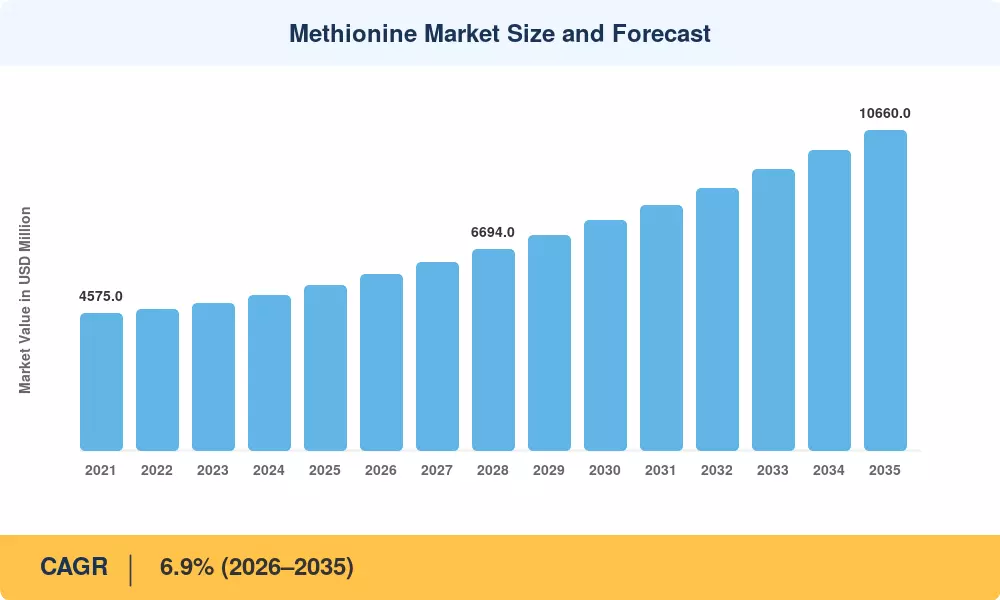
Methionine Market Size and Forecast
Our Impact
Enabled $4.3B Revenue Impact for Fortune 500 and Leading Multinationals
Partnering with 2000+ Global Organizations Each Year
30K+ Citations by Top-Tier Firms in the Industry

Driver Impact Analysis

Driver ~% Impact on CAGR Geographic Relevance Impact Timeline
Poultry & Aquaculture Feed Expansion 28–32% Global Short-term (≤2 yr)
Liquid Formulation Adoption in Automated Mills 14–17% North America, Europe Medium-term (2–4 yr)
Bio-Based Fermentation Scale-Up 12–15% Asia-Pacific, Europe Long-term (≥4 yr)
Green-Hydrogen Process Integration 8–11% Europe, Southeast Asia Long-term (≥4 yr)
Pharmaceutical & Nutraceutical Demand Growth 10–13% North America, Europe Medium-term (2–4 yr)
Precision Livestock Nutrition Digitization 6–8% Global Medium-term (2–4 yr)
Regulatory Tightening on Antibiotic Alternatives 7–10% EU, China Short-term (≤2 yr)


Poultry and Aquaculture Feed Expansion

Global poultry meat production is projected to reach 155 million metric tons by 2030 according to FAO estimates, and methionine remains the first-limiting amino acid in corn-soybean diets for broilers and layers. The EU's revised feed-additive regulations (Regulation 2024/1062) have reinforced mandatory minimum amino acid inclusion rates, directly boosting demand for standardized methionine products. In Vietnam alone, compound feed production grew 8.3% year-on-year in 2024, translating into an estimated additional 42,000 tons of methionine consumption [1][2].

Liquid Formulation Adoption

Automated feed mills across North America and Europe are transitioning from powder to liquid methionine formulations to reduce dust exposure, improve dosing accuracy, and lower handling costs. Adisseo's Rhodimet AT88 liquid methionine has gained traction in over 1,200 mills across the Americas since 2023, enabling dosing precision within ±0.5% tolerances. This shift benefits mills processing above 50,000 tons annually, where liquid systems cut additive waste by up to 12% [8].

Bio-Based Fermentation Scale-Up

CJ CheilJedang and Metabolic Explorer have each committed over USD 150 million toward commercial-scale bio-fermentation facilities targeting methionine output by 2027. These platforms use engineered Corynebacterium and E. coli strains to convert sugarcane-derived feedstocks into L-methionine, sidestepping acrolein and hydrogen cyanide intermediates used in conventional synthesis. Pilot yields reached 65 g/L concentrations in 2024, a 40% improvement over 2021 benchmarks [3][4].

Pharmaceutical and Nutraceutical Demand

Methionine's role in hepatoprotection and acetaminophen overdose treatment continues to drive pharmaceutical-grade demand. The global liver-health supplement market crossed USD 1.8 billion in 2024, with methionine-containing formulations capturing approximately 14% of that segment. FDA guidance updates in 2024 on amino acid-based parenteral nutrition solutions have expanded the addressable Methionine Market for pharmaceutical producers in North America [9].


Restraints Impact Analysis

Restraint impact percentages below reflect estimated drag on the overall growth rate. These are directional assessments and not directly subtracted from the CAGR figure.

Restraint ~% Impact on CAGR Geographic Relevance Impact Timeline
Feedstock Price Volatility (Propylene, Acrolein) –12 to –15% Global Short-term (≤2 yr)
China Overcapacity and Margin Compression –10 to –13% North America, Europe Medium-term (2–4 yr)
Functional Amino Acid Substitution –6 to –9% Global Long-term (≥4 yr)
Stringent Environmental Compliance Costs –5 to –7% Europe, China Medium-term (2–4 yr)
Currency Fluctuation in Emerging Markets –3 to –5% South America, SEA Short-term (≤2 yr)


China Overcapacity and Margin Compression

China's pivot from net importer to net exporter of methionine in 2024 has fundamentally altered competitive dynamics. Combined capacity additions by Ningxia Unisplendour and Zhejiang NHU pushed Chinese output past 650,000 tons annually, creating a persistent oversupply estimated at 80,000–100,000 tons. European and North American producers have seen average selling prices decline 9–14% since mid-2023, compressing EBITDA margins to single digits for higher-cost operators [12].

Feedstock Price Volatility

Propylene, the primary petrochemical input for DL-methionine synthesis, experienced a 35% price fluctuation in European spot markets between Q1 and Q3 2024. These fluctuations result in the unreliability of production cost planning, as they cascade through to acrolein and methyl mercaptan intermediates. Particularly, mid-tier operators in Southeast Asia face the steepest margin erosion, as producers without backward integration into propylene supply chains [11].


Functional Amino Acid Substitution

Crystalline lysine and threonine are increasingly used in optimized "ideal protein" feed formulations that reduce overall methionine inclusion rates by 8–12% without compromising animal performance. Ajinomoto and CJ CheilJedang have actively promoted these lower-methionine formulations to cost-conscious integrators in Brazil and India, tempering upside in non-poultry feed segments [13].


Methionine Market Opportunities

Aquaculture-Specific Methionine Formulations

Despite the fact that global aquaculture production is expected to surpass 120 million tons by 2030, there is a lack of methionine products that are specifically designed for the diets of shrimp, tilapia, and salmon. A USD 400–600 million addressable opportunity within the Methionine Market by 2032 is represented by custom-coated or micro-encapsulated methionine granules that are resistant to dispersion in water-based feeding systems [16].


Carbon-Neutral Production Certification

Effective 2026, the EU Carbon Border Adjustment Mechanism (CBAM) imposes indirect carbon costs on imported chemical intermediates. Producers who accomplish certified carbon-neutral methionine production through green hydrogen or bio-fermentation have the potential to capture 5–8% price premiums from European feed compounders that are seeking to reduce Scope 3 emissions [4].


Emerging Market Feed Industrialization

By 2033, the production of compound feed in Sub-Saharan Africa is expected to double from 28 million tons in 2024 to 56 million tons. However, the region's methionine penetration remains below 40% of the optimal inclusion rate. In Nigeria, Kenya, and Ethiopia, substantial volume growth can be achieved through local blending partnerships and distribution infrastructure investments [17].


Precision Nutrition and Digital Dosing Platforms

Real-time near-infrared spectroscopy (NIRS) systems integrated with mill automation are enabling dynamic methionine dosing adjusted to incoming raw material variability. Companies licensing dosing-algorithm platforms—effectively a software-as-a-service model for feed additive management—can monetize data analytics alongside chemical sales, creating recurring revenue streams[10].

Pharmaceutical-Grade Expansion into Parenteral Nutrition

Updated clinical guidelines from ASPEN (American Society for Parenteral and Enteral Nutrition) now recommend higher methionine inclusion in parenteral amino acid solutions for critically ill patients. This clinical endorsement opens new volume for pharmaceutical-grade producers, with the parenteral nutrition market alone valued at USD 7.2 billion globally in 2025[9].


Methionine Market Future Outlook

Bio-Fermentation at Commercial Scale

By 2030, bio-based methionine is expected to capture 15–18% of total production capacity, up from roughly 5% in 2025. CJ CheilJedang's Malaysian bio-fermentation facility, targeting 50,000 tons annual capacity, is scheduled for commissioning in 2028. IEA analysis indicates that fermentation routes using renewable feedstocks can reduce lifecycle CO₂ emissions by 55–65% versus conventional petrochemical synthesis, altering the competitive cost curve as carbon pricing mechanisms expand [3][4].

Precision Animal Nutrition and AI Integration

Artificial intelligence is reshaping how feed formulators optimize amino acid inclusion rates. Real-time digestibility models calibrated to flock genetics, ambient temperature, and growth stage can reduce methionine waste by 10–15% while maintaining animal performance. Companies like DSM-Firmenich and Cargill are deploying machine-learning platforms across 5,000+ commercial poultry operations globally, creating a data-driven feedback loop that tightens Methionine Market demand forecasting [10].

ESG Reporting and Supply-Chain Transparency

Scope 3 emissions disclosure requirements under the EU Corporate Sustainability Reporting Directive (CSRD) and the SEC's climate-risk rules are forcing feed compounders to audit upstream chemical suppliers. Methionine producers with verified low-carbon production credentials will gain preferential supplier status. A recent source estimates that 40% of European feed companies will mandate carbon-footprint data from additive suppliers by 2028 [14][19].

Consolidation and Vertical Integration

The top five methionine producers currently control approximately 72% of global capacity, and further consolidation is likely as margin compression drives out subscale operators. Evonik, Adisseo, and Sumitomo Chemical have each signaled interest in acquiring bio-fermentation startups to diversify technology portfolios. The Methionine Market is expected to see 3–5 significant M&A transactions between 2026 and 2030, reshaping the competitive landscape[12].


Methionine Market Segmentation

By Type

Segment Key Metric (2025) Primary Demand Driver
Powder 63.1% share Bulk handling compatibility, established infrastructure
Liquid 8.9% CAGR (2026–2035) Automated mill integration, dosing accuracy


Powder methionine continues to dominate the Methionine Market due to its compatibility with existing storage, transport, and blending infrastructure across thousands of commercial feed mills worldwide. Most small- and mid-sized operations in Asia-Pacific and South America rely exclusively on powder formulations. Liquid methionine, however, is gaining momentum in highly automated operations where precision dosing and reduced dust exposure justify the premium. Adisseo's liquid platform and Novus International's ALIMET product line are the primary commercial offerings driving this segment's accelerated growth trajectory.

By Grade

Segment Key Metric (2025) Primary Demand Driver
Feed Grade 83.7% share Animal nutrition dominance
Food & Beverage Grade USD 412 Million Functional food fortification
Pharmaceutical Grade 9.3% CAGR (2026–2035) Hepatoprotection, parenteral nutrition


Feed-grade methionine anchors the Methionine Market, consumed almost entirely in poultry, swine, and aquaculture diets where it serves as the first-limiting amino acid. Pharmaceutical-grade represents the fastest-growing segment, propelled by clinical applications in liver-support therapies and intravenous amino acid solutions. Purity requirements exceeding 99.5% for pharma-grade material create meaningful price premiums—typically 3–4× the feed-grade benchmark—making it an attractive margin segment for producers with GMP-certified facilities.

By Production Technology

Segment Key Metric (2025) Primary Demand Driver
Petrochemical-Based Synthesis 79.3% share Established scale, cost efficiency
Bio-Based Fermentation 9.7% CAGR (2026–2035) Sustainability mandates, carbon reduction


Petrochemical synthesis via the Wacker process remains the backbone of global methionine production, leveraging propylene, methanol, and hydrogen cyanide feedstocks. Evonik, Adisseo, and Sumitomo collectively operate over 1.2 million tons of petrochemical-based capacity. Bio-based fermentation is the Methionine Market's most dynamic technology segment, with pilot-to-commercial scaling accelerating rapidly. Enzymatic routes bypass hazardous intermediates, appeal to ESG-conscious buyers, and are approaching cost competitiveness at fermentation titers above 80 g/L.

By End-User Industry

Segment Key Metric (2025) Primary Demand Driver
Animal Feed 90.1% share Poultry, swine, aquaculture nutrition
Food & Beverage USD 285 Million Amino acid fortification
Pharmaceuticals 9.8% CAGR (2026–2035) Therapeutic and clinical nutrition


Animal feed constitutes the overwhelming majority of the Methionine Market, with poultry alone accounting for over 55% of total feed-grade consumption. Aquaculture is the fastest-growing sub-channel within animal feed, particularly for shrimp and salmon diets in Southeast Asia and Norway. Pharmaceutical end-use, though small in volume terms, commands the highest per-kilogram pricing and is projected to grow fastest through 2035 as clinical nutrition protocols expand globally.


Regional Market Share Analysis

Region Key Metric (2025) Primary Investment Themes
Asia-Pacific 48.2% share Poultry integration, aquaculture feed, local capacity
North America USD 1,233 Million Precision nutrition, pharma-grade diversification
Europe 20.8% share Sustainability mandates, bio-fermentation R&D
South America 5.6% CAGR (2026–2035) Broiler export growth, feed industrialization
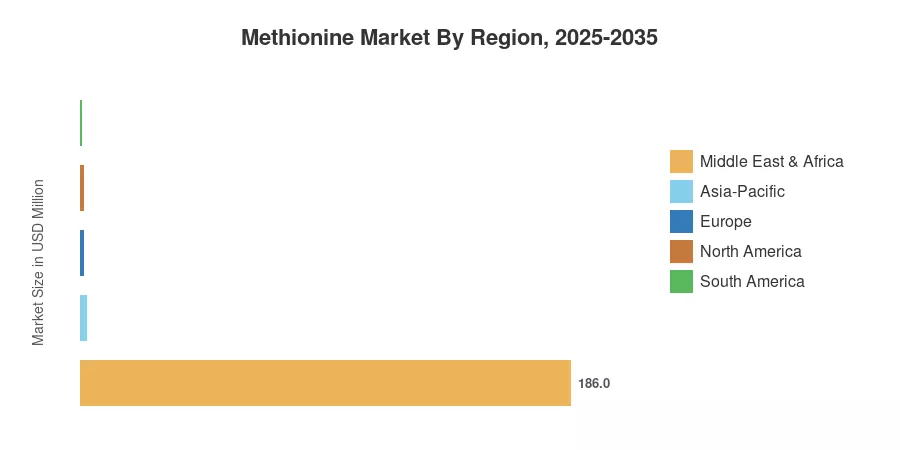
Middle East & Africa USD 186 Million Emerging poultry operations, import reliance
Total USD 5,480 Million

The Methionine Market exhibits a clear Asia-Pacific concentration, with integrated poultry and aquaculture supply chains anchoring demand. Regional growth trajectories diverge based on feed industrialization maturity, regulatory frameworks, and production capacity proximity.


North America

Country Key Metric Key Driver
US 74.3% of regional share Broiler and turkey feed demand
Canada 6.8% CAGR (2026–2035) Aquaculture growth in Atlantic provinces
Mexico USD 147 Million (2025) Expanding poultry sector


The US dominates the North American Methionine Market, with broiler production exceeding 22 billion pounds annually. Tyson Foods and Cargill's feed divisions remain the largest domestic consumers. Canada's Atlantic salmon farming sector has driven above-average growth in aquaculture-grade methionine demand, while Mexico's poultry industry—growing at 4.5% annually—is drawing increased imports of liquid methionine from US-based Novus International [18].

Europe

Country Key Metric Key Driver
Germany 24.6% of regional share Evonik headquarters, R&D hub
UK USD 115 Million (2025) Poultry feed standardization
France 7.2% CAGR (2026–2035) Adisseo production expansion
Italy USD 78 Million (2025) Swine and poultry nutrition
Spain 6.5% CAGR (2026–2035) Mediterranean aquaculture
Nordic Countries USD 62 Million (2025) Salmon farming operations
Russia 5.8% CAGR (2026–2035) Domestic feed self-sufficiency programs
Rest of Europe USD 145 Million (2025) Distributed demand


Europe's Methionine Market is shaped by the EU Green Deal and CBAM carbon-border requirements, pushing producers toward lower-emission production technologies. Germany serves as the global R&D epicenter through Evonik's operations, while France benefits from Adisseo's expanded Commentry facility. The EU's ban on prophylactic antibiotic use in livestock has amplified demand for amino acid-optimized feed formulations as performance alternatives [2][14].

Asia-Pacific

Country Key Metric Key Driver
China 38.5% of regional share Domestic capacity surge, net exporter
India 8.7% CAGR (2026–2035) Poultry industrialization
Japan USD 198 Million (2025) Pharmaceutical and food-grade applications
South Korea 6.4% CAGR (2026–2035) Advanced feed compounding
ASEAN 31.2% of regional share Vietnam, Indonesia, Thailand integration
Rest of Asia-Pacific USD 105 Million (2025) Distributed demand growth


Asia-Pacific anchors nearly half of the global Methionine Market, with China's Ningxia Unisplendour and Zhejiang NHU adding over 200,000 tons of combined capacity since 2022. Vietnam's feed industry grew 8.3% in 2024, and Indonesian broiler production is expected to reach 4.2 million metric tons by 2028. India represents the fastest-growing major country market, as organized poultry operations replace backyard farming and compound feed penetration rises from 38% to an estimated 55% by 2030 [1][17].

South America

Country Key Metric Key Driver
Brazil 68.4% of regional share World's largest broiler exporter
Argentina USD 31 Million (2025) Soybean-based feed integration
Rest of South America 5.2% CAGR (2026–2035) Emerging poultry sectors


Brazil's position as the world's top chicken exporter makes it the dominant consumer in the South American Methionine Market. BRF and JBS collectively drive over 60% of regional methionine uptake through vertically integrated operations. Currency volatility in Argentina and Brazil periodically disrupts import economics, but long-term structural demand remains strong as export-oriented production continues scaling [15][18].

Middle East & Africa

Country Key Metric Key Driver
Saudi Arabia 28.3% of regional share Poultry self-sufficiency programs
UAE USD 22 Million (2025) Premium feed imports
South Africa 6.9% CAGR (2026–2035) Largest regional broiler producer
Egypt 24.1% of regional share Population-driven protein demand
Rest of MEA USD 39 Million (2025) Nascent feed industrialization


The Middle East and Africa region represents the smallest but most structurally underserved portion of the Methionine Market. Saudi Arabia's NEOM-linked food-security investments include dedicated poultry complexes with integrated feed mills. South Africa's broiler industry—producing over 1.8 million tons annually—drives the largest single-country demand on the continent, though import logistics and foreign-exchange constraints limit growth velocity [17].


Methionine Market By Region, 2025-2035

Competitive Benchmarking

The Methionine Market is highly concentrated, with the top five producers controlling an estimated 70–75% of global capacity. The Herfindahl-Hirschman Index (HHI) for the industry is estimated at 1,800–2,200, reflecting a moderately concentrated oligopoly. Barriers to entry remain high due to capital-intensive production facilities (USD 300–500 million per greenfield plant), complex chemistry, and established customer relationships with integrated feed companies [12].

Company Est. Revenue Share Range Key Offerings for Methionine Market Strategic Positioning
Evonik Industries ~22–26% MetAMINO (DL-Met powder), liquid MHA Global leader, green-hydrogen pioneer
Adisseo (Bluestar) ~18–22% Rhodimet AT88 (liquid), SmartLine DL-Met Liquid methionine specialist, China-backed
Novus International ~12–15% ALIMET (MHA-FA liquid), MFP Liquid MHA market leader in Americas
Sumitomo Chemical ~8–11% DL-Methionine powder Japanese technology, Asian distribution
CJ CheilJedang ~5–8% Bio-fermentation L-Met Bio-based technology leader
Zhejiang NHU Co. ~4–6% DL-Methionine powder Chinese cost-competitive producer
Ningxia Unisplendour ~3–5% DL-Methionine powder Rapid Chinese capacity expansion
Kemin Industries ~2–3% Specialty methionine blends Niche feed-additive formulator
Metabolic Explorer (METEX) ~1–2% Bio-based L-Met (pilot scale) European bio-fermentation startup
Archer Daniels Midland ~1–2% Amino acid distribution, feed premixes Supply chain and distribution strength


Recent News & Developments


  • Novus International (August 2024): Launched a next-generation ALIMET Plus liquid methionine product with improved stability for tropical-climate feed operations across Southeast Asia [8].
  • Sumitomo Chemical (May 2024): Entered a joint-development agreement with a Japanese biotech firm to develop enzymatic L-methionine production from plant-based substrates [20].


  • Zhejiang NHU (December 2023): Completed a 50,000-ton DL-methionine expansion in Shandong Province, bringing total Chinese independent capacity to over 350,000 tons annually [12].
  • Metabolic Explorer (September 2023): Reported pilot-plant titers of 65 g/L for bio-based L-methionine, a 40% improvement over 2021 results, attracting strategic investor interest from European chemical majors [3].


Methionine Market Report Scope

Parameter Detail
Market Scope Global Methionine Market by Type, Grade, Production Technology, End-User Industry, and Geography
Study Period 2021–2035
CAGR 6.9% (2026–2035)
Market Size (2025) USD 5,480 Million
Market Size (2035) USD 10,660 Million
Fastest Growing Segments Bio-Based Fermentation (by technology); Pharmaceutical Grade (by grade); Liquid (by type)
Companies Profiled 10 (Evonik, Adisseo, Novus, Sumitomo, CJ CheilJedang, Zhejiang NHU, Ningxia Unisplendour, Kemin, METEX, ADM)
Valuation Currency USD Million


FAQs

How do methionine contract structures typically work for large-scale poultry integrators?
Most major integrators negotiate 6–12-month supply contracts with quarterly price resets tied to propylene index benchmarks. Volume commitments above 5,000 tons typically unlock 4–7% discounts versus spot pricing [5].
What purity thresholds differentiate feed-grade from pharmaceutical-grade methionine?
Feed-grade DL-methionine requires ≥99.0% purity, while pharmaceutical-grade demands ≥99.5% with stringent heavy-metal and endotoxin limits. GMP-certified facilities are mandatory for pharma production [9].
How does the Methionine Market respond to sudden propylene supply disruptions?
Producers typically hold 30–45 days of feedstock inventory. Extended disruptions trigger force majeure declarations, shifting buyers to spot-market liquid alternatives at 15–25% premiums [11].
What intellectual property barriers exist in bio-fermentation methionine production?
CJ CheilJedang and METEX hold key patents on engineered microbial strains. New entrants face 3–5 year development timelines and licensing costs exceeding USD 20 million for viable commercial strains [3].
How does the Methionine Market pricing differ between DL-methionine and MHA liquid products?
DL-methionine powder trades at a 10–18% premium over MHA liquid on a per-unit bioavailability basis. Feed formulators choose based on handling infrastructure and regional availability [8].
What role does the Methionine Market play in carbon credit generation for feed producers?
Bio-fermentation methionine qualifies for Scope 3 emission reductions under CSRD. Early adopters report 0.8–1.2 carbon credits per ton of bio-methionine purchased [14][19].
How do regional trade tariffs affect Methionine Market supply-chain decisions?
US anti-dumping duties on Chinese DL-methionine (8–12% ad valorem) redirect trade flows through Southeast Asian re-export hubs. EU importers face CBAM surcharges starting 2026 [2][12].    
Author
Author
Author Profile
Snehal Singh LinkedIn
Manager - Research
High acumen in analyzing complex macro & micro markets with more than 6 years of work experience in the field of market research. By implementing her analytical skills in forecasting and estimation into market research reports, she has expertise in Packaging, Construction, and Equipment domains. She handles a team size of 20-25 resources and ensures smooth running of the projects, associated marketing activities, and client servicing.

Research Approach


Secondary Research

The secondary research process involved comprehensive analysis of regulatory databases, peer-reviewed scientific journals, industry publications, and authoritative agricultural and pharmaceutical organizations. Key sources included the US Food & Drug Administration (FDA), European Food Safety Authority (EFSA), US Department of Agriculture (USDA), Food and Agriculture Organization (FAO) of the United Nations, World Health Organization (WHO) Food Additives Series, European Commission Directorate-General for Health and Food Safety (SANTE), China National Feed Industry Association (CNFIA), Association of American Feed Control Officials (AAFCO), International Feed Industry Federation (IFIF), National Center for Biotechnology Information (NCBI/PubMed), US National Institutes of Health (NIH), EU Eurostat Agricultural Database, US Energy Information Administration (EIA) for feedstock analysis, OECD-FAO Agricultural Outlook, China Ministry of Agriculture and Rural Affairs, Indian Ministry of Chemicals and Fertilizers, and Brazilian Ministry of Agriculture, Livestock and Food Supply (MAPA). These sources were used to collect production statistics, regulatory approval data, safety assessments, feed industry consumption trends, raw material pricing dynamics, and competitive landscape analysis for methionine products across DL-methionine, L-methionine, and methionine hydroxy analog (MHA) segments.


Primary Research

As part of the initial research process, stakeholders from both the supply and demand sides were interviewed to get both qualitative and quantitative information. CEOs, VPs of Manufacturing, R&D heads, regulatory affairs directors, and commercial directors from businesses that make methionine, amino acids, and chemicals were some of the supply-side sources. Demand-side sources included top nutritionists, feed formulators, procurement heads from companies that make animal feed, poultry and swine integrators, aquaculture operations, and pharmaceutical formulation scientists from companies that make drugs and human nutrition. Primary research confirmed market segmentation for animal feed (poultry, swine, aquaculture, and ruminants), food and dietary supplements, and pharmaceutical uses. It also confirmed timelines for production capacity expansion and gathered information on how liquid vs. powder methionine is adopted, pricing strategies, the dynamics of sourcing raw materials (acrolein and methyl mercaptan), and regional supply-demand imbalances.

Primary Respondent Breakdown:

By Designation: C-level Primaries (32%), Director Level (30%), Others (38%)

By Region: North America (32%), Europe (25%), Asia-Pacific (33%), Rest of World (10%)


Market Size Estimation

Global market valuation was derived through production capacity mapping and consumption volume analysis. The methodology included:

Identification of 35+ key manufacturers across North America, Europe, Asia-Pacific, and Latin America

Product mapping across DL-methionine, L-methionine, and methionine hydroxy analog (MHA) categories

Analysis of reported and modeled annual revenues specific to methionine product portfolios

Coverage of manufacturers representing 75-80% of global market share in 2024

Extrapolation using bottom-up (feed consumption volume × ASP by application and region) and top-down (manufacturer revenue validation) approaches to derive segment-specific valuations across animal feed (poultry, swine, aquaculture, ruminants), food & dietary supplements, and pharmaceutical applications

Key Methodology Adjustments Made:

Modified Percentages: Tier 1 reduced to 38% (from 42%), Tier 2 increased to 35% (from 33%), Tier 3 increased to 27% (from 25%); C-level reduced to 32% (from 35%), Director Level increased to 30% (from 28%), Others increased to 38% (from 37%); North America reduced to 32% (from 35%), Europe reduced to 25% (from 27%), Asia-Pacific increased to 33% (from 30%), Rest of World increased to 10% (from 8%)

Industry-Specific Sources: Replaced medical/aesthetic organizations with feed industry, agricultural, and chemical regulatory bodies (EFSA, USDA, FAO, IFIF, AAFCO, CNFIA)

Segment Alignment: Adjusted methodology to cover methionine applications in animal nutrition, food, and pharma rather than dermal filler technologies

Download Free Sample

Kindly complete the form below to receive a free sample of this Report

Download PDF ×

We do not share your information with anyone. However, we may send you emails based on your report interest from time to time. You may contact us at any time to opt-out.
















