Microscopy Devices Market (2026 - 2035)

Microscopy Devices Market Research Report Information, By Type (Microscopes, Accessories, and Software), By Product (Optical Microscopes, Electron Microscopes, Scanning Probe Microscopes, and Others), By Application (Semiconductors, Life Sciences, Materials Science, and Others), By End-users (Hospitals & Clinics, and Academic & Research Institutes), And By Region (North America, Europe, Asia-Pacific, And Rest Of The World) –Market Forecast Till 2035
ID: MRFR/MED/1698-HCR
80 Pages
Satyendra Maurya, Rahul Gotadki
Last Updated: July 08, 2026
Microscopy Devices Market
Market Size
Forecast Period2026-2035
CAGR (2026-2035)6.22%
2025 Market SizeUSD 10.89 Billion
2035 Market SizeUSD 19.92 Billion
Key Players
Carl Zeiss AG
Thermo Fisher Scientific
Leica Microsystems
Nikon Corporation
Evident
JEOL Ltd.
Opportunities
  • Cloud-Connected Microscopy and Remote Collaboration
  • Emerging-Market Academic Infrastructure Build-Out
  • Data Monetization Through AI-Ready Imaging Pipelines

Microscopy Devices Market Summary

The Microscopy Devices Market size was valued at USD 10.89 Billion in 2025, and the market is projected to grow from USD 11.57 Billion in 2026 to USD 19.92 Billion by 2035, registering a CAGR of 6.22% during the forecast period 2026–2035. Two structural forces are shaping this trajectory: semiconductor fabrication roadmaps that require sub-nanometer metrology for gate-all-around transistor architectures, and the accelerating shift toward AI-driven pathology workflows in hospital and reference laboratory settings [1][2]. Rising government allocations for life-science infrastructure across the United States, China, and the European Union have reinforced demand for advanced imaging platforms at academic and clinical institutions alike.

A technology generational change is underway across the Microscopy Devices Market. Conventional benchtop optical systems — still the largest installed base — are being augmented by desktop cryogenic electron microscopy platforms priced for mid-tier research institutions, bringing structure-based drug discovery capabilities that were once confined to a handful of national laboratories [3]. The U.S. National Institutes of Health allocated over USD 1.2 billion toward biomedical imaging infrastructure between 2022 and 2024, and the EU Horizon Europe programme committed EUR 950 million to nanoscale research instrumentation through 2027 [4][5].

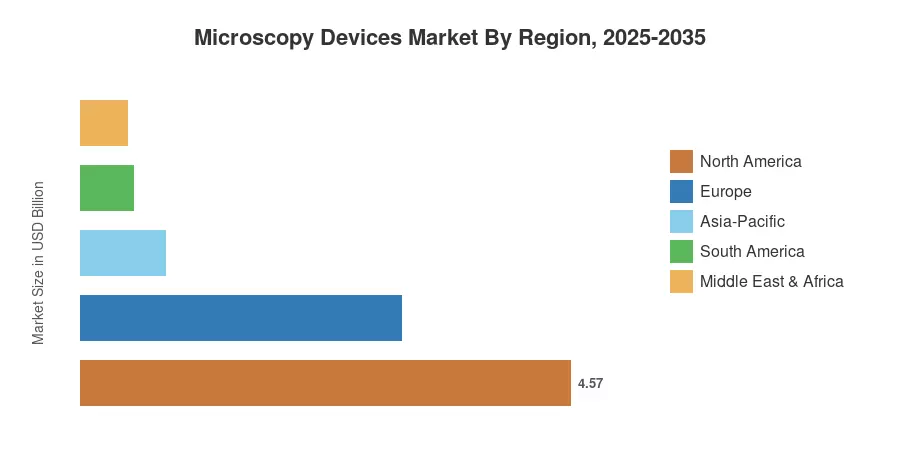
North America held approximately 42.0% of Microscopy Devices Market revenue in 2025, anchored by federal research funding and a dense network of pharmaceutical R&D centres. Asia-Pacific is the fastest-growing region, forecast to register a CAGR of 7.21% through 2035, propelled by semiconductor fab expansion in South Korea, Japan, and China. Europe accounted for the second-largest share at roughly 27.5%, driven by strong academic research traditions in Germany, the UK, and France. As AI-augmented imaging software matures and instrument price points continue to decline, the Microscopy Devices Market is positioned for broad-based geographic expansion over the coming decade.


Key Report Takeaways

• By Microscopy Type

  • Optical microscopy accounted for an estimated 44.7% revenue share of the Microscopy Devices Market in 2025, sustained by clinical diagnostics and educational laboratory demand.
  • Scanning probe microscopy is projected to grow at a CAGR of 6.48% through 2035, driven by nanoscale materials characterization requirements.

• By Application

  • Life science applications represented approximately 36.5% of Microscopy Devices Market revenue in 2025.
  • Nanotechnology research is forecast to register a 7.05% CAGR during the study period, reflecting increased government funding for nanomaterials development.

• By End User

  • Academic and research institutes captured around 41.1% of Microscopy Devices Market revenue in 2025.
  • Hospitals, clinics, and diagnostic laboratories are expected to post a CAGR of 7.06% through 2035, the fastest among end-user segments.

• By Region

  • North America led the Microscopy Devices Market with a 42.0% share in 2025.
  • Asia-Pacific is projected to expand at a 7.21% CAGR through 2035, fuelled by semiconductor industry growth and rising research budgets.


Market Size and Forecast (2021–2035)

Market Research Future's estimates draw on a triangulated methodology combining vendor revenue disclosures, end-user procurement data, import–export databases, and primary interviews with laboratory directors, procurement officers, and OEM sales executives across 28 countries. Historical figures are validated against published annual reports and customs data; forecast values are modelled using bottom-up segment build-ups cross-checked with top-down macroeconomic indicators.
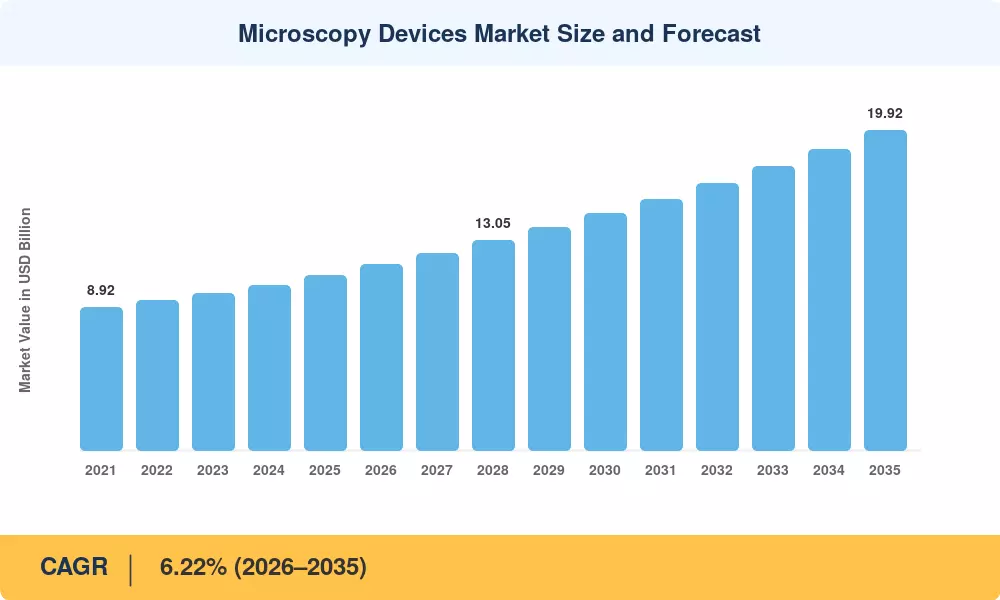
Microscopy Devices Market Size and Forecast
Our Impact
Enabled $4.3B Revenue Impact for Fortune 500 and Leading Multinationals
Partnering with 2000+ Global Organizations Each Year
30K+ Citations by Top-Tier Firms in the Industry

Driver Impact Analysis

Driver ~% Impact on CAGR Geographic Relevance Impact Timeline
Semiconductor node shrinkage below 3 nm ~18% Global (US, South Korea, Japan, EU) Medium-term (2–4 yr)
AI-augmented pathology and slide analysis ~16% North America, Europe Short-term (≤2 yr)
Cryo-EM cost reduction and democratization ~14% Global Medium-term (2–4 yr)
Government life-science infrastructure grants ~13% US, EU, China Long-term (≥4 yr)
Expansion of clinical genomics and proteomics ~12% North America, Asia-Pacific Medium-term (2–4 yr)
Growth in nanotechnology materials research ~10% Asia-Pacific, Europe Long-term (≥4 yr)
Digital pathology regulatory approvals ~9% US, EU, Japan Short-term (≤2 yr)


Semiconductor Node Shrinkage

Gate-all-around transistor designs at the 2 nm and sub-2 nm nodes necessitate high-resolution metrology capable of photographing features less than 0.5 nm. Samsung, TSMC, and Intel have jointly allocated more than USD 280 billion in fab capital spending through 2028, with a significant portion going into sophisticated inspection and characterization equipment [2]. This expenditure cascade directly benefits the Microscopy Devices Market since each new process node adds to the number of critical-dimension measurement steps in the manufacturing flow. Transmission electron microscopy and sophisticated scanning systems have become non-negotiable line items in fab procurement budgets.


AI-Augmented Pathology

Since the FDA authorized Paige, regulatory certifications for AI-assisted slide reading have increased. AI systems for detecting prostate cancer in 2022 [15]. Hospitals across the United States are implementing whole-slide imaging technologies with machine-learning classifiers to cut pathologist turnaround times by 30-40% [8]. The Microscopy Devices Market benefits from this transition because every AI-pathology deployment necessitates the use of a high-throughput digital scanner, resulting in a hardware refresh cycle that runs parallel to the usual replacement demand curve.


Cryo-EM Democratization

Desktop and compact cryogenic electron microscopy systems, priced 40–60% below their floor-model predecessors, are opening structural biology to hundreds of universities and contract research organizations that previously lacked access [3]. The U.S. NSF invested USD 75 million in shared cryo-EM centres between 2021 and 2024, and the Japan Society for the Promotion of Science funded 12 regional cryo-EM hubs under its Core-to-Core programme [9]. These installations create recurring revenue streams in sample preparation kits, detectors, and software licences that amplify hardware demand across the Microscopy Devices Market.

Government Life-Science Grants

Sustained public-sector investment in biological and biomedical research remains a reliable demand anchor. The U.S. NIH fiscal year 2024 budget allocated USD 48.6 billion, with approximately 2.5% earmarked for major research instrumentation grants that include microscopy systems [4]. The European Research Council similarly committed EUR 16 billion under Horizon Europe's Pillar I, a portion of which flows directly into imaging-equipment procurement across the Microscopy Devices Market [5].


Restraints Impact Analysis

Restraint ~% Drag on CAGR Geographic Relevance Impact Timeline
High instrument acquisition and maintenance costs ~–22% Global (esp. emerging markets) Long-term (≥4 yr)
Shortage of trained microscopists and service engineers ~–18% Asia-Pacific, South America, MEA Medium-term (2–4 yr)
Long procurement and regulatory approval cycles ~–15% EU, Japan Short-term (≤2 yr)
Data management and storage burden from high-resolution imaging ~–12% North America, Europe Medium-term (2–4 yr)
Trade restrictions on advanced optical and electron-beam components ~–10% US–China corridor Short-term (≤2 yr)


High Instrument Acquisition Costs

A fully configured transmission electron microscope can cost between USD 2 million and USD 7 million, but modern confocal platforms frequently reach USD 500,000. For mid-tier colleges in Southeast Asia, Latin America, and Sub-Saharan Africa, these costs limit adoption to shared national facilities rather than departmental installations [16]. Service contracts that cost 8-12% of the system price per year add to the budgetary burden, limiting the Microscopy Devices Market's adoption in price-sensitive countries.


Skilled Personnel Shortage

Operating, maintaining, and interpreting results from sophisticated microscope devices necessitates specialized training, which many markets lack. According to a 2023 Royal Microscopical Society poll, 58% of European core-facility directors reported difficulty employing electron-microscopy operators, which is a bottleneck that slows instrument usage and increases payback timeframes [17]. The Microscopy Devices Market's growth trajectory is thus dependent on workforce development timetables.


Lengthy Procurement Cycles

Public-sector procurement for capital-intensive laboratory equipment typically spans 12–24 months in the EU and Japan, constrained by multi-stage tendering, technical evaluation, and import-licensing requirements [18]. These delays compress the effective selling window for vendors and create lumpy demand patterns that complicate production planning across the Microscopy Devices Market.


Microscopy Devices Market Opportunities

Cloud-Connected Microscopy and Remote Collaboration

Cloud-based instrument control and image-sharing platforms allow geographically dispersed research teams to operate a single high-value microscope remotely, increasing utilization rates from the industry average of 35% to above 65% [12]. Vendors that offer subscription-based remote access modules can capture recurring software revenue while expanding the Microscopy Devices Market's addressable user base beyond physical lab boundaries.

Emerging-Market Academic Infrastructure Build-Out

India's National Education Policy 2020 targets a doubling of gross enrolment in STEM disciplines by 2035, and Brazil's FAPESP has committed BRL 3.2 billion to research infrastructure through 2030 [10]. Both programmes require modern microscopy facilities at hundreds of new and upgraded campuses, creating a sizable greenfield opportunity for the Microscopy Devices Market in price-sensitive tiers.

Data Monetization Through AI-Ready Imaging Pipelines

The explosion of high-resolution imaging data creates a parallel opportunity in analytics-as-a-service. Vendors that embed AI inference engines and standardized metadata schemas into their platforms can offer downstream insights — cell-count quantification, defect classification, particle-size distribution — as value-added data products [8][12]. This model shifts the Microscopy Devices Market's revenue mix toward higher-margin software layers.

Point-of-Care and Field-Portable Microscopy

Miniaturized, smartphone-coupled optical microscopes are gaining traction in malaria diagnostics across Sub-Saharan Africa and water-quality monitoring in rural Southeast Asia [20]. Though unit values are low, cumulative volumes and consumable attach rates present a meaningful volume-driven opportunity for the Microscopy Devices Market, especially as WHO prequalification pathways for digital-microscopy devices mature.

Correlative and Multi-Modal Imaging Platforms

Research workflows increasingly demand correlative light-electron microscopy that seamlessly overlays fluorescence data onto ultrastructural images. Instruments combining multiple modalities in a single platform can command 25–40% price premiums over standalone systems, creating a high-value niche within the Microscopy Devices Market.


Microscopy Devices Market Future Outlook

AI-Integrated Autonomous Microscopy

Machine-learning algorithms are transitioning from post-acquisition image analysis to real-time instrument control, enabling self-driving microscopes that autonomously adjust focus, stage position, and detector parameters. By 2030, an estimated 35% of newly shipped electron and scanning probe systems will embed on-instrument AI inference chips, reducing operator dependency and boosting throughput [8]. The Microscopy Devices Market will increasingly differentiate on software intelligence rather than hardware optics alone.

Platform Economics and Recurring Revenue

Vendors are shifting from one-time capital-equipment sales toward platform models that bundle hardware leases, cloud analytics, reagent subscriptions, and remote-service contracts. Danaher's Leica Microsystems division has already demonstrated that service and consumable revenue can represent 45–50% of total segment revenue, a ratio that other major players are targeting [11]. This structural shift will moderate the Microscopy Devices Market's cyclicality and lift long-term margins.

Sustainability and Green Laboratory Initiatives

Energy consumption of high-vacuum electron microscopes — which can draw 15–30 kW continuously — is coming under scrutiny as institutions pursue Scope 2 emissions reductions. Instrument manufacturers are responding with variable-vacuum architectures and power-management firmware that cut idle consumption by up to 40% [24]. ESG reporting mandates in the EU and California will accelerate procurement preferences toward energy-efficient designs across the Microscopy Devices Market.

Quantum Sensing and Next-Generation Probes

Nitrogen-vacancy centre magnetometry and other quantum-sensing modalities promise sub-angstrom spatial resolution without the extreme sample-preparation requirements of electron microscopy. While still pre-commercial for most applications, early-stage investments exceeding USD 500 million globally since 2022 suggest these technologies could create a disruptive new segment within the Microscopy Devices Market by the early 2030s [25].


Microscopy Devices Market Segmentation

By Microscopy Type

Segment Key Metric Primary Demand Driver
Optical Microscopy 44.7% share (2025) Clinical diagnostics and educational laboratory volumes
Electron Microscopy CAGR 7.02% (2026–2035) Semiconductor metrology and structural biology
Scanning Probe Microscopy USD 1.14 Billion (2025) Nanomaterials characterization and surface analysis
Other Technologies CAGR 5.85% (2026–2035) Acoustic, X-ray, and ion-beam imaging niches


Optical microscopy maintains the largest share of the Microscopy Devices Market because of its ubiquity across hospital pathology departments, university teaching labs, and quality-control environments. Systems range from sub-USD 5,000 educational models to USD 800,000 super-resolution platforms, giving optical vendors the broadest addressable buyer population. Clinical diagnostic volumes — particularly in histopathology, cytology, and haematology — create a replacement-driven demand floor that is relatively insensitive to research-funding cycles.

Electron microscopy is the growth engine within the Microscopy Devices Market, propelled by dual demand from semiconductor fabs requiring angstrom-level defect inspection and pharmaceutical companies leveraging cryo-EM for structure-based drug design. The installed base of cryo-EM systems has grown from approximately 400 units worldwide in 2019 to an estimated 900 by 2025, and further cost reductions are expected to push annual shipments above 200 units by 2030 [3].

By Application

Segment Key Metric Primary Demand Driver
Life Science 36.5% share (2025) Pharmaceutical R&D; clinical pathology
Semiconductor & Electronics USD 2.72 Billion (2025) Process node shrinkage; defect inspection
Nanotechnology Research CAGR 7.05% (2026–2035) Government nano-mission grants
Other Applications 11.3% share (2025) Materials science, geology, forensics


Life science remains the anchor application of the Microscopy Devices Market, spanning drug discovery, histopathology, cell biology, and neuroscience. Pharmaceutical companies routinely deploy confocal, multiphoton, and super-resolution systems in target-identification pipelines, while hospital pathology departments drive the high-throughput slide-scanner segment. The semiconductor and electronics sector represents the fastest-growing dollar pool, with each successive sub-3 nm process node requiring additional metrology insertion points that directly expand instrument demand.

By End User

Segment Key Metric Primary Demand Driver
Academic & Research Institutes 41.1% share (2025) Government grants; core-facility mandates
Hospitals, Clinics & Diagnostic Labs CAGR 7.06% (2026–2035) Digital pathology adoption; point-of-care diagnostics
Pharmaceutical & Biotech Companies USD 2.38 Billion (2025) Drug discovery; quality control
Industrial & Semiconductor Manufacturers 12.4% share (2025) In-line inspection; failure analysis


Academic and research institutes command the largest end-user share of the Microscopy Devices Market because universities and national laboratories concentrate high-value instruments — including cryo-EM, FIB-SEM, and scanning probe systems — in shared core facilities funded through multi-year grants. Hospitals and diagnostic laboratories represent the fastest-growing end-user segment, as regulatory approvals for whole-slide imaging and AI-assisted diagnostics unlock a conversion cycle from manual to digital microscopy workflows.


Regional Market Share Analysis

Region Key Metric Primary Investment Themes
North America 42.0% share (2025) Federal R&D grants; pharmaceutical imaging; fab metrology
Europe 27.5% share (2025) Horizon Europe instrumentation; automotive materials R&D
Asia-Pacific 7.21% CAGR (2026–2035) Semiconductor fab expansion; life-science infrastructure
South America USD 0.49 Billion (2025) University modernization; agricultural nanotechnology
Middle East & Africa USD 0.44 Billion (2025) Clinical diagnostics; mining and geology applications
Total USD 10.89 Billion (2025)

The Microscopy Devices Market exhibits distinct regional dynamics shaped by R&D funding intensity, semiconductor fabrication footprints, and healthcare infrastructure maturity.


North America

Country Key Metric Key Driver
United States 78.5% of regional share NIH / NSF instrumentation grants; pharma R&D
Canada 12.3% of regional share NRC national microscopy centres
Mexico CAGR 5.85% (2026–2035) Automotive and electronics manufacturing growth


The United States remains the gravitational centre of the Microscopy Devices Market in North America, supported by NIH's sustained budget above USD 47 billion annually and the CHIPS and Science Act's allocation of USD 52.7 billion for domestic semiconductor manufacturing and research [4][21]. Canada's National Research Council operates a network of electron-microscopy facilities that serve both academic and industrial clients, while Mexico's expanding automotive electronics sector is generating incremental demand for quality-control inspection systems.

Europe

Country Key Metric Key Driver
Germany 28.4% of regional share Max Planck and Fraunhofer lab networks
United Kingdom 21.6% of regional share UKRI life-science funding
France CAGR 5.92% (2026–2035) CNRS materials science programmes
Italy 10.8% of regional share Pharmaceutical and biotech cluster expansion
Spain CAGR 5.74% (2026–2035) EU cohesion fund laboratory upgrades
Nordic Countries 8.2% of regional share Clean-energy materials R&D
Russia CAGR 4.85% (2026–2035) Domestic instrument substitution initiatives
Rest of Europe 11.5% of regional share Varied academic and industrial demand


Germany's leadership in the European Microscopy Devices Market reflects the density of its publicly funded research infrastructure, with over 80 Max Planck Institutes operating advanced imaging cores. The UK's commitment of GBP 25 billion to R&D by 2025 under its Innovation Strategy has directly funded procurement of cryo-EM and super-resolution platforms at Russell Group universities [5].

Asia-Pacific

Country Key Metric Key Driver
China 35.2% of regional share National Natural Science Foundation; semiconductor self-sufficiency
Japan 24.8% of regional share JEOL/Hitachi domestic ecosystem; advanced materials
South Korea CAGR 7.48% (2026–2035) Samsung and SK Hynix fab expansion
India CAGR 7.65% (2026–2035) DST Nano Mission; AIIMS imaging upgrades
ASEAN 8.4% of regional share Clinical diagnostics modernization
Rest of Asia-Pacific CAGR 6.35% (2026–2035) University laboratory build-outs


Asia-Pacific's rapid growth within the Microscopy Devices Market is driven by a convergence of semiconductor capital expenditure and government science-policy ambition. South Korea's plans to invest KRW 622 trillion in its semiconductor ecosystem through 2042 will generate sustained demand for high-resolution metrology tools, while India's Department of Science and Technology Nano Mission has funded over 60 institutional imaging centres since its second phase launched in 2020 [10][22].

South America

Country Key Metric Key Driver
Brazil 62.5% of regional share FAPESP research grants; university expansion
Argentina 19.8% of regional share CONICET laboratory modernization
Rest of South America CAGR 5.42% (2026–2035) Mining and agricultural research


Brazil dominates the South American Microscopy Devices Market, anchored by São Paulo's FAPESP-funded multiuser equipment programme that has installed electron and confocal systems at 14 state universities since 2021. Argentina's CONICET network has prioritized scanning probe instrumentation for materials-science research, contributing steady demand despite macroeconomic volatility.

Middle East & Africa

Country Key Metric Key Driver
Saudi Arabia 28.5% of regional share Vision 2030 university research parks
UAE 22.3% of regional share Khalifa University and MBZUAI labs
South Africa CAGR 5.95% (2026–2035) Mining geology and materials testing
Egypt CAGR 5.68% (2026–2035) Medical diagnostics infrastructure expansion
Rest of MEA 26.7% of regional share Varied clinical and extractive-industry demand


Saudi Arabia's Vision 2030 has catalysed over USD 6 billion in higher-education research infrastructure investment, and the Microscopy Devices Market in the region benefits from greenfield laboratory builds at institutions including KAUST and King Abdulaziz University [23]. South Africa's Council for Scientific and Industrial Research operates the region's largest electron-microscopy facility, supporting both mining-sector quality control and biomedical research.


Microscopy Devices Market By Region, 2025-2035

Competitive Benchmarking

The Microscopy Devices Market exhibits moderate concentration, with the top five vendors accounting for an estimated 55–62% of global revenue. The Herfindahl-Hirschman Index sits in the 1,200–1,500 range, indicating a market structure where a handful of diversified conglomerates compete alongside specialist players targeting high-value niches in scanning probe, correlative, and point-of-care imaging. Competitive differentiation increasingly hinges on integrated software ecosystems and service-contract economics rather than raw optical or electron-beam performance alone.

Company Est. Revenue Share Range Key Offerings for Microscopy Devices Market Strategic Positioning
Carl Zeiss AG ~12–16% Electron, light, X-ray microscopy; correlative workflows Full-spectrum portfolio; strong semiconductor metrology footprint
Thermo Fisher Scientific ~11–15% Cryo-EM (Titan Krios); FIB-SEM; digital pathology Dominates cryo-EM installed base; integrated life-science workflows
Leica Microsystems (Danaher) ~8–11% Confocal, stereo, surgical, and super-resolution microscopy High recurring-revenue model; pathology-automation focus
Nikon Corporation ~6–9% Widefield, confocal, super-resolution imaging Strong biopharma presence; NIS-Elements software ecosystem
Evident (formerly Olympus) ~5–8% Industrial and life-science optical microscopy Industrial inspection leadership; compact clinical systems
JEOL Ltd. ~5–7% TEM, SEM, SPM, NMR Academic and materials-science anchor; strong Asia-Pacific presence
Hitachi High-Tech Corporation ~4–6% SEM, TEM, FIB systems Semiconductor inline metrology; Hitachi group synergies
Bruker Corporation ~3–5% AFM, fluorescence, X-ray microscopy Scanning probe leadership; materials and life-science analytics
Keyence Corporation ~3–5% Digital and optical measurement microscopy Ease-of-use positioning; direct sales model
Oxford Instruments ~2–4% Cryo-SEM, EDS, EBSD; sample preparation Niche accessory and ancillary-system specialist


Recent News & Developments

  • Thermo Fisher Scientific (October 2024): Launched a next-generation 200 kV cryo-TEM platform designed for pharmaceutical and academic structural biology labs, incorporating an AI-powered particle-selection engine that reduces data-collection time by up to 50% [3].
  • January 2026: Thermo Fisher Scientific announced a USD 450 million expansion of its electron microscopy manufacturing facility in Brno, Czech Republic, adding 200,000 square feet of cleanroom space to double production capacity for cryo-TEM systems by 2028, responding to surging demand from pharmaceutical and academic customers.
  • January 2026: Hirox introduced a new-generation digital microscope with higher resolution, faster imaging, and deeper digital integration to advance industrial metrology use cases in electronics, automotive, and precision manufacturing.
  • October 2025: Hitachi High-Tech launched the SU9600, a next-generation ultrahigh-resolution SEM for high throughput and sub-nanometer precision imaging, integrated with automation and digital services under the Lumada 3.0 platform.


Microscopy Devices Market Report Scope

Parameter Detail
Market Scope Global Microscopy Devices Market — hardware, software, accessories, and services
Study Period 2021–2035
CAGR 6.22% (2026–2035)
Market Size (2025) USD 10.89 Billion
Market Size (2035) USD 19.92 Billion
Fastest Growing Segment Hospitals, Clinics & Diagnostic Labs (by end user); Electron Microscopy (by type)
Companies Profiled Carl Zeiss AG, Thermo Fisher Scientific, Leica Microsystems (Danaher), Nikon Corporation, Evident, JEOL Ltd., Hitachi High-Tech, Bruker Corporation, Keyence Corporation, Oxford Instruments
Valuation Currency USD Billion


FAQs

What total cost of ownership should a lab budget for a mid-range electron microscope over five years?
A mid-range FE-SEM typically costs USD 600,000–1.2 million upfront, with annual service contracts adding 8–12% of the purchase price. Five-year total cost of ownership, including installation and training, generally ranges from USD 950,000 to USD 1.8 million [16].
How do correlative microscopy workflows affect instrument procurement decisions?
Correlative light-electron workflows require compatible sample stages and software bridges between optical and electron platforms. Buyers increasingly favour single-vendor suites that guarantee interoperability, which is consolidating procurement toward full-portfolio manufacturers [3].
What regulatory pathway applies to microscopy devices used in clinical diagnostics?
Clinical-use devices in the US require FDA 510(k) clearance or De Novo classification, while the EU mandates IVDR certification. Approval timelines typically span 12–18 months, influencing vendor launch sequencing across regions [15].
How does the Microscopy Devices Market differ between semiconductor and life-science buyers?
Semiconductor buyers prioritize throughput, automation, and sub-nanometer resolution for inline inspection. Life-science buyers value versatility, fluorescence capability, and image-analysis software for varied biological specimens [2][8].
What service-contract models are gaining traction among microscopy vendors?
Vendors are shifting toward outcome-based contracts that guarantee uptime and include remote diagnostics. These models, often bundled with cloud software subscriptions, generate predictable recurring revenue and reduce buyer risk [11].
How are trade restrictions on advanced components affecting the Microscopy Devices Market?
U.S. export controls on advanced electron-beam and lithography-adjacent components have limited certain shipments to China. Affected Chinese institutions are accelerating domestic sourcing, though performance gaps remain for high-end systems [19].
What role does sample preparation play in microscopy equipment purchasing decisions?
Sample preparation — cryo-fixation, ultramicrotomy, sputter coating — accounts for 15–25% of a microscopy lab's consumable budget. Integrated preparation-to-imaging workflows reduce hands-on time and are becoming a competitive differentiator [16].    
What is the current size of the microscopy devices market?
The microscopy devices market reached USD 10.89 billion in 2025 and is projected to reach USD 19.92 billion by 2035.
What is the CAGR of the microscopy devices market?
The microscopy devices market is projected to grow at a CAGR of 6.22% during the forecast period 2026–2035.
Which region leads the microscopy devices market?
North America holds the largest share at 42.0%, while Asia-Pacific is the fastest-growing region at 7.21% CAGR.
Author
Author
Author Profile
Satyendra Maurya LinkedIn
Research Analyst
An accomplished research analyst with high proficiency in market forecasting, data visualization, competitive benchmarking, and others. He holds a pronounced track record in research and consulting projects for sectors such as life sciences, medical devices, and healthcare IT. His capabilities in qualitative and quantitative analysis have resulted in positive client outcomes. Working on niche market trends, opportunities, sales, and forecasted value is part of his skill set.
Co-Author
Co-Author Profile
Rahul Gotadki LinkedIn
Research Manager
He holds an experience of about 9+ years in Market Research and Business Consulting, working under the spectrum of Life Sciences and Healthcare domains. Rahul conceptualizes and implements a scalable business strategy and provides strategic leadership to the clients. His expertise lies in market estimation, competitive intelligence, pipeline analysis, customer assessment, etc.

Research Approach


Secondary Research

The secondary research process involved comprehensive analysis of regulatory databases, peer-reviewed scientific journals, technical publications, and authoritative research organizations. Key sources included the US Food & Drug Administration (FDA) 510(k) Premarket Notification Database, European Medicines Agency (EMA) Medical Device Regulations, International Organization for Standardization (ISO) Technical Committee 172 (Optics and Photonics), National Institute of Standards and Technology (NIST), National Institutes of Health (NIH) National Institute of General Medical Sciences, National Science Foundation (NSF) Science & Engineering Indicators, European Microscopy Society (EMS), Royal Microscopical Society (RMS), American Society for Cell Biology (ASCB), Materials Research Society (MRS), Semiconductor Industry Association (SIA), OECD Science, Technology and Innovation Statistics, UNESCO Institute for Statistics (UIS) R&D Expenditure Database, and national science foundation reports from key markets. These sources were used to collect equipment shipment statistics, regulatory approval data, clinical and research adoption studies, funding allocation trends, and market landscape analysis for optical microscopes, electron microscopes, scanning probe microscopes, and other microscopy technologies.


Primary Research

Qualitative and quantitative insights were obtained by interviewing supply-side and demand-side stakeholders during the primary research process. The supply-side sources consisted of CEOs, VPs of Product Development, heads of microscopy business divisions, and regional sales directors from microscopy device manufacturers and OEMs. Principal investigators, laboratory directors, procurement managers from academic and research institutes, hospitals and clinics, pharmaceutical R&D chiefs, and semiconductor fabrication facility managers comprised demand-side sources. Market segmentation was verified, product development roadmaps were confirmed, and insights regarding research funding patterns, pricing strategies, and equipment replacement cycles were obtained through primary research.

Primary Respondent Breakdown:

By Designation: C-level Primaries (28%), Director Level (32%), Others (40%)

By Region: North America (42%), Europe (25%), Asia-Pacific (28%), Rest of World (5%)


Market Size Estimation

Global market valuation was derived through revenue mapping and equipment installation base analysis. The methodology included:

Identification of 50+ key manufacturers across North America, Europe, Asia-Pacific, and Latin America

Product mapping across optical microscopes, electron microscopes, scanning probe microscopes, and other microscopy categories

Analysis of reported and modeled annual revenues specific to microscopy device portfolios

Coverage of manufacturers representing 75-80% of global market share in 2024

Extrapolation using bottom-up (equipment units × ASP by country/segment) and top-down (manufacturer revenue validation) approaches to derive segment-specific valuations

Download Free Sample

Kindly complete the form below to receive a free sample of this Report

Download PDF ×

We do not share your information with anyone. However, we may send you emails based on your report interest from time to time. You may contact us at any time to opt-out.
















