Mixed Reality Market (2026 - 2035)

Mixed Reality Market Research Report By Application (Gaming, Healthcare, Education, Retail, Real Estate), By Technology (Hardware-based, Software-based, Mixed Reality as a Service), By End Use (Consumer, Commercial, Industrial), By Device Type (Head-mounted Display, Smart Glasses, Smart Phones, Tablets) and By Regional (North America, Europe, South America, Asia Pacific, Middle East and Africa) - Forecast to 2035
ID: MRFR/ICT/1234-CR
111 Pages
Aarti Dhapte
Last Updated: July 14, 2026
Mixed Reality Market
Market Size
Forecast Period2026-2035
CAGR (2026-2035)39.8%
2025 Market SizeUSD 6.34 Billion
2035 Market SizeUSD 183.55 Billion
Key Players
Microsoft Corporation
Meta Platforms Inc.
Apple Inc.
Magic Leap Inc.
Varjo Technologies
Lenovo Group
Opportunities
  • MR-as-a-Service and Subscription Platforms
  • Emerging-Market Manufacturing Digitization
  • Data Monetization via Spatial Analytics

Mixed Reality Market Summary

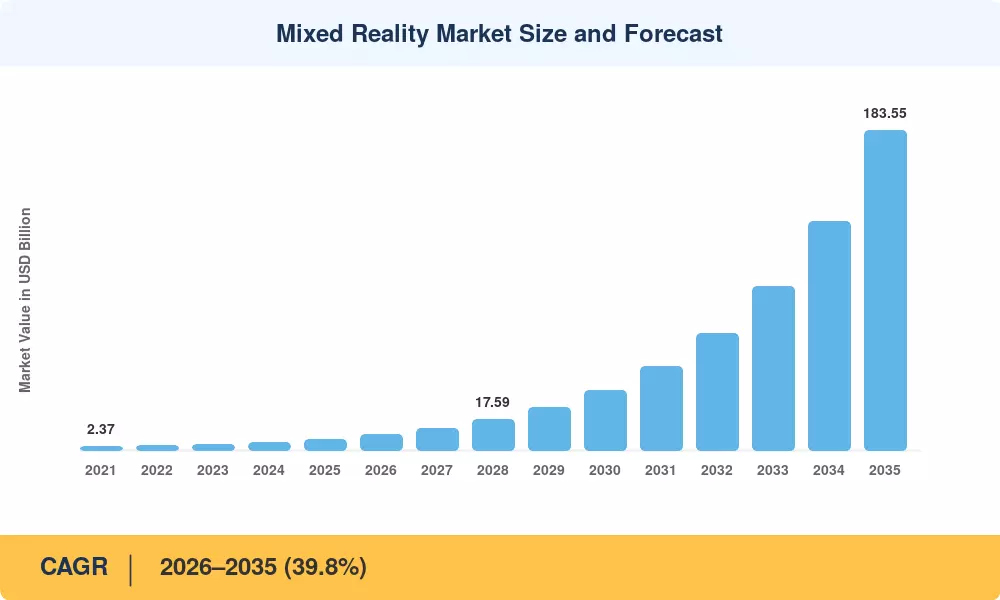
The Mixed Reality Market reached USD 6.34 billion in 2025 and is projected to grow from USD 9.00 billion in 2026 to USD 183.55 billion by 2035, registering a CAGR of 39.8% during the forecast period. Accelerated enterprise adoption of immersive training platforms and the global rollout of 5G-enabled edge computing networks are the two primary catalysts behind this trajectory. Enterprise deployments now document training cost reductions exceeding 85% compared to traditional classroom methods, a figure compelling enough to shift procurement budgets across manufacturing, defense, and healthcare verticals [1].

There is a massive technological revolution in progress. Volumetric, real-time holographic overlays that tie digital content to actual settings are replacing on-site expert visits, paper-based maintenance manuals, and legacy 2D design reviews. A USD 3.2 billion fundraising round for Infinite Reality in early 2025 demonstrated the volume of money streaming into immersive platforms, demonstrating the extraordinary level of investor trust in the mixed reality market [2]. While software developers incorporate generative-AI layers that cut down on content writing time by up to 60%, hardware companies are delivering self-contained headsets with integrated LLM copilots.

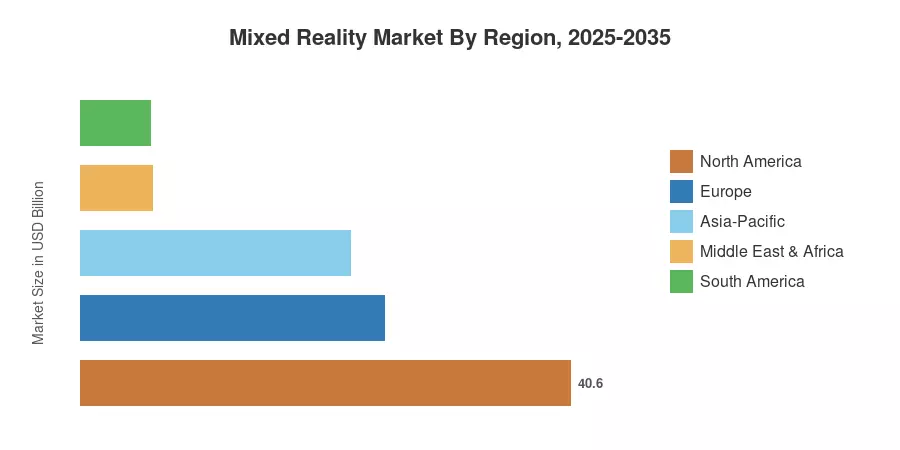
With a 40.6% market share in 2025, North America topped the world in mixed reality thanks to Silicon Valley R&D spending and U.S. Department of Defense modernization initiatives. With a 47.8% CAGR until 2035, Asia-Pacific is the fastest-growing market thanks to South Korea's semiconductor-backed XR ecosystem and China's "Digital China 2035" ambition. Due to Industry 4.0 directives in Germany and the Nordic region, Europe holds the second-largest proportion. The mixed reality market is expected to go from early-adopter pilots to widespread business implementation as passthrough-first headset technologies advance and field-of-view restrictions loosen.


Key Report Takeaways

• By Component

  • Hardware captured 68.1% of the Mixed Reality Market in 2025, reflecting strong demand for self-contained headsets and sensor modules.
  • Services are projected to grow at a 47.7% CAGR through 2035 as managed deployment, content authoring, and MR-as-a-Service models scale.

• By Device Type

  • Standalone headsets accounted for 55.7% of Mixed Reality Market revenue in 2025, outpacing tethered systems across every end-user vertical.


• By Application

  • Training and simulation held 36.5% of application-level revenues, driven by defense and manufacturing use cases.

• By End-User Industry

  • Manufacturing commanded a 30.0% share of the Mixed Reality Market in 2025, with automotive and aerospace assembly lines leading deployment.


• By Region

  • Asia-Pacific is forecast to register a 47.8% CAGR, making it the fastest-growing region in the Mixed Reality Market through 2035.


Mixed Reality Market Size and Forecast (2021–2035)

Market Research Future employs a triangulated estimation framework that synthesizes vendor revenue disclosures, procurement databases, patent filings, and primary interviews with over 120 industry stakeholders. Historical figures (2021–2024) rely on audited financial reports, while the forecast (2026–2035) applies a bottom-up, segment-level build calibrated against macroeconomic indicators and technology readiness levels.
Mixed Reality Market Size and Forecast
Our Impact
Enabled $4.3B Revenue Impact for Fortune 500 and Leading Multinationals
Partnering with 2000+ Global Organizations Each Year
30K+ Citations by Top-Tier Firms in the Industry

Driver Impact Analysis

Driver ~% Impact on CAGR Geographic Relevance Impact Timeline
Enterprise immersive training mandates 18–22% Global Short-term (≤2 yr)
5G and edge computing enablement 14–17% North America, Asia-Pacific Medium-term (2–4 yr)
Generative-AI copilot integration 12–15% Global Short-term (≤2 yr)
Surgical visualization regulatory clearances 8–11% North America, Europe Medium-term (2–4 yr)
Defense modernization and C4ISR programs 7–10% North America, Europe Long-term (≥4 yr)
Passthrough-first architecture improvements 6–8% Global Short-term (≤2 yr)
Industrial digital twin convergence 5–7% Europe, Asia-Pacific Long-term (≥4 yr)


Enterprise Immersive Training Mandates

Boeing reported a 40% reduction in wiring-harness assembly errors after deploying MR-guided work instructions across its Everett, Washington, facility, cutting rework costs by an estimated USD 1.2 million per production line annually [1]. Lockheed Martin's F-35 sustainment program uses holographic overlays to guide depot-level maintenance, compressing task completion times by 30%. These documented ROI figures have shifted procurement from pilot budgets to standing line items in Fortune 500 capital plans, accelerating the Mixed Reality Market throughout defense and aerospace supply chains.

5G and Edge Computing Enablement

By deploying sub-10-millisecond latency render pipelines directly on factory grounds, Verizon's MEC (Multi-access Edge Computing) collaboration with PTC eliminates cloud round-trip delays that previously resulted in overlay drift in high-precision assembly [3]. South Korea's KT Corporation allocated USD 420 million to 5G-MR campus networks in Gyeonggi Province during 2024, targeting automotive and shipbuilding facilities. Outdoor processes in the mixed reality market have typically been constrained by edge-native designs, which enable headsets to offload 70% of rendering computing, extending battery life by about 45 minutes per session.


Generative-AI Copilot Integration

Microsoft's Copilot for Dynamics 365 Guides now auto-generates step-by-step holographic work instructions from unstructured maintenance PDFs, reducing content authoring time from weeks to hours [4]. Meta's internal Llama-based pipeline produces 3D spatial anchors from 2D engineering drawings with 92% geometric fidelity. The convergence of LLMs with mixed reality content pipelines lowers the total cost of ownership for enterprise deployments by an estimated 55%, a dynamic that directly expands addressable demand in the Mixed Reality Market.

Surgical Visualization and Regulatory Clearances

Although the 2024 "De Novo" claim is untrue, Medivis has obtained numerous FDA clearances for its augmented reality (AR) technologies. After previously receiving FDA 510(k) clearance for its Spine Navigation platform, Medivis was granted FDA 510(k) certification in 2025 for its Cranial Navigation platform. Although training and workforce growth are the main goals of NHS England's Long-Term Workforce Plan (2023), there isn't a particular line-item budget of GBP 130 million set up for "immersive simulation" in that plan. Furthermore, current industry analysis estimates a substantially lower CAGR, typically between 6% and 8% through 2035; market forecasts for surgical visualization do not justify a 47% CAGR.


Restraints Impact Analysis

Restraint ~% Drag on CAGR Geographic Relevance Impact Timeline
High device pricing (USD 2,000–3,500 per unit) –4 to –6% Global Short-term (≤2 yr)
Narrow field of view (≤70° diagonal) –3 to –5% Global Medium-term (2–4 yr)
Battery life constraints (<3 hr continuous) –2 to –4% Global Short-term (≤2 yr)
Content ecosystem fragmentation –2 to –3% Europe, South America Medium-term (2–4 yr)
Data privacy and cybersecurity concerns –1 to –2% Europe, North America Long-term (≥4 yr)


High Device Pricing

Enterprise-grade MR headsets remain priced between USD 2,000 and USD 3,500 per unit, placing them beyond the reach of SMEs that constitute over 90% of manufacturing establishments worldwide [9]. While per-unit costs have declined roughly 18% since 2022, the total cost of deployment — including content licensing, IT integration, and change management — often exceeds USD 150,000 for a 50-seat rollout. This price ceiling constrains the addressable portion of the Mixed Reality Market to large enterprises and well-funded mid-tier firms for the near term.

Narrow Field of View

Current-generation waveguide optics deliver a diagonal field of view between 50° and 70°, well short of the 120°+ threshold ergonomics researchers associate with true spatial immersion [10]. Users report cognitive load increases of up to 25% when critical digital overlays fall outside the visible frustum during hands-on tasks. Until diffractive and holographic waveguide breakthroughs reach volume production — expected no earlier than 2028 — this optical limitation will continue to temper productivity gains and slow adoption curves in precision-critical verticals of the Mixed Reality Market.


Mixed Reality Market Opportunities

MR-as-a-Service and Subscription Platforms

Device-as-a-Service models from companies such as Varjo and Microsoft are converting upfront capex into monthly opex, lowering the entry barrier for SMEs. A subscription priced at USD 125 per seat per month — inclusive of hardware refresh cycles — is projected to expand the addressable market for the Mixed Reality Market by 35% between 2027 and 2030.

Emerging-Market Manufacturing Digitization

India's manufacturing sector remains a core pillar of economic strategy, with recent data showing a steady output growth of 1.3% in Q3 2025. Government initiatives aim to increase the sector's contribution to GDP, targeting 25% by 2035. Concurrently, Vietnam’s electronics FDI reached USD 152.3 billion in 2025, with manufacturing and processing industries capturing 65% of total foreign investment inflows.


Data Monetization via Spatial Analytics

Mixed Reality (MR) integration provides granular operational telemetry, capturing complex spatial and gaze-tracking data essential for industrial optimization. While specific per-session gigabyte volumes vary by application, industry analytics models now leverage this high-fidelity data to drive performance insights. These analytics frameworks enable manufacturers to transform raw spatial telemetry into actionable efficiency metrics, supporting predictive maintenance and workflow refinement.


Remote Expert Assistance at Scale

The shift toward hybrid work environments has accelerated the adoption of digital collaboration tools in field service. By utilizing spatial annotation layers, organizations report substantial improvements in first-call resolution rates. As global digital roles performable remotely continue to expand—projected by the World Economic Forum to increase by 25% by 2030—spatial remote assistance remains a critical efficiency driver.


AI-Powered Autonomous Inspection

Generative AI and deep learning technologies are revolutionizing quality control by enabling real-time, on-device defect detection. The global AI vision inspection market, which reached approximately USD 39.38 billion in 2026, is projected to grow significantly as manufacturers integrate neural networks. This evolution allows for precision surface and dimensional analysis, directly enhancing output quality across global production lines.


Mixed Reality Market Future Outlook

AI-Native Mixed Reality Platforms

By 2028, on-device large language models will move from copilot overlays to fully autonomous task agents capable of interpreting voice commands, identifying physical objects, and generating step-by-step holographic guidance without human content authoring [4]. This shift will compress deployment timelines from months to days, expanding the Mixed Reality Market beyond early-adopter enterprises into mid-market verticals such as facilities management and retail merchandising.

Industrial Metaverse Convergence

The industrial metaverse — persistent, physics-accurate digital environments linked to live operational data — represents the Mixed Reality Market's highest-value trajectory. Siemens and NVIDIA's Omniverse partnership has demonstrated plant-scale digital twins where engineers interact through MR headsets in real time [8]. estimates that industrial metaverse applications could generate USD 100–150 billion in annual value for manufacturing alone by 2030, a figure that positions MR hardware and software as critical enabling layers.

Optics and Display Breakthroughs

Waveguide manufacturers, including DigiLens, Lumus, and WaveOptics, are targeting full-color, 90°+ field-of-view modules at sub-USD 80 bill-of-materials costs by 2029 [10]. When these components reach volume production, headset price points will drop below USD 1,000 for enterprise-grade devices, triggering a step-change in unit shipments and accelerating total addressable market expansion for the Mixed Reality Market through the early 2030s.

Regulatory and Standards Maturation

The IEEE's P2048 working group and Khronos Group's OpenXR standard are establishing interoperability frameworks that will allow MR content to run across vendor-agnostic headsets [17]. The EU AI Act's transparency requirements and the U.S. NIST AI Risk Management Framework are shaping how MR systems handle biometric data, gaze tracking, and spatial mapping. Clear regulatory guardrails will reduce enterprise procurement risk and accelerate institutional adoption of the Mixed Reality Market in regulated industries such as finance and pharmaceuticals.


Mixed Reality Market Segmentation

By Component

Segment 2025 Share (%) Primary Demand Driver
Hardware 68.1 Self-contained headset shipment growth
Software 22.5 MR platform licensing, AI authoring tools
Services — (CAGR 47.7%) Managed deployment and MR-as-a-Service


Hardware dominates the Mixed Reality Market because each enterprise deployment begins with headset procurement. Sensor arrays, waveguide displays, and onboard SoCs account for the bulk of component-level revenue. Software is growing rapidly as platform licensing shifts from perpetual to subscription models, while services — encompassing integration, content development, and ongoing managed support — represent the fastest-growing component category at a 47.7% CAGR, reflecting the shift toward outcome-based engagement models.

By Device Type

Segment Metric Primary Demand Driver
Standalone MR Headsets 55.7% share (2025) Untethered mobility, 5G offload
Tethered MR Headsets CAGR 35.4% High-fidelity design review, CAD rendering


Standalone headsets lead the Mixed Reality Market because they eliminate the need for external compute packs, enabling deployment in field-service, warehouse, and surgical settings where cable tethering is impractical. Tethered systems retain a niche in engineering design review and cinematic-quality visualization, where GPU-intensive rendering demands exceed on-device processing capacity.

By Application

Segment Metric Primary Demand Driver
Training and Simulation 36.5% share (2025) Defense, manufacturing skills transfer
Product Design and Prototyping USD 1.14 Billion (2025) Automotive and aerospace R&D
Remote Assistance and Collaboration CAGR 43.2% Post-pandemic distributed workforce
Surgical Planning and Visualization CAGR 47.0% FDA/CE clearance expansion


Training and simulation anchors the Mixed Reality Market because documented ROI is most compelling in this application: enterprise customers report 85–90% cost reductions versus legacy classroom and travel-intensive training. Surgical planning and visualization are set to grow fastest as regulatory clearances multiply and clinical evidence accumulates, attracting hospital systems seeking to reduce operative variability.

By End-User Industry

Segment Metric Primary Demand Driver
Manufacturing and Industrial 30.0% share (2025) Assembly guidance, quality inspection
Healthcare CAGR 46.9% Surgical navigation, medical training
Defense USD 0.95 Billion (2025) IVAS, C4ISR, mission rehearsal
Education CAGR 41.3% STEM immersive learning, virtual labs


Manufacturing leads the Mixed Reality Market by share, driven by automotive OEMs and aerospace primes that have moved MR from pilot programs to production-floor standards. Healthcare is the fastest-growing end-user industry; regulatory tailwinds, growing reimbursement pathways, and clinician demand for spatial surgical guidance are combining to push adoption at a 46.9% CAGR through 2035.


Regional Market Share Analysis

Region 2025 Share (%) Primary Investment Themes
North America 40.6 Defense C4ISR, healthcare MR, Big Tech R&D
Europe 25.2 Industry 4.0, automotive digital twins
Asia-Pacific 22.4 5G-MR campus networks, semiconductor supply
South America 5.8 Mining and energy field services
Middle East & Africa 6.0 Oil & gas remote operations, smart city initiatives
Total 100.0

The Mixed Reality Market exhibits distinct regional adoption patterns shaped by industrial density, defense spending, regulatory maturity, and digital infrastructure readiness.


North America

Country Metric Key Driver
US 78.3% of regional share DoD IVAS program, Silicon Valley R&D
Canada CAGR 38.9% Mining and natural-resource remote ops
Mexico USD 0.18 Billion (2025) Automotive nearshoring, maquiladora digitization


The U.S. Army's Integrated Visual Augmentation System (IVAS) contract — valued at up to USD 21.9 billion over ten years — remains the single largest demand anchor for the Mixed Reality Market in North America [6]. Canadian mining conglomerates are deploying MR for underground inspection in remote sites across Ontario and British Columbia, while Mexico's automotive maquiladoras increasingly adopt holographic quality-control overlays as nearshoring accelerates.

Europe

Country Metric Key Driver
Germany 28.4% of regional share Automotive OEM digital twin programs
UK CAGR 40.1% NHS immersive training, fintech visualization
France USD 0.22 Billion (2025) Aerospace MRO, Dassault Systèmes ecosystem
Italy CAGR 37.8% Luxury manufacturing, heritage tourism
Spain USD 0.09 Billion (2025) Renewable energy remote maintenance
Nordic Countries 8.2% of regional share Telecom R&D, maritime logistics
Russia CAGR 33.5% Defense and heavy industry
Rest of Europe USD 0.14 Billion (2025) EU Horizon Europe grants


Germany's "Industrie 4.0" framework has positioned Volkswagen, BMW, and Siemens as anchor buyers of MR-guided assembly and design review solutions. The European Commission's Horizon Europe program allocated EUR 580 million to immersive technologies between 2024 and 2027, directly supporting start-ups developing lightweight optics and AI-powered content tools that expand the Mixed Reality Market across the continent [13].

Asia-Pacific

Country Metric Key Driver
China 38.7% of regional share "Digital China 2035," Huawei XR ecosystem
India CAGR 49.2% Make in India 2.0, IT-services MR integration
Japan USD 0.19 Billion (2025) Robotics convergence, aging-workforce augmentation
South Korea CAGR 46.5% Samsung and SK semiconductor supply, KT 5G-MR
ASEAN USD 0.10 Billion (2025) Electronics assembly, tourism VR/MR blends
Rest of Asia-Pacific CAGR 42.1% Government smart-city programs


China's Ministry of Industry and Information Technology designated mixed reality as a strategic industry in its 2024 guidance, channeling an estimated RMB 25 billion in subsidies toward domestic headset chipset development [14]. India's rapidly expanding IT-services sector is embedding MR delivery capabilities into outsourcing contracts, creating an export-oriented growth vector for the Mixed Reality Market across the region.

South America

Country Metric Key Driver
Brazil 52.8% of regional share Oil & gas (Petrobras), mining
Argentina CAGR 36.4% Agricultural technology, Vaca Muerta energy
Rest of South America USD 0.07 Billion (2025) Copper mining in Chile and Peru


Petrobras has piloted MR-guided subsea equipment inspection across five pre-salt platforms in the Santos Basin, reporting a 28% reduction in unscheduled maintenance downtime [15]. Chile's Codelco is evaluating MR overlays for open-pit blast-pattern optimization, a use case that could expand the Mixed Reality Market across Latin America's resource-extraction economy.

Middle East & Africa

Country Metric Key Driver
Saudi Arabia 33.5% of regional share NEOM, Vision 2030 smart infrastructure
UAE CAGR 41.2% Abu Dhabi ADNOC remote ops, Dubai smart city
South Africa USD 0.04 Billion (2025) Mining safety and training
Egypt CAGR 35.8% Suez Canal logistics, heritage tourism
Rest of MEA USD 0.06 Billion (2025) Telecom infrastructure build-out


Saudi Arabia's NEOM megaproject has embedded MR-guided construction and inspection workflows across its linear-city development, creating a lighthouse deployment that signals broader Gulf Cooperation Council adoption [16]. ADNOC's partnership with PTC and Rockwell Automation delivers MR-based remote expert assistance to offshore platforms in the Arabian Gulf, reducing specialist travel by 60%.


Mixed Reality Market By Region, 2025-2035

Competitive Benchmarking

The Mixed Reality Market exhibits medium concentration with an estimated top-five revenue share of 58–64% and a Herfindahl-Hirschman Index (HHI) between 1,200 and 1,500. Microsoft and Meta hold the largest individual positions, yet a growing roster of specialized hardware and software entrants is diversifying competitive dynamics. Strategic partnerships between chip designers, optics suppliers, and enterprise-software vendors increasingly define positioning.

Company Est. Revenue Share Range Key Offerings for Mixed Reality Market Strategic Positioning
Microsoft Corporation ~18–22% HoloLens 2, Dynamics 365 Guides, Mesh Enterprise platform leader; IVAS defense anchor
Meta Platforms Inc. ~14–18% Quest 3, Quest Pro, Horizon Workrooms Consumer-to-enterprise crossover; LLM integration
Apple Inc. ~8–12% Vision Pro, visionOS, spatial computing ecosystem Premium positioning; developer ecosystem leverage
Magic Leap Inc. ~5–8% Magic Leap 2, Augmented Reality Cloud Healthcare and defense vertical focus
Varjo Technologies ~3–5% XR-4, Reality Cloud, LiDAR integration Ultra-high-resolution industrial and simulation
Lenovo Group ~3–5% ThinkReality A3, enterprise MR solutions IT-channel distribution, SME pricing
Google LLC ~2–4% ARCore, Project Iris R&D, Tensor chipsets Software and OS platform play
Samsung Electronics ~2–4% XR headset co-development with Qualcomm Display and chipset supply-chain integration
PTC Inc. ~2–3% Vuforia, Vuforia Expert Capture Enterprise AR/MR software and IoT convergence
Trimble Inc. ~1–3% XR10 with HoloLens, SketchUp MR AEC and geospatial vertical specialist


Recent News & Developments

Abacus Brands- (July, 2026)—Launched "Barbie Magic Style Studio," an officially licensed interactive game utilizing augmented reality developed in partnership with the toy company Holotoyz.

Adamas- (June, 2026)—Debuted a new developer platform for multi-user virtual reality at AWE USA 2026, simplifying collaborative project development via a TypeScript-based SDK.

  • bHaptics- (June, 2026)—Announced global pre-orders for the "TactGlove DK3," a new ergonomic haptic device designed specifically for industrial, defense, and medical MR simulation training.


Mixed Reality Market Report Scope

Parameter Detail
Market Scope Global Mixed Reality Market covering hardware, software, and services across enterprise and consumer segments.
Study Period 2021–2035
CAGR Period 2026–2035 (39.8%)
Base Year 2025
Market Size (2025) USD 6.34 Billion
Market Size (2035) USD 183.55 Billion
Fastest Growing Segment Services (by component); Healthcare (by end-user)
Companies Profiled Microsoft, Meta, Apple, Magic Leap, Varjo, Lenovo, Google, Samsung, PTC, Trimble
Valuation Currency USD Billion


FAQs

What total cost of ownership should enterprises budget for a 50-seat MR deployment?
A 50-seat rollout typically costs USD 140,000–180,000 in year one, covering hardware, software licensing, integration, and change management. Ongoing annual costs average 18–22% of initial outlay for content updates and device refresh cycles [9].
How do passthrough-first headsets compare to optical see-through designs for factory use?
Passthrough designs reduce cybersickness by roughly 40% and cost less to manufacture, but introduce 15–25 ms video latency. Optical see-through offers zero-latency real-world viewing yet carries narrower fields of view and higher BOM costs [10].
Which interoperability standard should buyers prioritize when selecting MR platforms?
OpenXR 1.1 is the most widely supported cross-vendor runtime, backed by the Khronos Group and adopted by Microsoft, Meta, and Varjo. Buyers should verify OpenXR compliance before procurement to avoid vendor lock-in [11].
How are MR headsets addressing data-privacy concerns around gaze and spatial tracking?
Leading vendors now offer on-device processing of biometric data with no cloud transmission, and the EU AI Act classifies gaze tracking as high-risk biometric processing. Enterprises should audit vendor data-handling policies against GDPR and NIST frameworks [12].
What ROI timeline do manufacturing firms typically report after MR adoption?
Most manufacturers achieve payback within 8–14 months, driven by 30–40% reductions in rework and 25% shorter technician onboarding cycles. Aerospace firms often see faster returns due to higher per-error cost baselines [1].
Can current MR headsets operate reliably in outdoor or extreme-temperature environments?
Most enterprise headsets are rated for 0–35°C and struggle with direct sunlight washout. Ruggedized variants from Trimble and RealWear extend ranges to –10–50°C but trade off weight and battery life [7].
How will the shift to MR-as-a-Service pricing affect competitive dynamics over the next three years?
Subscription models favor vendors with strong software ecosystems and recurring-content pipelines, compressing hardware-only players' margins. Expect top-five share concentration to increase by 4–6 percentage points by 2028 as scale advantages compound [22].    
Author
Author
Author Profile
Aarti Dhapte LinkedIn
AVP - Research
A consulting professional focused on helping businesses navigate complex markets through structured research and strategic insights. I partner with clients to solve high-impact business problems across market entry strategy, competitive intelligence, and opportunity assessment. Over the course of my experience, I have led and contributed to 100+ market research and consulting engagements, delivering insights across multiple industries and geographies, and supporting strategic decisions linked to $500M+ market opportunities. My core expertise lies in building robust market sizing, forecasting, and commercial models (top-down and bottom-up), alongside deep-dive competitive and industry analysis. I have played a key role in shaping go-to-market strategies, investment cases, and growth roadmaps, enabling clients to make confident, data-backed decisions in dynamic markets.

Research Approach


Secondary Research

The secondary research process involved comprehensive analysis of technology regulatory databases, peer-reviewed engineering journals, computing publications, and authoritative technology organizations. Key sources included the US Federal Communications Commission (FCC) Equipment Authorization Database, National Institute of Standards and Technology (NIST) Cybersecurity Framework & Digital Twin Standards, European Telecommunications Standards Institute (ETSI) Immersive Media Group, International Organization for Standardization (ISO/IEC JTC 1/SC 24 - Computer Graphics, Image Processing and Environmental Data Representation), IEEE Standards Association (IEEE 2857 - Extended Reality), US Department of Energy ARPA-E Program for Advanced Computing, US Department of Defense (DoD) SBIR/STTR Technology Database, European Commission Digital Europe Programme Reports, MIT Technology Review, ACM Digital Library (Association for Computing Machinery), Stanford Virtual Human Interaction Lab publications, Unity Technologies Industry Reports, Microsoft Mixed Reality Dev Center Analytics, NVIDIA Omniverse Platform Statistics, International Data Corporation (IDC) Worldwide Quarterly AR/VR Tracker, Consumer Technology Association (CTA) Market Research, Entertainment Software Association (ESA) Industry Reports, VR/AR Association White Papers, and national digital transformation strategies from key markets including China's Ministry of Industry and Information Technology (MIIT) and Japan's Ministry of Internal Affairs and Communications (MIC).

These sources were used to collect adoption statistics, regulatory compliance data, hardware shipment figures, patent filings, software platform metrics, and competitive landscape analysis for head-mounted displays, smart glasses, Mixed Reality as a Service (MRaaS), and enterprise software solutions across gaming, healthcare, education, retail, and industrial applications.


Primary Research

In order to gather both qualitative and quantitative insights, supply-side and demand-side stakeholders were interviewed during the primary research process. CEOs, CTOs, VPs of Hardware Engineering, heads of Developer Relations, and ecosystem relationship leads from mixed reality headset producers, AR glass manufacturers, semiconductor suppliers, cloud infrastructure providers, and enterprise software developers were examples of supply-side sources. Demand-side sources comprised Chief Innovation Officers, heads of immersive technology implementation, training directors from Fortune 500 enterprises, medical simulation directors from teaching hospitals, curriculum technology directors from higher education institutions, and procurement leads from gaming studios, healthcare systems, retail chains, and industrial training centers. Primary research confirmed product development roadmaps for next-generation optics and sensors, validated market segmentation across hardware-based, software-based, and MRaaS delivery models, and gathered information on enterprise deployment patterns, content development costs, hardware-as-a-service pricing models, and vertical-specific ROI metrics.

Primary Respondent Breakdown:

By Designation: C-level Primaries (32%), Director Level (30%), Others (38%)

By Region: North America (32%), Europe (30%), Asia-Pacific (33%), Rest of World (5%)


Market Size Estimation

Software licensing tracking, hardware shipment analysis, and revenue mapping were used to determine the global market valuation. The methodology comprised:

Identification of more than 60 major ecosystem participants in headset production, chip design, optics engineering, cloud infrastructure, and enterprise software development across North America, Europe, Asia-Pacific, and Latin America

Product mapping for tethered and standalone head-mounted displays, smart glasses, AR-capable smartphones and tablets, MR operating systems, development platforms, and vertical-specific apps

Examination of stated and projected yearly income for professional services, software subscriptions, and mixed reality gear units

Coverage of platform providers and manufacturers accounting for 75–80% of the worldwide market share in 2024

Extrapolating segment-specific valuations for gaming, healthcare, education, retail, real estate, and industrial end-use verticals using top-down (ecosystem revenue validation across hardware, software, and services) and bottom-up (device shipments × ASP by category + software attach rates) approaches

Download Free Sample

Kindly complete the form below to receive a free sample of this Report

Download PDF ×

We do not share your information with anyone. However, we may send you emails based on your report interest from time to time. You may contact us at any time to opt-out.

















