×
  • Cat-intel
  • MedIntelliX
  • Resources
  • About Us
  • Hero Background
    English
    Chinese
    French
    Japanese
    Korean
    German
    Spanish

    Mixed Reality Market Share

    ID: MRFR/ICT/1234-CR
    111 Pages
    Aarti Dhapte
    February 2020

    Mixed Reality Market Research Report By Application (Gaming, Healthcare, Education, Retail, Real Estate), By Technology (Hardware-based, Software-based, Mixed Reality as a Service), By End Use (Consumer, Commercial, Industrial), By Device Type (Head-mounted Display, Smart Glasses, Smart Phones, Tablets) and By Regional (North America, Europe, South America, Asia Pacific, Middle East and Africa)...

    Share:
    Download PDF ×

    We do not share your information with anyone. However, we may send you emails based on your report interest from time to time. You may contact us at any time to opt-out.

    Mixed Reality Market Infographic
    Purchase Options

    Market Share

    Mixed Reality Market Share Analysis

    Successful implementation of immersive display technology is currently hindered by certain challenges that need further development. Two significant factors impeding market development are limited battery life and image latency issues. These challenges affect the functionality and widespread adoption of mixed reality-based displays.

    One of the key challenges is the image latency issue faced by existing mixed reality displays. This problem arises from factors such as the smaller interpupillary distance (IPD), which aims to prevent the generation of blurry images. The current commercially available mixed reality display devices are grappling with this challenge, impacting the user experience.

    Moreover, these display devices are constrained by limited battery life, posing an additional challenge to their usability. For instance, the Microsoft HoloLens provides a power backup of 5.5 hours in entertainment mode, while the Magicleap mixed reality headset offers a backup of three hours when used continuously. The restricted duration of battery life raises concerns about the practicality and convenience of using mixed reality devices for extended periods.

    These limitations in battery life and image latency issues present obstacles to the widespread adoption of mixed reality devices in the foreseeable future. As the market continues to evolve, addressing these challenges will be crucial for enhancing the performance and usability of immersive display technology, ensuring a seamless and engaging experience for users

    Author
    Aarti Dhapte
    Team Lead - Research

    She holds an experience of about 6+ years in Market Research and Business Consulting, working under the spectrum of Information Communication Technology, Telecommunications and Semiconductor domains. Aarti conceptualizes and implements a scalable business strategy and provides strategic leadership to the clients. Her expertise lies in market estimation, competitive intelligence, pipeline analysis, customer assessment, etc.

    Leave a Comment

    FAQs

    What is the projected market valuation of the Mixed Reality Market by 2035?

    The Mixed Reality Market is projected to reach a valuation of 197.99 USD Billion by 2035.

    What was the market valuation of the Mixed Reality Market in 2024?

    In 2024, the overall market valuation was 16.22 USD Billion.

    What is the expected CAGR for the Mixed Reality Market during the forecast period 2025 - 2035?

    The expected CAGR for the Mixed Reality Market during the forecast period 2025 - 2035 is 25.54%.

    Which application segment is projected to have the highest valuation by 2035?

    The Retail application segment is projected to reach a valuation of 50.0 USD Billion by 2035.

    What are the key players in the Mixed Reality Market?

    Key players in the Mixed Reality Market include Microsoft, Meta Platforms, Apple, Google, NVIDIA, Sony, Samsung, Magic Leap, and PTC.

    How does the valuation of the Healthcare segment compare to others by 2035?

    The Healthcare segment is projected to reach 40.0 USD Billion by 2035, indicating strong growth compared to other segments.

    What is the projected valuation for the Software-based technology segment by 2035?

    The Software-based technology segment is projected to reach a valuation of 79.99 USD Billion by 2035.

    Which device type is expected to dominate the Mixed Reality Market by 2035?

    The Head-mounted Display device type is expected to dominate with a projected valuation of 58.0 USD Billion by 2035.

    What is the projected valuation for the Industrial end-use segment by 2035?

    The Industrial end-use segment is projected to reach a valuation of 59.01 USD Billion by 2035.

    How does the Mixed Reality as a Service segment compare to other technology segments by 2035?

    The Mixed Reality as a Service segment is projected to reach 58.01 USD Billion by 2035, indicating competitive growth within the technology segments.

    Market Summary

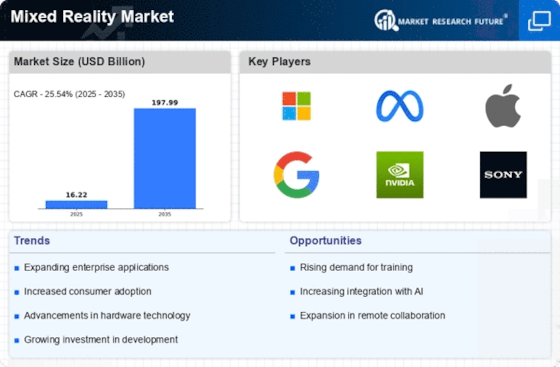
    As per MRFR analysis, the Mixed Reality Market Size was estimated at 16.22 USD Billion in 2024. The Mixed Reality industry is projected to grow from 20.36 USD Billion in 2025 to 197.99 USD Billion by 2035, exhibiting a compound annual growth rate (CAGR) of 25.54 during the forecast period 2025 - 2035.

    Key Market Trends & Highlights

    The Mixed Reality Market is experiencing robust growth driven by technological advancements and increasing applications across various sectors.

    • North America remains the largest market for mixed reality, driven by significant investments in technology and innovation.
    • The Asia-Pacific region is emerging as the fastest-growing market, fueled by rising demand for immersive experiences and digital transformation.
    • The gaming segment continues to dominate the market, while healthcare is rapidly becoming the fastest-growing segment due to its innovative applications.
    • Technological advancements in hardware and the integration of artificial intelligence are key drivers propelling the growth of mixed reality solutions.

    Market Size & Forecast

    2024 Market Size 16.22 (USD Billion)
    2035 Market Size 197.99 (USD Billion)
    CAGR (2025 - 2035) 25.54%
    Largest Regional Market Share in 2024 North America

    Major Players

    <p>Microsoft (US), Meta Platforms (US), Apple (US), Google (US), NVIDIA (US), Sony (JP), Samsung (KR), Magic Leap (US), PTC (US)</p>

    Market Trends

    The Mixed Reality Market is currently experiencing a transformative phase characterized by rapid technological advancements and increasing adoption across various sectors. This market encompasses a blend of augmented reality and virtual reality, creating immersive experiences that enhance user interaction and engagement. Industries such as healthcare, education, and entertainment are leveraging mixed reality solutions to improve training, simulations, and customer experiences. As organizations recognize the potential of this technology, investments are likely to surge, driving innovation and expanding applications. Moreover, the integration of artificial intelligence and machine learning into mixed reality applications appears to be a pivotal trend. These technologies enhance the capabilities of mixed reality systems, enabling more personalized and adaptive experiences. The growing demand for remote collaboration tools, particularly in professional settings, suggests that mixed reality will play a crucial role in shaping the future of work. As the Mixed Reality Market evolves, it may redefine how individuals interact with digital content, fostering a more interconnected and immersive digital landscape.

    Increased Adoption in Healthcare

    The healthcare sector is increasingly utilizing mixed reality for training and surgical simulations. This trend indicates a shift towards more interactive and effective learning methods, enhancing the skills of medical professionals.

    Expansion in Education

    Educational institutions are beginning to incorporate mixed reality into their curricula. This trend suggests a move towards more engaging and immersive learning experiences, potentially improving student outcomes and retention.

    Growth in Remote Collaboration

    The demand for remote collaboration tools is rising, with mixed reality providing innovative solutions for virtual meetings and teamwork. This trend highlights the potential for mixed reality to transform how teams interact and collaborate across distances.

    Mixed Reality Market Market Drivers

    Technological Advancements in Hardware

    The Mixed Reality Market is experiencing a surge in technological advancements, particularly in hardware capabilities. Innovations in headsets, sensors, and display technologies are enhancing user experiences and expanding application areas. For instance, the introduction of lightweight, high-resolution headsets has made mixed reality more accessible to consumers and businesses alike. According to recent data, the hardware segment is projected to account for a substantial share of the market, driven by increasing demand for immersive experiences in various sectors. This trend indicates that as hardware becomes more sophisticated, the Mixed Reality Market is likely to witness accelerated growth, attracting investments and fostering new applications.

    Rising Demand for Immersive Experiences

    The Mixed Reality Market is witnessing a rising demand for immersive experiences across various sectors, including entertainment, retail, and training. Consumers and businesses are increasingly seeking engaging and interactive environments that enhance learning and retention. This demand is reflected in the growing number of applications that utilize mixed reality for simulations, virtual tours, and interactive marketing. Market data suggests that the entertainment segment is expected to grow significantly, driven by the integration of mixed reality in gaming and live events. As the appetite for immersive experiences continues to expand, the Mixed Reality Market is poised for substantial growth, with new opportunities emerging in diverse fields.

    Integration with Artificial Intelligence

    The integration of artificial intelligence into mixed reality applications is emerging as a pivotal driver for the Mixed Reality Market. AI technologies enhance the capabilities of mixed reality by enabling more intuitive interactions and personalized experiences. For example, AI can analyze user behavior and adapt the mixed reality environment accordingly, creating a more engaging experience. Market analysis indicates that the combination of AI and mixed reality is likely to unlock new use cases, particularly in sectors such as healthcare and education. As AI continues to evolve, its synergy with mixed reality could significantly impact the Mixed Reality Market, fostering innovation and expanding its reach.

    Growing Applications in Industrial Training

    The Mixed Reality Market is increasingly finding applications in industrial training, where immersive simulations are used to enhance workforce skills and safety. Companies are adopting mixed reality solutions to provide realistic training environments that allow employees to practice without the risks associated with real-world scenarios. Data suggests that the industrial training segment is expected to grow rapidly, driven by the need for effective training solutions in complex industries such as manufacturing and construction. As organizations recognize the benefits of mixed reality for training purposes, the Mixed Reality Market is likely to see a surge in demand, leading to further advancements and adoption.

    Increased Investment in Research and Development

    Investment in research and development is a key driver for the Mixed Reality Market, as companies strive to innovate and differentiate their offerings. Organizations are allocating significant resources to explore new applications and improve existing technologies. This focus on R&D is likely to lead to breakthroughs in mixed reality applications, enhancing functionality and user experience. Recent statistics indicate that R&D spending in the mixed reality sector has increased markedly, suggesting a robust commitment to advancing the technology. As companies continue to innovate, the Mixed Reality Market may experience accelerated growth, with new products and services entering the market.

    Market Segment Insights

    By Application: Gaming (Largest) vs. Healthcare (Fastest-Growing)

    <p>The Mixed Reality Market is comprised of several key applications, with gaming leading the segment. As consumer interest in immersive experiences continues to escalate, gaming constitutes the largest share of the market. Following closely, healthcare is emerging as a significant player, as medical institutions increasingly recognize the value of Mixed Reality Market solutions in training and patient care. Other noteworthy applications include education, retail, and real estate, each contributing to a diverse marketplace. In terms of growth trends, the healthcare sector is experiencing rapid expansion, fueled by advancements in technology and a growing acceptance of virtual training methodologies. This is juxtaposed with gaming, which remains a dominant force due to the ongoing development of interactive and immersive experiences. Retail and real estate are also evolving, as companies leverage Mixed Reality Market for enhanced customer engagement and property visualization, respectively.</p>

    <p>Gaming (Dominant) vs. Healthcare (Emerging)</p>

    <p>Gaming stands as the dominant application in the Mixed Reality Market, capturing consumers' attention with highly engaging and interactive platforms that enrich the gaming experience. This segment thrives on constant innovations, such as virtual reality headsets and augmented reality enhancements, which enhance gameplay and provide unique social interactions. On the other hand, the healthcare segment is an emerging force, characterized by its increasing adoption of Mixed Reality Market for training surgical techniques and patient rehabilitation. This growth is driven by a shift towards innovative healthcare solutions that foster improved learning outcomes and patient experiences. Together, these segments illustrate the diverse applications of Mixed Reality Market technology across various industries.</p>

    By Technology: Hardware-based (Largest) vs. Mixed Reality Market as a Service (Fastest-Growing)

    <p>In the Mixed Reality Market, the segment distribution showcases Hardware-based solutions holding a dominant position. This segment includes a variety of devices, such as headsets and sensors that provide immersive experiences for users. On the other hand, Mixed Reality Market as a Service is emerging rapidly, appealing to businesses seeking flexible and scalable options for integrating mixed reality solutions. The software-based segment also plays a significant role, but its growth is comparatively slower than that of the rapidly adaptive Mixed Reality Market as a Service.</p>

    <p>Technology: Hardware-based (Dominant) vs. Mixed Reality Market as a Service (Emerging)</p>

    <p>The Hardware-based segment is characterized by its extensive range of devices and equipment that enhance user engagement through immersive experiences. This dominance is supported by continuous innovations in hardware technology, such as improved optics and processing power. In contrast, Mixed Reality Market as a Service is gaining traction as companies favor subscription-based models that reduce upfront costs and allow for easy updates. This segment caters to diverse industries, enabling businesses to deploy mixed reality applications without substantial investments in physical infrastructure, thereby making it an attractive alternative for many.</p>

    By End Use: Consumer (Largest) vs. Commercial (Fastest-Growing)

    <p>The Mixed Reality Market has seen diverse usage across different segments, with the Consumer segment leading in market share. This segment includes applications such as gaming, virtual tours, and social interactions, appealing primarily to tech-savvy individuals. The Commercial segment, encompassing enterprises using mixed reality for training, marketing, and collaboration, is rapidly gaining traction, indicating a shift toward immersive technologies in business settings. Growth trends in the Mixed Reality Market are significantly influenced by advancements in technology and increased adoption among users. The Consumer segment benefits from the growing popularity of immersive entertainment experiences, leading to higher spending on hardware and software. Meanwhile, the Commercial sector is propelled by the need for innovative solutions in workforce training and enhanced customer engagement, positioning it as the fastest-growing area of the market.</p>

    <p>Consumer (Dominant) vs. Commercial (Emerging)</p>

    <p>The Consumer segment stands out in the Mixed Reality Market as the dominant force due to its extensive application in entertainment and social experiences. Consumers are increasingly drawn to interactive gaming and virtual experiences that enhance their leisure activities. This segment is characterized by continuous innovation in hardware, such as headsets and glasses, tailored to improve user experiences and accessibility. On the other hand, the Commercial segment is emerging as a noteworthy player, focusing on practical applications in various industries like education, healthcare, and retail. Businesses recognize the potential of mixed reality to transform operations, leading to enhanced training methods, improved marketing strategies, and deeper customer engagement. This combination of growing interest in consumer products and practical applications in commercial environments highlights a dynamic shift in the Mixed Reality Market landscape.</p>

    By Device Type: Head-mounted Display (Largest) vs. Smart Glasses (Fastest-Growing)

    <p>In the Mixed Reality Market, the device type segment showcases a notable distribution of market share among various technologies. Head-mounted displays hold the largest share, driven by their immersive experience and growing adoption in gaming and training sectors. Smart glasses are emerging rapidly, capturing attention due to their compact design and multifunctional capabilities, appealing to both consumers and enterprises. Meanwhile, smartphones and tablets have a significant presence as well, but they primarily offer supplementary mixed reality experiences rather than full immersion. Growth trends within this segment are propelled by advances in technology and increasing user engagement. The demand for interactive and immersive experiences fuels innovations in head-mounted displays, while smart glasses are increasingly being recognized for their potential in industries like healthcare and manufacturing. Additionally, the integration of mixed reality capabilities in smartphones and tablets is enhancing user experiences, leading to broader acceptance and usage across varied demographics.</p>

    <p>Head-mounted Display (Dominant) vs. Smart Glasses (Emerging)</p>

    <p>The head-mounted display segment is characterized by its dominance in the mixed reality space, offering users an unparalleled immersive experience that sets it apart from other device types. Its robust position is bolstered by advancements in optics, tracking technology, and content availability. Conversely, smart glasses present a novel and emerging solution with a focus on hands-free interaction and augmented overlays. They appeal particularly to enterprise users seeking efficiency and productivity enhancements. This segment is marked by rapid innovation, as companies capitalize on improving user's daily interactions through lightweight designs and compatibility with various applications, signaling a strong potential for market disruption in the near future.</p>

    Get more detailed insights about Mixed Reality Market Research Report- Global Forecast to 2035

    Regional Insights

    The Mixed Reality Market revenue is expected to experience significant growth across various regions. In 2023, the market value is 12.92 USD Billion, with North America dominating the landscape, holding a value of 5.5 USD Billion, projected to reach 40.0 USD Billion by 2032. Europe follows with a valuation of 3.5 USD Billion in 2023, expected to expand to 25.0 USD Billion by 2032, showcasing its prominent position in the market.

    The APAC region, valued at 2.5 USD Billion in 2023, is set to grow to 20.0 USD Billion by 2032, reflecting increasing demand and technological advancements.South America and MEA are comparatively smaller, starting at 0.75 USD Billion and 0.67 USD Billion in 2023, with forecasts of 7.0 USD Billion and 8.0 USD Billion, respectively, by 2032. The majority holding of the North American and European regions can be attributed to a robust technological infrastructure and investment in innovation, which drives growth in the Mixed Reality Market industry.

    The market growth is influenced by trends in gaming, education, and training, as well as the expansion of the digital realm. However, challenges related to high implementation costs and technology adoption rates persist, presenting a mix of opportunities and hurdles for stakeholders navigating the Mixed Reality Market segmentation.

    Mixed Reality Market Regional Insights

    Source: Primary Research, Secondary Research, Market Research Future Database and Analyst Review

    Key Players and Competitive Insights

    The Mixed Reality Market is rapidly evolving as technology advances and capabilities expand, leading to significant competitive dynamics among various players. Companies operating in this sector are increasingly focusing on innovation, user experience, and the development of immersive environments, which are crucial for maintaining a competitive edge. As mixed reality combines elements of both augmented reality and virtual reality, it opens up a wide range of applications across industries, including gaming, education, healthcare, and enterprise solutions.

    The competitive landscape is characterized by a mix of established technology giants and nimble startups that are constantly striving to push the boundaries of what mixed reality can achieve. This competitive environment is fueled by significant investment in research and development, strategic partnerships, and mergers and acquisitions that aim to leverage complementary strengths and technologies.Samsung holds a prominent position in the Mixed Reality Market, leveraging its extensive experience in display technology and consumer electronics. The company has established a strong market presence due to its commitment to developing high-quality hardware that enhances the mixed reality experience.

    Samsung has successfully integrated its advanced display technologies into mixed reality devices, allowing for high-resolution visuals and immersive experiences. The strengths of Samsung lie in its robust supply chain, global brand recognition, and significant research and development capabilities.

    Additionally, the company’s efforts to create a seamless ecosystem for mixed reality experiences through collaboration with software developers further solidify its competitive positioning in this market, enabling users to enjoy an expansive range of applications that cater to both entertainment and practical use cases.HTC is another significant player in the Mixed Reality Market, focusing on delivering high-performance mixed reality solutions that cater to a variety of market segments. With a history rooted in innovation, HTC has developed a range of mixed reality devices that emphasize user experience and immersive interaction.

    The company has positioned itself as a leader in both hardware and software solutions, contributing to an ecosystem that fosters creativity and productivity. HTC's strengths include its commitment to research and development, which drives the introduction of groundbreaking technologies that enhance the mixed reality experience. The company also emphasizes its partnerships with content creators and developers to ensure that users have access to a rich library of applications and experiences.

    HTC's focus on community-building through developer programs and events has also bolstered its presence in the mixed reality space, allowing for collaborative innovation that keeps it at the forefront of market trends.

    Key Companies in the Mixed Reality Market market include

    Industry Developments

    Recent developments in the Mixed Reality Market have seen significant advancements from major companies such as Microsoft, Apple, and Meta (formerly Facebook), focusing on enhancing user experience and technology integration. Microsoft has ramped up investments in its HoloLens line, while Apple is reportedly gearing up for the launch of its augmented reality headset, which has garnered considerable industry attention. HTC continues to innovate with its Vive platform, targeting enterprise applications and immersive experiences. Meanwhile, Pimax and Varjo are pushing the boundaries of high-resolution displays for immersive gaming and professional use.

    In current affairs, Sony has introduced new features for its PlayStation VR platform, aiming to captivate gamers amid growing competition.

    Additionally, Snap has been innovating with augmented reality features to keep engagement high on its platform. Recent mergers and acquisitions have been noticeable, with Unity Technologies expanding its portfolio through strategic acquisitions to bolster its mixed reality capabilities. The mixed reality market's valuation is on the rise, leading to increased competition and investment, reflecting the growing significance of immersive technologies in various sectors, from entertainment to professional training.

    Future Outlook

    Mixed Reality Market Future Outlook

    <p>The Mixed Reality Market is poised for substantial growth, driven by technological advancements and increased adoption, with a projected 25.54% CAGR from 2024 to 2035.</p>

    New opportunities lie in:

    • <p>Development of enterprise training solutions leveraging mixed reality technology.</p>
    • <p>Integration of mixed reality in remote collaboration tools for enhanced productivity.</p>
    • <p>Creation of immersive marketing experiences for consumer engagement and brand loyalty.</p>

    <p>By 2035, the Mixed Reality Market is expected to be a pivotal sector, reflecting robust growth and innovation.</p>

    Market Segmentation

    Mixed Reality Market End Use Outlook

    • Consumer
    • Commercial
    • Industrial

    Mixed Reality Market Technology Outlook

    • Hardware-based
    • Software-based
    • Mixed Reality as a Service

    Mixed Reality Market Application Outlook

    • Gaming
    • Healthcare
    • Education
    • Retail
    • Real Estate

    Mixed Reality Market Device Type Outlook

    • Head-mounted Display
    • Smart Glasses
    • Smart Phones
    • Tablets

    Report Scope

    MARKET SIZE 202416.22(USD Billion)
    MARKET SIZE 202520.36(USD Billion)
    MARKET SIZE 2035197.99(USD Billion)
    COMPOUND ANNUAL GROWTH RATE (CAGR)25.54% (2024 - 2035)
    REPORT COVERAGERevenue Forecast, Competitive Landscape, Growth Factors, and Trends
    BASE YEAR2024
    Market Forecast Period2025 - 2035
    Historical Data2019 - 2024
    Market Forecast UnitsUSD Billion
    Key Companies ProfiledMarket analysis in progress
    Segments CoveredMarket segmentation analysis in progress
    Key Market OpportunitiesIntegration of artificial intelligence enhances user experiences in the Mixed Reality Market.
    Key Market DynamicsTechnological advancements and consumer demand drive rapid innovation and competition in the Mixed Reality Market.
    Countries CoveredNorth America, Europe, APAC, South America, MEA

    FAQs

    What is the projected market valuation of the Mixed Reality Market by 2035?

    The Mixed Reality Market is projected to reach a valuation of 197.99 USD Billion by 2035.

    What was the market valuation of the Mixed Reality Market in 2024?

    In 2024, the overall market valuation was 16.22 USD Billion.

    What is the expected CAGR for the Mixed Reality Market during the forecast period 2025 - 2035?

    The expected CAGR for the Mixed Reality Market during the forecast period 2025 - 2035 is 25.54%.

    Which application segment is projected to have the highest valuation by 2035?

    The Retail application segment is projected to reach a valuation of 50.0 USD Billion by 2035.

    What are the key players in the Mixed Reality Market?

    Key players in the Mixed Reality Market include Microsoft, Meta Platforms, Apple, Google, NVIDIA, Sony, Samsung, Magic Leap, and PTC.

    How does the valuation of the Healthcare segment compare to others by 2035?

    The Healthcare segment is projected to reach 40.0 USD Billion by 2035, indicating strong growth compared to other segments.

    What is the projected valuation for the Software-based technology segment by 2035?

    The Software-based technology segment is projected to reach a valuation of 79.99 USD Billion by 2035.

    Which device type is expected to dominate the Mixed Reality Market by 2035?

    The Head-mounted Display device type is expected to dominate with a projected valuation of 58.0 USD Billion by 2035.

    What is the projected valuation for the Industrial end-use segment by 2035?

    The Industrial end-use segment is projected to reach a valuation of 59.01 USD Billion by 2035.

    How does the Mixed Reality as a Service segment compare to other technology segments by 2035?

    The Mixed Reality as a Service segment is projected to reach 58.01 USD Billion by 2035, indicating competitive growth within the technology segments.

    1. SECTION I: EXECUTIVE SUMMARY AND KEY HIGHLIGHTS
      1. EXECUTIVE SUMMARY
        1. Market Overview
        2. Key Findings
        3. Market Segmentation
        4. Competitive Landscape
        5. Challenges and Opportunities
        6. Future Outlook
    2. SECTION II: SCOPING, METHODOLOGY AND MARKET STRUCTURE
      1. MARKET INTRODUCTION
        1. Definition
        2. Scope of the study
      2. RESEARCH METHODOLOGY
        1. Overview
        2. Data Mining
        3. Secondary Research
        4. Primary Research
        5. Forecasting Model
        6. Market Size Estimation
        7. Data Triangulation
        8. Validation
    3. SECTION III: QUALITATIVE ANALYSIS
      1. MARKET DYNAMICS
        1. Overview
        2. Drivers
        3. Restraints
        4. Opportunities
      2. MARKET FACTOR ANALYSIS
        1. Value chain Analysis
        2. Porter's Five Forces Analysis
        3. COVID-19 Impact Analysis
    4. SECTION IV: QUANTITATIVE ANALYSIS
      1. Information and Communications Technology, BY Application (USD Billion)
        1. Gaming
        2. Healthcare
        3. Education
        4. Retail
        5. Real Estate
      2. Information and Communications Technology, BY Technology (USD Billion)
        1. Hardware-based
        2. Software-based
        3. Mixed Reality as a Service
      3. Information and Communications Technology, BY End Use (USD Billion)
        1. Consumer
        2. Commercial
        3. Industrial
      4. Information and Communications Technology, BY Device Type (USD Billion)
        1. Head-mounted Display
        2. Smart Glasses
        3. Smart Phones
        4. Tablets
      5. Information and Communications Technology, BY Region (USD Billion)
        1. North America
        2. Europe
        3. APAC
        4. South America
        5. MEA
    5. SECTION V: COMPETITIVE ANALYSIS
      1. Competitive Landscape
        1. Overview
        2. Competitive Analysis
        3. Market share Analysis
        4. Major Growth Strategy in the Information and Communications Technology
        5. Competitive Benchmarking
        6. Leading Players in Terms of Number of Developments in the Information and Communications Technology
        7. Key developments and growth strategies
        8. Major Players Financial Matrix
      2. Company Profiles
        1. Microsoft (US)
        2. Meta Platforms (US)
        3. Apple (US)
        4. Google (US)
        5. NVIDIA (US)
        6. Sony (JP)
        7. Samsung (KR)
        8. Magic Leap (US)
        9. PTC (US)
      3. Appendix
        1. References
        2. Related Reports
    6. LIST OF FIGURES
      1. MARKET SYNOPSIS
      2. NORTH AMERICA MARKET ANALYSIS
      3. US MARKET ANALYSIS BY APPLICATION
      4. US MARKET ANALYSIS BY TECHNOLOGY
      5. US MARKET ANALYSIS BY END USE
      6. US MARKET ANALYSIS BY DEVICE TYPE
      7. CANADA MARKET ANALYSIS BY APPLICATION
      8. CANADA MARKET ANALYSIS BY TECHNOLOGY
      9. CANADA MARKET ANALYSIS BY END USE
      10. CANADA MARKET ANALYSIS BY DEVICE TYPE
      11. EUROPE MARKET ANALYSIS
      12. GERMANY MARKET ANALYSIS BY APPLICATION
      13. GERMANY MARKET ANALYSIS BY TECHNOLOGY
      14. GERMANY MARKET ANALYSIS BY END USE
      15. GERMANY MARKET ANALYSIS BY DEVICE TYPE
      16. UK MARKET ANALYSIS BY APPLICATION
      17. UK MARKET ANALYSIS BY TECHNOLOGY
      18. UK MARKET ANALYSIS BY END USE
      19. UK MARKET ANALYSIS BY DEVICE TYPE
      20. FRANCE MARKET ANALYSIS BY APPLICATION
      21. FRANCE MARKET ANALYSIS BY TECHNOLOGY
      22. FRANCE MARKET ANALYSIS BY END USE
      23. FRANCE MARKET ANALYSIS BY DEVICE TYPE
      24. RUSSIA MARKET ANALYSIS BY APPLICATION
      25. RUSSIA MARKET ANALYSIS BY TECHNOLOGY
      26. RUSSIA MARKET ANALYSIS BY END USE
      27. RUSSIA MARKET ANALYSIS BY DEVICE TYPE
      28. ITALY MARKET ANALYSIS BY APPLICATION
      29. ITALY MARKET ANALYSIS BY TECHNOLOGY
      30. ITALY MARKET ANALYSIS BY END USE
      31. ITALY MARKET ANALYSIS BY DEVICE TYPE
      32. SPAIN MARKET ANALYSIS BY APPLICATION
      33. SPAIN MARKET ANALYSIS BY TECHNOLOGY
      34. SPAIN MARKET ANALYSIS BY END USE
      35. SPAIN MARKET ANALYSIS BY DEVICE TYPE
      36. REST OF EUROPE MARKET ANALYSIS BY APPLICATION
      37. REST OF EUROPE MARKET ANALYSIS BY TECHNOLOGY
      38. REST OF EUROPE MARKET ANALYSIS BY END USE
      39. REST OF EUROPE MARKET ANALYSIS BY DEVICE TYPE
      40. APAC MARKET ANALYSIS
      41. CHINA MARKET ANALYSIS BY APPLICATION
      42. CHINA MARKET ANALYSIS BY TECHNOLOGY
      43. CHINA MARKET ANALYSIS BY END USE
      44. CHINA MARKET ANALYSIS BY DEVICE TYPE
      45. INDIA MARKET ANALYSIS BY APPLICATION
      46. INDIA MARKET ANALYSIS BY TECHNOLOGY
      47. INDIA MARKET ANALYSIS BY END USE
      48. INDIA MARKET ANALYSIS BY DEVICE TYPE
      49. JAPAN MARKET ANALYSIS BY APPLICATION
      50. JAPAN MARKET ANALYSIS BY TECHNOLOGY
      51. JAPAN MARKET ANALYSIS BY END USE
      52. JAPAN MARKET ANALYSIS BY DEVICE TYPE
      53. SOUTH KOREA MARKET ANALYSIS BY APPLICATION
      54. SOUTH KOREA MARKET ANALYSIS BY TECHNOLOGY
      55. SOUTH KOREA MARKET ANALYSIS BY END USE
      56. SOUTH KOREA MARKET ANALYSIS BY DEVICE TYPE
      57. MALAYSIA MARKET ANALYSIS BY APPLICATION
      58. MALAYSIA MARKET ANALYSIS BY TECHNOLOGY
      59. MALAYSIA MARKET ANALYSIS BY END USE
      60. MALAYSIA MARKET ANALYSIS BY DEVICE TYPE
      61. THAILAND MARKET ANALYSIS BY APPLICATION
      62. THAILAND MARKET ANALYSIS BY TECHNOLOGY
      63. THAILAND MARKET ANALYSIS BY END USE
      64. THAILAND MARKET ANALYSIS BY DEVICE TYPE
      65. INDONESIA MARKET ANALYSIS BY APPLICATION
      66. INDONESIA MARKET ANALYSIS BY TECHNOLOGY
      67. INDONESIA MARKET ANALYSIS BY END USE
      68. INDONESIA MARKET ANALYSIS BY DEVICE TYPE
      69. REST OF APAC MARKET ANALYSIS BY APPLICATION
      70. REST OF APAC MARKET ANALYSIS BY TECHNOLOGY
      71. REST OF APAC MARKET ANALYSIS BY END USE
      72. REST OF APAC MARKET ANALYSIS BY DEVICE TYPE
      73. SOUTH AMERICA MARKET ANALYSIS
      74. BRAZIL MARKET ANALYSIS BY APPLICATION
      75. BRAZIL MARKET ANALYSIS BY TECHNOLOGY
      76. BRAZIL MARKET ANALYSIS BY END USE
      77. BRAZIL MARKET ANALYSIS BY DEVICE TYPE
      78. MEXICO MARKET ANALYSIS BY APPLICATION
      79. MEXICO MARKET ANALYSIS BY TECHNOLOGY
      80. MEXICO MARKET ANALYSIS BY END USE
      81. MEXICO MARKET ANALYSIS BY DEVICE TYPE
      82. ARGENTINA MARKET ANALYSIS BY APPLICATION
      83. ARGENTINA MARKET ANALYSIS BY TECHNOLOGY
      84. ARGENTINA MARKET ANALYSIS BY END USE
      85. ARGENTINA MARKET ANALYSIS BY DEVICE TYPE
      86. REST OF SOUTH AMERICA MARKET ANALYSIS BY APPLICATION
      87. REST OF SOUTH AMERICA MARKET ANALYSIS BY TECHNOLOGY
      88. REST OF SOUTH AMERICA MARKET ANALYSIS BY END USE
      89. REST OF SOUTH AMERICA MARKET ANALYSIS BY DEVICE TYPE
      90. MEA MARKET ANALYSIS
      91. GCC COUNTRIES MARKET ANALYSIS BY APPLICATION
      92. GCC COUNTRIES MARKET ANALYSIS BY TECHNOLOGY
      93. GCC COUNTRIES MARKET ANALYSIS BY END USE
      94. GCC COUNTRIES MARKET ANALYSIS BY DEVICE TYPE
      95. SOUTH AFRICA MARKET ANALYSIS BY APPLICATION
      96. SOUTH AFRICA MARKET ANALYSIS BY TECHNOLOGY
      97. SOUTH AFRICA MARKET ANALYSIS BY END USE
      98. SOUTH AFRICA MARKET ANALYSIS BY DEVICE TYPE
      99. REST OF MEA MARKET ANALYSIS BY APPLICATION
      100. REST OF MEA MARKET ANALYSIS BY TECHNOLOGY
      101. REST OF MEA MARKET ANALYSIS BY END USE
      102. REST OF MEA MARKET ANALYSIS BY DEVICE TYPE
      103. KEY BUYING CRITERIA OF INFORMATION AND COMMUNICATIONS TECHNOLOGY
      104. RESEARCH PROCESS OF MRFR
      105. DRO ANALYSIS OF INFORMATION AND COMMUNICATIONS TECHNOLOGY
      106. DRIVERS IMPACT ANALYSIS: INFORMATION AND COMMUNICATIONS TECHNOLOGY
      107. RESTRAINTS IMPACT ANALYSIS: INFORMATION AND COMMUNICATIONS TECHNOLOGY
      108. SUPPLY / VALUE CHAIN: INFORMATION AND COMMUNICATIONS TECHNOLOGY
      109. INFORMATION AND COMMUNICATIONS TECHNOLOGY, BY APPLICATION, 2024 (% SHARE)
      110. INFORMATION AND COMMUNICATIONS TECHNOLOGY, BY APPLICATION, 2024 TO 2035 (USD Billion)
      111. INFORMATION AND COMMUNICATIONS TECHNOLOGY, BY TECHNOLOGY, 2024 (% SHARE)
      112. INFORMATION AND COMMUNICATIONS TECHNOLOGY, BY TECHNOLOGY, 2024 TO 2035 (USD Billion)
      113. INFORMATION AND COMMUNICATIONS TECHNOLOGY, BY END USE, 2024 (% SHARE)
      114. INFORMATION AND COMMUNICATIONS TECHNOLOGY, BY END USE, 2024 TO 2035 (USD Billion)
      115. INFORMATION AND COMMUNICATIONS TECHNOLOGY, BY DEVICE TYPE, 2024 (% SHARE)
      116. INFORMATION AND COMMUNICATIONS TECHNOLOGY, BY DEVICE TYPE, 2024 TO 2035 (USD Billion)
      117. BENCHMARKING OF MAJOR COMPETITORS
    7. LIST OF TABLES
      1. LIST OF ASSUMPTIONS
      2. 7.1.1
      3. North America MARKET SIZE ESTIMATES; FORECAST
        1. BY APPLICATION, 2025-2035 (USD Billion)
        2. BY TECHNOLOGY, 2025-2035 (USD Billion)
        3. BY END USE, 2025-2035 (USD Billion)
        4. BY DEVICE TYPE, 2025-2035 (USD Billion)
      4. US MARKET SIZE ESTIMATES; FORECAST
        1. BY APPLICATION, 2025-2035 (USD Billion)
        2. BY TECHNOLOGY, 2025-2035 (USD Billion)
        3. BY END USE, 2025-2035 (USD Billion)
        4. BY DEVICE TYPE, 2025-2035 (USD Billion)
      5. Canada MARKET SIZE ESTIMATES; FORECAST
        1. BY APPLICATION, 2025-2035 (USD Billion)
        2. BY TECHNOLOGY, 2025-2035 (USD Billion)
        3. BY END USE, 2025-2035 (USD Billion)
        4. BY DEVICE TYPE, 2025-2035 (USD Billion)
      6. Europe MARKET SIZE ESTIMATES; FORECAST
        1. BY APPLICATION, 2025-2035 (USD Billion)
        2. BY TECHNOLOGY, 2025-2035 (USD Billion)
        3. BY END USE, 2025-2035 (USD Billion)
        4. BY DEVICE TYPE, 2025-2035 (USD Billion)
      7. Germany MARKET SIZE ESTIMATES; FORECAST
        1. BY APPLICATION, 2025-2035 (USD Billion)
        2. BY TECHNOLOGY, 2025-2035 (USD Billion)
        3. BY END USE, 2025-2035 (USD Billion)
        4. BY DEVICE TYPE, 2025-2035 (USD Billion)
      8. UK MARKET SIZE ESTIMATES; FORECAST
        1. BY APPLICATION, 2025-2035 (USD Billion)
        2. BY TECHNOLOGY, 2025-2035 (USD Billion)
        3. BY END USE, 2025-2035 (USD Billion)
        4. BY DEVICE TYPE, 2025-2035 (USD Billion)
      9. France MARKET SIZE ESTIMATES; FORECAST
        1. BY APPLICATION, 2025-2035 (USD Billion)
        2. BY TECHNOLOGY, 2025-2035 (USD Billion)
        3. BY END USE, 2025-2035 (USD Billion)
        4. BY DEVICE TYPE, 2025-2035 (USD Billion)
      10. Russia MARKET SIZE ESTIMATES; FORECAST
        1. BY APPLICATION, 2025-2035 (USD Billion)
        2. BY TECHNOLOGY, 2025-2035 (USD Billion)
        3. BY END USE, 2025-2035 (USD Billion)
        4. BY DEVICE TYPE, 2025-2035 (USD Billion)
      11. Italy MARKET SIZE ESTIMATES; FORECAST
        1. BY APPLICATION, 2025-2035 (USD Billion)
        2. BY TECHNOLOGY, 2025-2035 (USD Billion)
        3. BY END USE, 2025-2035 (USD Billion)
        4. BY DEVICE TYPE, 2025-2035 (USD Billion)
      12. Spain MARKET SIZE ESTIMATES; FORECAST
        1. BY APPLICATION, 2025-2035 (USD Billion)
        2. BY TECHNOLOGY, 2025-2035 (USD Billion)
        3. BY END USE, 2025-2035 (USD Billion)
        4. BY DEVICE TYPE, 2025-2035 (USD Billion)
      13. Rest of Europe MARKET SIZE ESTIMATES; FORECAST
        1. BY APPLICATION, 2025-2035 (USD Billion)
        2. BY TECHNOLOGY, 2025-2035 (USD Billion)
        3. BY END USE, 2025-2035 (USD Billion)
        4. BY DEVICE TYPE, 2025-2035 (USD Billion)
      14. APAC MARKET SIZE ESTIMATES; FORECAST
        1. BY APPLICATION, 2025-2035 (USD Billion)
        2. BY TECHNOLOGY, 2025-2035 (USD Billion)
        3. BY END USE, 2025-2035 (USD Billion)
        4. BY DEVICE TYPE, 2025-2035 (USD Billion)
      15. China MARKET SIZE ESTIMATES; FORECAST
        1. BY APPLICATION, 2025-2035 (USD Billion)
        2. BY TECHNOLOGY, 2025-2035 (USD Billion)
        3. BY END USE, 2025-2035 (USD Billion)
        4. BY DEVICE TYPE, 2025-2035 (USD Billion)
      16. India MARKET SIZE ESTIMATES; FORECAST
        1. BY APPLICATION, 2025-2035 (USD Billion)
        2. BY TECHNOLOGY, 2025-2035 (USD Billion)
        3. BY END USE, 2025-2035 (USD Billion)
        4. BY DEVICE TYPE, 2025-2035 (USD Billion)
      17. Japan MARKET SIZE ESTIMATES; FORECAST
        1. BY APPLICATION, 2025-2035 (USD Billion)
        2. BY TECHNOLOGY, 2025-2035 (USD Billion)
        3. BY END USE, 2025-2035 (USD Billion)
        4. BY DEVICE TYPE, 2025-2035 (USD Billion)
      18. South Korea MARKET SIZE ESTIMATES; FORECAST
        1. BY APPLICATION, 2025-2035 (USD Billion)
        2. BY TECHNOLOGY, 2025-2035 (USD Billion)
        3. BY END USE, 2025-2035 (USD Billion)
        4. BY DEVICE TYPE, 2025-2035 (USD Billion)
      19. Malaysia MARKET SIZE ESTIMATES; FORECAST
        1. BY APPLICATION, 2025-2035 (USD Billion)
        2. BY TECHNOLOGY, 2025-2035 (USD Billion)
        3. BY END USE, 2025-2035 (USD Billion)
        4. BY DEVICE TYPE, 2025-2035 (USD Billion)
      20. Thailand MARKET SIZE ESTIMATES; FORECAST
        1. BY APPLICATION, 2025-2035 (USD Billion)
        2. BY TECHNOLOGY, 2025-2035 (USD Billion)
        3. BY END USE, 2025-2035 (USD Billion)
        4. BY DEVICE TYPE, 2025-2035 (USD Billion)
      21. Indonesia MARKET SIZE ESTIMATES; FORECAST
        1. BY APPLICATION, 2025-2035 (USD Billion)
        2. BY TECHNOLOGY, 2025-2035 (USD Billion)
        3. BY END USE, 2025-2035 (USD Billion)
        4. BY DEVICE TYPE, 2025-2035 (USD Billion)
      22. Rest of APAC MARKET SIZE ESTIMATES; FORECAST
        1. BY APPLICATION, 2025-2035 (USD Billion)
        2. BY TECHNOLOGY, 2025-2035 (USD Billion)
        3. BY END USE, 2025-2035 (USD Billion)
        4. BY DEVICE TYPE, 2025-2035 (USD Billion)
      23. South America MARKET SIZE ESTIMATES; FORECAST
        1. BY APPLICATION, 2025-2035 (USD Billion)
        2. BY TECHNOLOGY, 2025-2035 (USD Billion)
        3. BY END USE, 2025-2035 (USD Billion)
        4. BY DEVICE TYPE, 2025-2035 (USD Billion)
      24. Brazil MARKET SIZE ESTIMATES; FORECAST
        1. BY APPLICATION, 2025-2035 (USD Billion)
        2. BY TECHNOLOGY, 2025-2035 (USD Billion)
        3. BY END USE, 2025-2035 (USD Billion)
        4. BY DEVICE TYPE, 2025-2035 (USD Billion)
      25. Mexico MARKET SIZE ESTIMATES; FORECAST
        1. BY APPLICATION, 2025-2035 (USD Billion)
        2. BY TECHNOLOGY, 2025-2035 (USD Billion)
        3. BY END USE, 2025-2035 (USD Billion)
        4. BY DEVICE TYPE, 2025-2035 (USD Billion)
      26. Argentina MARKET SIZE ESTIMATES; FORECAST
        1. BY APPLICATION, 2025-2035 (USD Billion)
        2. BY TECHNOLOGY, 2025-2035 (USD Billion)
        3. BY END USE, 2025-2035 (USD Billion)
        4. BY DEVICE TYPE, 2025-2035 (USD Billion)
      27. Rest of South America MARKET SIZE ESTIMATES; FORECAST
        1. BY APPLICATION, 2025-2035 (USD Billion)
        2. BY TECHNOLOGY, 2025-2035 (USD Billion)
        3. BY END USE, 2025-2035 (USD Billion)
        4. BY DEVICE TYPE, 2025-2035 (USD Billion)
      28. MEA MARKET SIZE ESTIMATES; FORECAST
        1. BY APPLICATION, 2025-2035 (USD Billion)
        2. BY TECHNOLOGY, 2025-2035 (USD Billion)
        3. BY END USE, 2025-2035 (USD Billion)
        4. BY DEVICE TYPE, 2025-2035 (USD Billion)
      29. GCC Countries MARKET SIZE ESTIMATES; FORECAST
        1. BY APPLICATION, 2025-2035 (USD Billion)
        2. BY TECHNOLOGY, 2025-2035 (USD Billion)
        3. BY END USE, 2025-2035 (USD Billion)
        4. BY DEVICE TYPE, 2025-2035 (USD Billion)
      30. South Africa MARKET SIZE ESTIMATES; FORECAST
        1. BY APPLICATION, 2025-2035 (USD Billion)
        2. BY TECHNOLOGY, 2025-2035 (USD Billion)
        3. BY END USE, 2025-2035 (USD Billion)
        4. BY DEVICE TYPE, 2025-2035 (USD Billion)
      31. Rest of MEA MARKET SIZE ESTIMATES; FORECAST
        1. BY APPLICATION, 2025-2035 (USD Billion)
        2. BY TECHNOLOGY, 2025-2035 (USD Billion)
        3. BY END USE, 2025-2035 (USD Billion)
        4. BY DEVICE TYPE, 2025-2035 (USD Billion)
      32. PRODUCT LAUNCH/PRODUCT DEVELOPMENT/APPROVAL
      33. 7.31.1
      34. ACQUISITION/PARTNERSHIP
      35. 7.32.1

    Mixed Reality Market Segmentation


    Mixed Reality Market By Application (USD Billion, 2019-2032)

    Gaming

    Healthcare

    Education

    Retail

    Real Estate


    Mixed Reality Market By Technology (USD Billion, 2019-2032)

    Hardware-based

    Software-based

    Mixed Reality as a Service


    Mixed Reality Market By End Use (USD Billion, 2019-2032)

    Consumer

    Commercial

    Industrial


    Mixed Reality Market By Device Type (USD Billion, 2019-2032)

    Head-mounted Display

    Smart Glasses

    Smart Phones

    Tablets


    Mixed Reality Market By Regional (USD Billion, 2019-2032)

    North America

    Europe

    South America

    Asia Pacific

    Middle East and Africa


    Mixed Reality Market Regional Outlook (USD Billion, 2019-2032)


    North America Outlook (USD Billion, 2019-2032)

    North America Mixed Reality Market by Application Type

    Gaming

    Healthcare

    Education

    Retail

    Real Estate

    North America Mixed Reality Market by Technology Type

    Hardware-based

    Software-based

    Mixed Reality as a Service

    North America Mixed Reality Market by End Use Type

    Consumer

    Commercial

    Industrial

    North America Mixed Reality Market by Device Type

    Head-mounted Display

    Smart Glasses

    Smart Phones

    Tablets

    North America Mixed Reality Market by Regional Type

    US

    Canada

    US Outlook (USD Billion, 2019-2032)

    US Mixed Reality Market by Application Type

    Gaming

    Healthcare

    Education

    Retail

    Real Estate

    US Mixed Reality Market by Technology Type

    Hardware-based

    Software-based

    Mixed Reality as a Service

    US Mixed Reality Market by End Use Type

    Consumer

    Commercial

    Industrial

    US Mixed Reality Market by Device Type

    Head-mounted Display

    Smart Glasses

    Smart Phones

    Tablets
    CANADA Outlook (USD Billion, 2019-2032)

    CANADA Mixed Reality Market by Application Type

    Gaming

    Healthcare

    Education

    Retail

    Real Estate

    CANADA Mixed Reality Market by Technology Type

    Hardware-based

    Software-based

    Mixed Reality as a Service

    CANADA Mixed Reality Market by End Use Type

    Consumer

    Commercial

    Industrial

    CANADA Mixed Reality Market by Device Type

    Head-mounted Display

    Smart Glasses

    Smart Phones

    Tablets

    Europe Outlook (USD Billion, 2019-2032)

    Europe Mixed Reality Market by Application Type

    Gaming

    Healthcare

    Education

    Retail

    Real Estate

    Europe Mixed Reality Market by Technology Type

    Hardware-based

    Software-based

    Mixed Reality as a Service

    Europe Mixed Reality Market by End Use Type

    Consumer

    Commercial

    Industrial

    Europe Mixed Reality Market by Device Type

    Head-mounted Display

    Smart Glasses

    Smart Phones

    Tablets

    Europe Mixed Reality Market by Regional Type

    Germany

    UK

    France

    Russia

    Italy

    Spain

    Rest of Europe

    GERMANY Outlook (USD Billion, 2019-2032)

    GERMANY Mixed Reality Market by Application Type

    Gaming

    Healthcare

    Education

    Retail

    Real Estate

    GERMANY Mixed Reality Market by Technology Type

    Hardware-based

    Software-based

    Mixed Reality as a Service

    GERMANY Mixed Reality Market by End Use Type

    Consumer

    Commercial

    Industrial

    GERMANY Mixed Reality Market by Device Type

    Head-mounted Display

    Smart Glasses

    Smart Phones

    Tablets

    UK Outlook (USD Billion, 2019-2032)

    UK Mixed Reality Market by Application Type

    Gaming

    Healthcare

    Education

    Retail

    Real Estate

    UK Mixed Reality Market by Technology Type

    Hardware-based

    Software-based

    Mixed Reality as a Service

    UK Mixed Reality Market by End Use Type

    Consumer

    Commercial

    Industrial

    UK Mixed Reality Market by Device Type

    Head-mounted Display

    Smart Glasses

    Smart Phones

    Tablets

    FRANCE Outlook (USD Billion, 2019-2032)

    FRANCE Mixed Reality Market by Application Type

    Gaming

    Healthcare

    Education

    Retail

    Real Estate

    FRANCE Mixed Reality Market by Technology Type

    Hardware-based

    Software-based

    Mixed Reality as a Service

    FRANCE Mixed Reality Market by End Use Type

    Consumer

    Commercial

    Industrial

    FRANCE Mixed Reality Market by Device Type

    Head-mounted Display

    Smart Glasses

    Smart Phones

    Tablets

    RUSSIA Outlook (USD Billion, 2019-2032)

    RUSSIA Mixed Reality Market by Application Type

    Gaming

    Healthcare

    Education

    Retail

    Real Estate

    RUSSIA Mixed Reality Market by Technology Type

    Hardware-based

    Software-based

    Mixed Reality as a Service

    RUSSIA Mixed Reality Market by End Use Type

    Consumer

    Commercial

    Industrial

    RUSSIA Mixed Reality Market by Device Type

    Head-mounted Display

    Smart Glasses

    Smart Phones

    Tablets

    ITALY Outlook (USD Billion, 2019-2032)

    ITALY Mixed Reality Market by Application Type

    Gaming

    Healthcare

    Education

    Retail

    Real Estate

    ITALY Mixed Reality Market by Technology Type

    Hardware-based

    Software-based

    Mixed Reality as a Service

    ITALY Mixed Reality Market by End Use Type

    Consumer

    Commercial

    Industrial

    ITALY Mixed Reality Market by Device Type

    Head-mounted Display

    Smart Glasses

    Smart Phones

    Tablets

    SPAIN Outlook (USD Billion, 2019-2032)

    SPAIN Mixed Reality Market by Application Type

    Gaming

    Healthcare

    Education

    Retail

    Real Estate

    SPAIN Mixed Reality Market by Technology Type

    Hardware-based

    Software-based

    Mixed Reality as a Service

    SPAIN Mixed Reality Market by End Use Type

    Consumer

    Commercial

    Industrial

    SPAIN Mixed Reality Market by Device Type

    Head-mounted Display

    Smart Glasses

    Smart Phones

    Tablets

    REST OF EUROPE Outlook (USD Billion, 2019-2032)

    REST OF EUROPE Mixed Reality Market by Application Type

    Gaming

    Healthcare

    Education

    Retail

    Real Estate

    REST OF EUROPE Mixed Reality Market by Technology Type

    Hardware-based

    Software-based

    Mixed Reality as a Service

    REST OF EUROPE Mixed Reality Market by End Use Type

    Consumer

    Commercial

    Industrial

    REST OF EUROPE Mixed Reality Market by Device Type

    Head-mounted Display

    Smart Glasses

    Smart Phones

    Tablets

    APAC Outlook (USD Billion, 2019-2032)

    APAC Mixed Reality Market by Application Type

    Gaming

    Healthcare

    Education

    Retail

    Real Estate

    APAC Mixed Reality Market by Technology Type

    Hardware-based

    Software-based

    Mixed Reality as a Service

    APAC Mixed Reality Market by End Use Type

    Consumer

    Commercial

    Industrial

    APAC Mixed Reality Market by Device Type

    Head-mounted Display

    Smart Glasses

    Smart Phones

    Tablets

    APAC Mixed Reality Market by Regional Type

    China

    India

    Japan

    South Korea

    Malaysia

    Thailand

    Indonesia

    Rest of APAC

    CHINA Outlook (USD Billion, 2019-2032)

    CHINA Mixed Reality Market by Application Type

    Gaming

    Healthcare

    Education

    Retail

    Real Estate

    CHINA Mixed Reality Market by Technology Type

    Hardware-based

    Software-based

    Mixed Reality as a Service

    CHINA Mixed Reality Market by End Use Type

    Consumer

    Commercial

    Industrial

    CHINA Mixed Reality Market by Device Type

    Head-mounted Display

    Smart Glasses

    Smart Phones

    Tablets

    INDIA Outlook (USD Billion, 2019-2032)

    INDIA Mixed Reality Market by Application Type

    Gaming

    Healthcare

    Education

    Retail

    Real Estate

    INDIA Mixed Reality Market by Technology Type

    Hardware-based

    Software-based

    Mixed Reality as a Service

    INDIA Mixed Reality Market by End Use Type

    Consumer

    Commercial

    Industrial

    INDIA Mixed Reality Market by Device Type

    Head-mounted Display

    Smart Glasses

    Smart Phones

    Tablets

    JAPAN Outlook (USD Billion, 2019-2032)

    JAPAN Mixed Reality Market by Application Type

    Gaming

    Healthcare

    Education

    Retail

    Real Estate

    JAPAN Mixed Reality Market by Technology Type

    Hardware-based

    Software-based

    Mixed Reality as a Service

    JAPAN Mixed Reality Market by End Use Type

    Consumer

    Commercial

    Industrial

    JAPAN Mixed Reality Market by Device Type

    Head-mounted Display

    Smart Glasses

    Smart Phones

    Tablets

    SOUTH KOREA Outlook (USD Billion, 2019-2032)

    SOUTH KOREA Mixed Reality Market by Application Type

    Gaming

    Healthcare

    Education

    Retail

    Real Estate

    SOUTH KOREA Mixed Reality Market by Technology Type

    Hardware-based

    Software-based

    Mixed Reality as a Service

    SOUTH KOREA Mixed Reality Market by End Use Type

    Consumer

    Commercial

    Industrial

    SOUTH KOREA Mixed Reality Market by Device Type

    Head-mounted Display

    Smart Glasses

    Smart Phones

    Tablets

    MALAYSIA Outlook (USD Billion, 2019-2032)

    MALAYSIA Mixed Reality Market by Application Type

    Gaming

    Healthcare

    Education

    Retail

    Real Estate

    MALAYSIA Mixed Reality Market by Technology Type

    Hardware-based

    Software-based

    Mixed Reality as a Service

    MALAYSIA Mixed Reality Market by End Use Type

    Consumer

    Commercial

    Industrial

    MALAYSIA Mixed Reality Market by Device Type

    Head-mounted Display

    Smart Glasses

    Smart Phones

    Tablets

    THAILAND Outlook (USD Billion, 2019-2032)

    THAILAND Mixed Reality Market by Application Type

    Gaming

    Healthcare

    Education

    Retail

    Real Estate

    THAILAND Mixed Reality Market by Technology Type

    Hardware-based

    Software-based

    Mixed Reality as a Service

    THAILAND Mixed Reality Market by End Use Type

    Consumer

    Commercial

    Industrial

    THAILAND Mixed Reality Market by Device Type

    Head-mounted Display

    Smart Glasses

    Smart Phones

    Tablets

    INDONESIA Outlook (USD Billion, 2019-2032)

    INDONESIA Mixed Reality Market by Application Type

    Gaming

    Healthcare

    Education

    Retail

    Real Estate

    INDONESIA Mixed Reality Market by Technology Type

    Hardware-based

    Software-based

    Mixed Reality as a Service

    INDONESIA Mixed Reality Market by End Use Type

    Consumer

    Commercial

    Industrial

    INDONESIA Mixed Reality Market by Device Type

    Head-mounted Display

    Smart Glasses

    Smart Phones

    Tablets

    REST OF APAC Outlook (USD Billion, 2019-2032)

    REST OF APAC Mixed Reality Market by Application Type

    Gaming

    Healthcare

    Education

    Retail

    Real Estate

    REST OF APAC Mixed Reality Market by Technology Type

    Hardware-based

    Software-based

    Mixed Reality as a Service

    REST OF APAC Mixed Reality Market by End Use Type

    Consumer

    Commercial

    Industrial

    REST OF APAC Mixed Reality Market by Device Type

    Head-mounted Display

    Smart Glasses

    Smart Phones

    Tablets

    South America Outlook (USD Billion, 2019-2032)

    South America Mixed Reality Market by Application Type

    Gaming

    Healthcare

    Education

    Retail

    Real Estate

    South America Mixed Reality Market by Technology Type

    Hardware-based

    Software-based

    Mixed Reality as a Service

    South America Mixed Reality Market by End Use Type

    Consumer

    Commercial

    Industrial

    South America Mixed Reality Market by Device Type

    Head-mounted Display

    Smart Glasses

    Smart Phones

    Tablets

    South America Mixed Reality Market by Regional Type

    Brazil

    Mexico

    Argentina

    Rest of South America

    BRAZIL Outlook (USD Billion, 2019-2032)

    BRAZIL Mixed Reality Market by Application Type

    Gaming

    Healthcare

    Education

    Retail

    Real Estate

    BRAZIL Mixed Reality Market by Technology Type

    Hardware-based

    Software-based

    Mixed Reality as a Service

    BRAZIL Mixed Reality Market by End Use Type

    Consumer

    Commercial

    Industrial

    BRAZIL Mixed Reality Market by Device Type

    Head-mounted Display

    Smart Glasses

    Smart Phones

    Tablets

    MEXICO Outlook (USD Billion, 2019-2032)

    MEXICO Mixed Reality Market by Application Type

    Gaming

    Healthcare

    Education

    Retail

    Real Estate

    MEXICO Mixed Reality Market by Technology Type

    Hardware-based

    Software-based

    Mixed Reality as a Service

    MEXICO Mixed Reality Market by End Use Type

    Consumer

    Commercial

    Industrial

    MEXICO Mixed Reality Market by Device Type

    Head-mounted Display

    Smart Glasses

    Smart Phones

    Tablets

    ARGENTINA Outlook (USD Billion, 2019-2032)

    ARGENTINA Mixed Reality Market by Application Type

    Gaming

    Healthcare

    Education

    Retail

    Real Estate

    ARGENTINA Mixed Reality Market by Technology Type

    Hardware-based

    Software-based

    Mixed Reality as a Service

    ARGENTINA Mixed Reality Market by End Use Type

    Consumer

    Commercial

    Industrial

    ARGENTINA Mixed Reality Market by Device Type

    Head-mounted Display

    Smart Glasses

    Smart Phones

    Tablets

    REST OF SOUTH AMERICA Outlook (USD Billion, 2019-2032)

    REST OF SOUTH AMERICA Mixed Reality Market by Application Type

    Gaming

    Healthcare

    Education

    Retail

    Real Estate

    REST OF SOUTH AMERICA Mixed Reality Market by Technology Type

    Hardware-based

    Software-based

    Mixed Reality as a Service

    REST OF SOUTH AMERICA Mixed Reality Market by End Use Type

    Consumer

    Commercial

    Industrial

    REST OF SOUTH AMERICA Mixed Reality Market by Device Type

    Head-mounted Display

    Smart Glasses

    Smart Phones

    Tablets

    MEA Outlook (USD Billion, 2019-2032)

    MEA Mixed Reality Market by Application Type

    Gaming

    Healthcare

    Education

    Retail

    Real Estate

    MEA Mixed Reality Market by Technology Type

    Hardware-based

    Software-based

    Mixed Reality as a Service

    MEA Mixed Reality Market by End Use Type

    Consumer

    Commercial

    Industrial

    MEA Mixed Reality Market by Device Type

    Head-mounted Display

    Smart Glasses

    Smart Phones

    Tablets

    MEA Mixed Reality Market by Regional Type

    GCC Countries

    South Africa

    Rest of MEA

    GCC COUNTRIES Outlook (USD Billion, 2019-2032)

    GCC COUNTRIES Mixed Reality Market by Application Type

    Gaming

    Healthcare

    Education

    Retail

    Real Estate

    GCC COUNTRIES Mixed Reality Market by Technology Type

    Hardware-based

    Software-based

    Mixed Reality as a Service

    GCC COUNTRIES Mixed Reality Market by End Use Type

    Consumer

    Commercial

    Industrial

    GCC COUNTRIES Mixed Reality Market by Device Type

    Head-mounted Display

    Smart Glasses

    Smart Phones

    Tablets

    SOUTH AFRICA Outlook (USD Billion, 2019-2032)

    SOUTH AFRICA Mixed Reality Market by Application Type

    Gaming

    Healthcare

    Education

    Retail

    Real Estate

    SOUTH AFRICA Mixed Reality Market by Technology Type

    Hardware-based

    Software-based

    Mixed Reality as a Service

    SOUTH AFRICA Mixed Reality Market by End Use Type

    Consumer

    Commercial

    Industrial

    SOUTH AFRICA Mixed Reality Market by Device Type

    Head-mounted Display

    Smart Glasses

    Smart Phones

    Tablets

    REST OF MEA Outlook (USD Billion, 2019-2032)

    REST OF MEA Mixed Reality Market by Application Type

    Gaming

    Healthcare

    Education

    Retail

    Real Estate

    REST OF MEA Mixed Reality Market by Technology Type

    Hardware-based

    Software-based

    Mixed Reality as a Service

    REST OF MEA Mixed Reality Market by End Use Type

    Consumer

    Commercial

    Industrial

    REST OF MEA Mixed Reality Market by Device Type

    Head-mounted Display

    Smart Glasses

    Smart Phones

    Tablets


    Infographic

    Free Sample Request

    Kindly complete the form below to receive a free sample of this Report

    Get Free Sample

    Customer Strories

    “I am very pleased with how market segments have been defined in a relevant way for my purposes (such as "Portable Freezers & refrigerators" and "last-mile"). In general the report is well structured. Thanks very much for your efforts.”

    Victoria Milne

    Founder

    Compare Licence

    ×
    Features License Type
    Single User Multiuser License Enterprise User
    Price $4,950 $5,950 $7,250
    Maximum User Access Limit 1 User Upto 10 Users Unrestricted Access Throughout the Organization
    Free Customization
    Direct Access to Analyst
    Deliverable Format
    Platform Access
    Discount on Next Purchase 10% 15% 15%
    Printable Versions