Mobile Application Market (2026 - 2035)

Mobile Application Market Size, Share and Research Report By Store Type (Apple App Store, Google Play Store, Third-Party Android Stores), By Application Category (Gaming, Social Networking & Communication, Entertainment & Media, Health & Fitness, Retail & E-Commerce, Others), By Operating System (iOS, Android, HarmonyOS & Others), By Monetization Model (In-App Purchases, Subscriptions, Paid Apps, Advertising & Others) and By Regional (North America, Europe, South America, Asia Pacific, Middle East and Africa) - Industry Forecast to 2035.
ID: MRFR/ICT/3083-HCR
200 Pages
Aarti Dhapte
Last Updated: July 02, 2026
Mobile Application Market
Market Size
Forecast Period2026-2035
CAGR (2026-2035)15.80%
2026 Market SizeUSD 415.14 Billion
2035 Market SizeUSD 1,554.26 Billion
Key Players
Apple Inc.
Alphabet
Tencent Holdings
Meta Platforms
ByteDance
Microsoft
Opportunities
  • Edge-AI and On-Device Intelligence
  • Super-App Consolidation in Emerging Markets
  • Health and Chronic-Disease Management Apps

Mobile Application Market Summary

The Mobile Application Market was valued at USD 358.50 billion in 2025 and is projected to reach USD 415.14 billion by 2026 before climbing to USD 1,554.26 billion by 2035, expanding at a CAGR of 15.80% during the forecast period. A surge in global smartphone adoption—estimated at over 6.9 billion connected devices by 2025 [1]—continues to underwrite app-store economics, while government digital-identity programs in India, Brazil, and the EU are channeling hundreds of millions of first-time users into mobile-first ecosystems. Combined consumer and enterprise spending on mobile software crossed a trillion-dollar annual run rate for the first time in late 2024, signaling that the Mobile Application Market is transitioning from a growth story to a foundational pillar of the global digital economy [2].

Technologically, the Mobile Application Market is in the middle of a generational shift. Monolithic native codebases are giving way to cross-platform frameworks such as Flutter and Kotlin Multiplatform, while generative-AI development kits from Google and OpenAI now allow small studios to ship personalization features that previously required dedicated machine-learning teams. Commercial 5G networks—covering roughly 45% of the global population by mid-2025 [3]—are unlocking low-latency gaming, real-time AR commerce, and edge-computing workloads that simply could not run on prior networks.

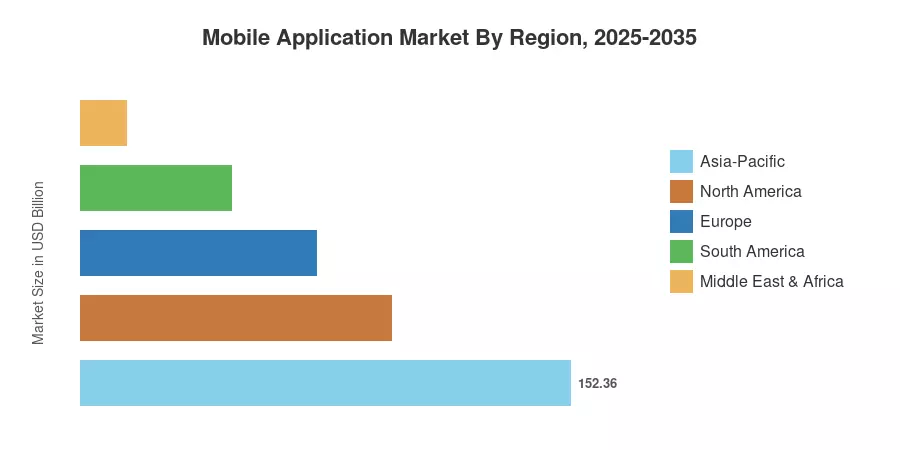
Asia-Pacific commands the largest share of the Mobile Application Market at roughly 42.5% of global revenue, driven by super-app ecosystems in China and Southeast Asia. South America is the fastest-growing region, posting a projected CAGR of 13.10% through 2035, as digital financial-inclusion initiatives in Brazil and Colombia onboard previously unbanked populations. North America retains the second-largest share at approximately 27.0%, anchored by premium consumer spending and a mature enterprise-SaaS installed base. As AI-powered functionality moves from a differentiator to a baseline expectation, the next decade promises to reshape every layer of this value chain.

Key Report Takeaways

• By Store Type

  • Apple App Store captured an estimated 57.5% of Mobile Application Market revenue share in 2025, buoyed by premium user spending in North America and Western Europe.
  • Third-party Android stores are forecast to expand at a 13.20% CAGR between 2026 and 2035, as OEM-specific storefronts gain traction in China and emerging markets.

• By Application Category

  • Gaming retained approximately 46.1% of Mobile Application Market revenue in 2025, remaining the single largest category by a wide margin.
  • Health and fitness applications are projected to grow at a 16.30% CAGR through 2035, accelerated by wearable integration and chronic-disease management platforms.

• By Operating System

  • iOS held roughly 57.0% of Mobile Application Market spending in 2025, reflecting the platform's outsized monetization efficiency.
  • HarmonyOS is set to grow at a 15.60% CAGR, fueled by Huawei's expanding device ecosystem in China and parts of the Middle East.

• By Monetization Model

  • In-app purchases accounted for an estimated 52.5% of Mobile Application Market revenue in 2025.
  • Subscription-based models show the fastest growth at a projected 14.90% CAGR to 2035, as developers pivot toward recurring-revenue economics.

• By Region

  • Asia-Pacific captured approximately 42.5% of the mobile application market share in 2025.
  • South America is the quickest-expanding geography at a 13.10% CAGR, propelled by Pix-enabled mobile payments in Brazil and rising smartphone penetration.

Market Size and Forecast (2021–2035)

Market Research Future's estimates integrate primary interviews with app-store executives, SDK analytics from leading attribution platforms, and secondary data from the ITU and GSMA. Historical figures (2021–2024) reflect reported industry revenues; the 2025 base year combines preliminary full-year data with Q4 extrapolations. Forecast values (2026–2035) apply a calibrated compound growth model with annual adjustments for regulatory shifts, device-cycle timing, and macroeconomic sensitivity.
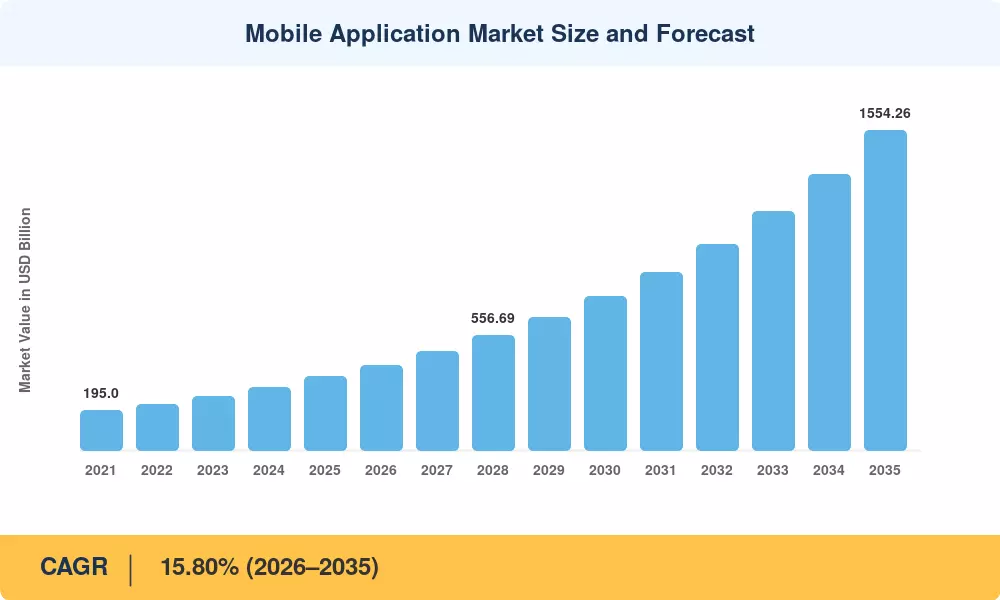
Mobile Application Market Size and Forecast
Our Impact
Enabled $4.3B Revenue Impact for Fortune 500 and Leading Multinationals
Partnering with 2000+ Global Organizations Each Year
30K+ Citations by Top-Tier Firms in the Industry

Driver Impact Analysis

Driver ~% Impact on CAGR Geographic Relevance Impact Timeline
Rising global smartphone penetration ~22% Asia-Pacific, South America, MEA Long-term
AI and generative-AI integration in mobile apps ~20% Global Short-to-medium-term
Commercial 5G and 5G-Advanced deployments ~16% North America, Asia-Pacific, Europe Medium-term
Growth of subscription and hybrid monetization ~14% North America, Europe Medium-term
Enterprise mobility and workforce digitization ~12% North America, Europe Long-term
Super-app and platform-consolidation economics ~10% Asia-Pacific, South America Long-term
Government digital-identity and inclusion mandates ~6% South America, MEA, Asia-Pacific Short-term

Rising Global Smartphone Penetration

According to the GSMA, the number of unique mobile internet users will increase from 5.86 billion by mid-2026 to over 6.5 billion by 2030. A large portion of this growth is concentrated in Latin America, South Asia, and Sub-Saharan Africa, where reasonably priced smartphones under $100 are making their way into countries that traditionally relied on feature phones. The anticipated CAGR is supported by a long-term structural tailwind created by each new internet-connected device, which represents incremental addressable demand for the mobile application market, especially in areas like banking, social media, and mobile health.

AI and Generative-AI Integration

In 2024–2025, Google, OpenAI, and Apple introduced generative-AI SDKs that reduced the development time for intelligent notification features, natural-language search, and personalization from months to weeks [4]. According to research, in Q1 2025, apps with on-device AI capabilities had 38% greater 30-day retention rates than their peers without AI. AI integration is one of the most economically significant factors influencing the mobile application market since this retention increase directly translates into greater lifetime values.

Commercial 5G and 5G-Advanced Deployments

About 60% of the world's population was covered by 5G networks by the beginning of 2026, with the US, China, South Korea, and portions of Western Europe having the most mid-band spectrum available. Use cases that were not feasible over LTE, such as cloud-streamed gaming, real-time collaborative augmented reality, and telemedicine with high-definition video, are made possible by the bandwidth and latency characteristics of 5G-Advanced. According to the most recent Mobility Reports research, the average monthly mobile data traffic per smartphone worldwide is expected to exceed 70 GB by 2031, which would immediately increase the mobile application market's addressable service layer.

Growth of Subscription and Hybrid Monetization

With recurring revenue models continuously surpassing one-time in-app sales, subscription revenue continues to be the key driver of app store growth. Because hybrid monetization architectures provide more consistent cash flows and lessen dependency on erratic conversion funnels, developers are increasingly choosing them. Smaller studios now have an easier time implementing complex recurring-revenue plans throughout the mobile application market thanks to improved developer tools for offer management and price testing.

Restraints Impact Analysis

Impact percentages below are directional estimates of each restraint's drag on headline growth. They are not directly subtracted from the CAGR and are based on expert-panel assessments compiled by Market Research Future.

Restraint ~% Impact on CAGR Geographic Relevance Impact Timeline
App-store commission disputes and regulatory intervention –4.5% Global Short-to-medium-term
Data-privacy and consent-framework fragmentation –3.5% Europe, North America Medium-term
Download saturation in mature markets –3.0% North America, Western Europe, Japan Long-term
Rising user-acquisition costs –2.5% Global Short-term
Device and OS fragmentation –1.5% Asia-Pacific, MEA Medium-term

App-Store Commission Disputes

A new standard for "gatekeeper" platforms has been set by the EU's Digital Markets Act, which went into force in March 2024 and mandates that Apple and Google allow alternative payment processors and app distribution mechanisms. The business has entered a complicated period of interoperability enforcement and data-portability standards, despite the fact that these measures are intended to reduce commission rates. In addition to managing the operational complexity of cross-OS data migration and compliance reporting, developers now have to adjust to platform-specific "core platform service" regulations.

Data-Privacy and Consent-Framework Fragmentation

Since the launch of Apple's App Tracking Transparency (ATT), the user tracking market has developed considerably. While IDFA availability remains limited by design, user consent rates have progressively grown to roughly 70% for apps that actively prompt users; however, many publishers still struggle to establish effective consent strategies. Simultaneously, the EU's Digital Services Act, India's DPDP Act, and Brazil's LGPD establish overlapping consent rules. For developers, the compliance burden now constitutes a fixed operational overhead, frequently requiring dedicated legal and engineering staff to maintain cross-jurisdictional data standards.

Download Saturation in Mature Markets

The period of high annual growth in new-app installs has mostly ended in developed countries like the US, Japan, and Western Europe, and the market is moving toward a "retention-first" paradigm. Growth is now fueled by deepening engagement, updating content, and raising the Average Revenue Per User (ARPU) rather than the sheer number of new downloads. In order to compete for a short, highly saturated user attention span, success in these locations now demands high-investment strategies in customer-success infrastructure and product quality.

Mobile Application Market Opportunities

Edge-AI and On-Device Intelligence

Neural processing units (NPUs) are becoming more common in flagship and mid-range chipsets; Apple's A19 and Qualcomm's Snapdragon 8 Gen 4 both come with dedicated on-device LLM accelerators. This gives developers the chance to deploy AI-powered capabilities without round-trip latency from the cloud. The areas that stand to gain the most are those that are sensitive to privacy, like personal finance, health diagnostics, and business communications. According to market research estimates, by 2032, on-device AI workloads may make up more than 15% of the value of the mobile application market.

Super-App Consolidation in Emerging Markets

Platforms in Latin America (Mercado Libre, Nubank) and Africa (M-Pesa and other developing businesses) are now successfully copying the super-app blueprint that WeChat and Grab exhibited in Asia. Payments, ride-hailing, e-commerce, and social features can all be combined into one app to reduce user acquisition costs and increase switching obstacles. This design is changing the competitive dynamics in the mobile application market.

Health and Chronic-Disease Management Apps

The WHO estimates that chronic diseases will account for 75% of global deaths by 2030, creating urgent demand for continuous remote-monitoring solutions [20]. Prescription digital therapeutics (PDTs) approved by the FDA and EMA are already reimbursed by insurers in the US and Germany, establishing a revenue pathway that extends the Mobile Application Market into regulated healthcare spending.

No-Code and Low-Code App Development Platforms

Platforms like FlutterFlow, Adalo, and Microsoft Power Apps are enabling non-developers to build and deploy functional mobile applications, expanding the creator base far beyond professional software engineers. projects that by 2028, over 70% of new enterprise applications will use low-code or no-code tooling [21], democratizing participation in the Mobile Application Market and creating a long tail of niche, vertically specialized apps.

Data Monetization Through First-Party Analytics

With third-party cookies and device identifiers fading, publishers that build robust first-party data stacks gain a competitive moat. Aggregated, privacy-compliant behavioral analytics can be packaged into advertising and benchmarking products that diversify revenue beyond direct user payments. This trend is especially relevant in the gaming and retail segments of the Mobile Application Market, where session depth generates rich intent signals.

Mobile Application Market Future Outlook

AI-Native Application Architecture

By 2028, Market Research Future anticipates that over half of newly published applications will incorporate at least one AI-driven feature at launch—up from roughly 12% in 2024. On-device large language models, running on NPU-equipped chipsets from Apple, Qualcomm, and MediaTek, will shift inference costs away from cloud APIs and toward silicon, fundamentally altering the economics of the Mobile Application Market. Developers who architect for local-first AI will enjoy lower marginal costs and stronger privacy positioning.

Platform Economics and Regulatory Realignment

The EU's DMA, the US DOJ remedy process, and Japan's Transparency Act collectively signal that the walled-garden era is entering its twilight phase. Alternative app stores—already live on iOS in the EU—are expected to reach global availability by 2029. While this fragmentation raises distribution complexity, it also reduces commission rates and opens new go-to-market strategies for publishers across the Mobile Application Market.

Spatial Computing and Ambient Interfaces

Apple Vision Pro, Meta Quest, and a growing roster of Android XR headsets are creating a spatial-computing layer on top of the mobile ecosystem. Projects suggest that over 50 million XR devices will ship annually by 2030 [14], and the applications running on them will largely be distributed through existing mobile app stores. This adjacent hardware cycle creates incremental revenue channels within the Mobile Application Market for gaming, productivity, and social-presence applications.

Sustainability and Digital Responsibility

ESG-driven investors and consumers are pressuring developers to reduce the carbon footprint of app infrastructure—optimizing server calls, minimizing background data usage, and disclosing energy-impact metrics. The EU's proposed Green Digital Act could require carbon-intensity labeling for applications by 2030. Developers who proactively adopt efficient architectures will gain a reputational and regulatory head start in the Mobile Application Market.

Mobile Application Market Segmentation

By Store Type

Store Type Key Metric Primary Demand Driver
Apple App Store ~57.5% of revenue (2025) Premium ARPU and enterprise purchasing programs
Google Play Store ~30.3% of revenue (2025) Global Android install base volume
Third-Party Android Stores 13.20% CAGR (2026–2035) OEM-curated stores in China and emerging markets


The Mobile Application Market remains a two-platform contest at its core, with Apple App Store commanding the revenue lead and Google Play delivering the volume lead. Apple's services division reported record billings in its FY2025 Q3 earnings, with App Store revenue contributing the lion's share. Google Play, meanwhile, benefits from Android's 72% global device share but monetizes at a significantly lower per-user rate. Third-party Android stores—Huawei AppGallery, Samsung Galaxy Store, and China-specific distributors like Tencent MyApp—are carving out a growing wedge of the Mobile Application Market, particularly in geographies where Google Play access is restricted or where OEM pre-installs channel users toward proprietary storefronts.

By Application Category

Application Category Key Metric Primary Demand Driver
Gaming ~46.1% of revenue (2025) In-app purchase loops and live-service models
Social Networking & Communication USD 52.30 Billion (2025) Messaging monetization and creator economies
Entertainment & Media 14.20% CAGR (2026–2035) Short-video advertising and SVOD bundles
Health & Fitness 16.30% CAGR (2026–2035) Wearable integration and prescription DTx
Retail & E-Commerce USD 42.50 Billion (2025) Mobile-first checkout and social commerce
Others ~8.5% of revenue (2025) Education, travel, utilities, productivity


Gaming continues to dominate the Mobile Application Market by revenue, driven by live-service titles that generate consistent in-app-purchase streams. Health and fitness is the fastest-growing category, propelled by insurance-reimbursed digital therapeutics, wearable-device companion apps, and chronic-disease management solutions. Retail and e-commerce applications are increasingly blurring the line between content and commerce, with TikTok Shop and Instagram Checkout embedding transaction capability directly into social feeds.

By Operating System

Operating System Key Metric Primary Demand Driver
iOS ~57.0% of revenue (2025) Premium monetization and developer-tool ecosystem
Android ~38.5% of revenue (2025) Global device-volume leadership
HarmonyOS & Others 15.60% CAGR (2026–2035) Huawei device ecosystem and emerging-market OEMs


iOS continues to generate a disproportionate share of Mobile Application Market revenue relative to its installed base, reflecting the higher willingness to pay among Apple's user demographic. Android's sheer volume—over 3.5 billion active devices globally—ensures it captures the majority of downloads and ad impressions. HarmonyOS, Huawei's proprietary platform, is the most significant disruptor in this dimension; by mid-2025 it had surpassed 1.2 billion connected device instances in China, establishing a credible third ecosystem that investors tracking the Mobile Application Market cannot ignore.

By Monetization Model

Monetization Model Key Metric Primary Demand Driver
In-App Purchases ~52.5% of revenue (2025) Gaming and virtual-goods economies
Subscriptions 14.90% CAGR (2026–2035) Predictable revenue and reduced churn
Paid Apps ~6.2% of revenue (2025) Niche productivity and professional tools
Advertising & Others USD 66.10 Billion (2025) Rewarded-video and native-ad formats


In-app purchases remain the largest revenue pillar of the Mobile Application Market, anchored by gaming and virtual-goods economies. Subscriptions, however, represent the fastest-growing monetization pathway, reflecting a broader industry pivot toward recurring-revenue models that stabilize cash flows and increase investor visibility. The advertising segment is undergoing its own transformation as IDFA deprecation and privacy regulation push the industry toward contextual targeting and first-party data strategies.

Regional Market Share Analysis

Region Key Metric Primary Investment Themes
Asia-Pacific ~42.5% of global revenue (2025) Super-app ecosystems, 5G gaming, OEM app stores
North America ~27.0% of global revenue (2025) Enterprise SaaS, subscription economy, AI integration
Europe ~20.5% of global revenue (2025) DMA compliance, privacy-first monetization, fintech
South America 13.10% CAGR (2026–2035) Digital payments, financial inclusion, social commerce
Middle East & Africa ~4.0% of global revenue (2025) Mobile money, government digitization, youth demographics
Total USD 358.50 Billion (2025)

The Mobile Application Market exhibits a multi-polar structure, with Asia-Pacific leading in absolute spend, North America dominating in per-user monetization, and South America emerging as the fastest-growth corridor.


North America

Country Key Metric Key Driver
US ~82% of regional revenue Enterprise mobility and premium consumer spending
Canada 8.50% CAGR (2026–2035) Healthcare-app adoption and bilingual content demand
Mexico 11.40% CAGR (2026–2035) Fintech expansion and rising smartphone affordability


The US alone accounts for roughly four-fifths of North American Mobile Application Market revenue, reflecting both its scale and the world's highest average revenue per user. Apple's iOS enjoys a disproportionate share of US consumer wallets, while Google Play leads in install volume. Canada's federal investment of CAD 2.5 billion in digital health infrastructure through 2027 is catalyzing health-app adoption [22], and Mexico's mobile-banking boom—led by Mercado Pago, Nu México, and Clip—is rapidly expanding the addressable market south of the border.

Europe

Country Key Metric Key Driver
Germany ~22% of regional revenue Industrial IoT companion apps, automotive connectivity
UK ~19% of regional revenue Fintech and open-banking super-apps
France USD 13.80 Billion (2025) Cultural-content apps and government digital ID
Italy 9.20% CAGR (2026–2035) SME digitization incentives
Spain 9.80% CAGR (2026–2035) Tourism-tech and gig-economy platforms
Nordic Countries USD 8.90 Billion (2025) Mobile-first banking and wellness apps
Russia 7.50% CAGR (2026–2035) Domestic app-store development (RuStore)
Rest of Europe ~11% of regional revenue Varied adoption stages across Eastern Europe


The EU's Digital Markets Act is reshaping the Mobile Application Market across Europe by mandating interoperability and alternative payment rails within gatekeeper platforms. Germany and the UK together contribute over 40% of European app revenues, with fintech, mobility-as-a-service, and enterprise productivity leading category growth. France's rollout of the France Identité digital-ID app—used by over 15 million citizens by early 2025—demonstrates how government-led initiatives can accelerate mobile engagement at national scale [23].

Asia-Pacific

Country Key Metric Key Driver
China ~48% of regional revenue Super-app dominance, Douyin commerce, HarmonyOS growth
India 17.20% CAGR (2026–2035) UPI payments, Jio-driven smartphone penetration
Japan USD 25.40 Billion (2025) Premium gaming, manga, and subscription content
South Korea ~9% of regional revenue 5G gaming and K-content streaming
ASEAN 14.80% CAGR (2026–2035) E-commerce super-apps and ride-hailing platforms
Rest of Asia-Pacific ~5% of regional revenue Early-stage digitization in Central Asia, Oceania


Asia-Pacific is the dominant region in the Mobile Application Market by a significant margin, propelled by China's massive base of mobile-internet users and India's explosive growth trajectory. China's super-app ecosystem—anchored by WeChat, Alipay, and Douyin—generates transaction volumes exceeding USD 3 trillion annually within in-app commerce alone [24]. India's Unified Payments Interface (UPI) processed over 14 billion transactions in a single month by late 2024, underlining the country's emergence as the world's highest-velocity mobile-payments market and a critical growth frontier for the Mobile Application Market.

South America

Country Key Metric Key Driver
Brazil ~62% of regional revenue Pix instant payments, social commerce via WhatsApp
Argentina 14.50% CAGR (2026–2035) Digital-wallet adoption amid currency instability
Rest of South America ~15% of regional revenue Colombia and Chile fintech corridors


South America represents the fastest-growing region in the Mobile Application Market, driven almost entirely by Brazil's digital-payments revolution. The Central Bank of Brazil's Pix platform—now used by over 160 million individuals—has turned smartphones into primary financial instruments for a population that was heavily cash-dependent just five years ago [25]. Argentina's volatile macroeconomic environment is, paradoxically, accelerating digital-wallet adoption as consumers seek real-time currency management tools.

Middle East & Africa

Country Key Metric Key Driver
Saudi Arabia ~28% of regional revenue Vision 2030 digital-government apps
UAE USD 2.10 Billion (2025) Fintech licensing and smart-city platforms
South Africa 12.30% CAGR (2026–2035) Mobile money and affordable data packages
Egypt 13.50% CAGR (2026–2035) Youth demographics and mobile-first internet access
Rest of MEA ~30% of regional revenue M-Pesa ecosystem expansion across East Africa


The Middle East & Africa region, while the smallest in absolute terms, offers outsized growth potential for the Mobile Application Market. Saudi Arabia's Vision 2030 program has mandated mobile-first delivery for over 200 government services, stimulating both public-sector and adjacent private-sector app demand [26]. In Sub-Saharan Africa, M-Pesa's model of embedding financial services inside a mobile application has become the template for digital inclusion, with Kenya, Tanzania, and Nigeria all recording double-digit growth in mobile-money transaction volumes during 2024.

Mobile Application Market By Region, 2025-2035

Competitive Benchmarking

The Mobile Application Market exhibits medium concentration, with the top five companies controlling an estimated 40–48% of ecosystem-level revenues. Platform owners (Apple, Google) derive structural advantages from app-store gatekeeping, while content-heavy publishers (Tencent, ByteDance, Meta) compete on user engagement and time-spent metrics. The competitive landscape is further complicated by regional champions and category specialists.

Company Est. Revenue Share Range Key Offerings for Mobile Application Market Strategic Positioning
Apple Inc. ~14–18% App Store, Apple Arcade, HealthKit, StoreKit Platform gatekeeper; premium ecosystem monetization
Alphabet (Google) ~12–16% Google Play, AdMob, Firebase, Android Platform gatekeeper; ad-monetization infrastructure
Tencent Holdings ~7–10% WeChat, Honor of Kings, Tencent Cloud gaming SDK Super-app conglomerate; dominant in China
Meta Platforms ~5–8% WhatsApp, Instagram, Meta Quest store Social-graph monetization; XR platform expansion
ByteDance ~4–7% TikTok, Douyin, Lark, CapCut Short-video commerce; global content distribution
Microsoft ~3–5% Microsoft 365 Mobile, LinkedIn, Xbox Game Pass Enterprise productivity; cross-platform gaming
Amazon ~2–4% Amazon Appstore, Prime Video, Alexa skills E-commerce integration; Fire OS ecosystem
Spotify ~1–3% Spotify app, podcast platform, audiobook store Subscription audio; creator monetization
NetEase ~1–3% Mobile gaming portfolio, Youdao, Cloud Music Gaming-centric publisher with education expansion
Electronic Arts ~1–2% EA Sports FC Mobile, Apex Legends Mobile Live-service gaming; sports-licensing moats

Recent News & Developments

  • Apple (June 2025): Launched a redesigned App Store with AI-curated discovery feeds and expanded third-party payment support across all EU markets, reducing the standard commission to 17% for qualifying small developers [8].
  • Google (March 2025): Released Android 16 with integrated on-device Gemini Nano capabilities, allowing developers to access generative-AI functions without cloud API calls across the Mobile Application Market [4].
  • Tencent (January 2025): Completed acquisition of a controlling stake in Funcom, expanding its Western gaming portfolio and strengthening its cross-platform mobile publishing pipeline [27].
  • European Commission (September 2024): Issued compliance orders to Apple and Google under the Digital Markets Act, mandating full third-party app-store sideloading on iOS and interoperable messaging by Q2 2025 [8].
  • ByteDance (July 2024): Launched TikTok Shop in Brazil and Mexico, integrating in-app checkout across Latin America and expanding the mobile-commerce footprint of the Mobile Application Market in the region [25].
  • Huawei (April 2024): Announced that HarmonyOS NEXT—fully decoupled from Android APIs—reached 1.2 billion connected device activations, establishing viability for third-party app developers [19].
  • India Ministry of Electronics and IT (February 2024): Published the Digital Personal Data Protection Rules under the DPDP Act, establishing consent-management requirements for all mobile applications serving Indian users [16].
  • June 2025: According to Apple, the App Store generated USD 1.3 trillion in billings and sales in 2024, most of which came from commissionable digital items.
  • Global regulatory pressure increased in June 2025 when Korean game producers filed a USD 7.4 billion class-action lawsuit against Google over in-app payment prices.
  • In May 2025, Phunware announced a 40% year-over-year rise in software subscription revenue, introduced an AI Concierge for the hospitality industry, and obtained a USD 0.5 million reservation with a medical facility.

Mobile Application Market Report Scope

Parameter Detail
Market Scope Global Mobile Application Market covering store types, application categories, operating systems, monetization models, and five geographic regions
Study Period 2021–2035
CAGR (Forecast Period) 15.80% (2026–2035)
Base Year 2025 — USD 358.50 Billion
2026 Forecast Starting Value USD 415.14 Billion
2035 Forecast Endpoint USD 1,554.26 Billion
Fastest Growing Segment Health & Fitness (by application category); Subscriptions (by monetization model)
Companies Profiled Apple, Alphabet, Tencent, Meta, ByteDance, Microsoft, Amazon, Spotify, NetEase, Electronic Arts
Valuation Currency USD Billion


FAQs

How do app-store commission reductions affect developer profitability in the Mobile Application Market?
Lower commissions directly improve developer margins, particularly for subscription apps where the rate drops to 15% after the first year on both major stores. Small studios with annual revenues under USD 1 million benefit most from reduced-rate programs [8].
Which monetization strategy yields the highest lifetime value per user?
Hybrid models combining in-app purchases with optional subscriptions consistently deliver the highest LTV, outperforming pure-ad or pure-paid approaches by 30–40% according to data.ai benchmarks [11].
How does on-device AI change the cost structure for Mobile Application Market developers?
On-device inference eliminates per-query cloud-API fees, cutting AI-feature operating costs by up to 60% once NPU-optimized models are deployed [9].
What role do third-party app stores play in the Mobile Application Market?
Third-party stores reduce platform dependency and can offer lower commissions, but they fragment analytics and update distribution, requiring developers to maintain parallel publishing pipelines [8].
How should investors evaluate Mobile Application Market exposure across public equities?
Focus on companies with durable platform advantages or a subscription-revenue mix above 40%, as these tend to exhibit lower earnings volatility and stronger free-cash-flow conversion [15].
What are the primary cybersecurity risks facing the Mobile Application Market?
SDK supply-chain attacks and malicious ad-network injections remain the top vectors, with Google reporting removal of over 2.3 million policy-violating apps from the Play Store in 2024 alone [4].
How does 5G availability differ across regions in its impact on the Mobile Application Market?
5G impact is strongest in South Korea, the US, and urban China where mid-band coverage exceeds 80%, while most of Africa and South Asia remain on 4G, limiting latency-sensitive app adoption [3].  
Author
Author
Author Profile
Aarti Dhapte LinkedIn
AVP - Research
A consulting professional focused on helping businesses navigate complex markets through structured research and strategic insights. I partner with clients to solve high-impact business problems across market entry strategy, competitive intelligence, and opportunity assessment. Over the course of my experience, I have led and contributed to 100+ market research and consulting engagements, delivering insights across multiple industries and geographies, and supporting strategic decisions linked to $500M+ market opportunities. My core expertise lies in building robust market sizing, forecasting, and commercial models (top-down and bottom-up), alongside deep-dive competitive and industry analysis. I have played a key role in shaping go-to-market strategies, investment cases, and growth roadmaps, enabling clients to make confident, data-backed decisions in dynamic markets.

Research Approach


Secondary Research

The secondary research process involved comprehensive analysis of regulatory databases, industry reports, peer-reviewed technology journals, developer documentation, and authoritative digital economy organizations. Key sources included the International Telecommunication Union (ITU), GSMA Intelligence, Apple App Store Connect Analytics, Google Play Console Statistics, U.S. Bureau of Economic Analysis (BEA) Digital Economy Reports, European Commission Digital Economy and Society Index (DESI), NIST Cybersecurity Framework, National Institute of Standards and Technology (NIST) Mobile Security Guidelines, Pew Research Center Internet & Technology Studies, International Data Corporation (IDC), Statista Digital Market Outlook, World Bank Digital Development Indicators, OECD Digital Economy Outlook, China Ministry of Industry and Information Technology (MIIT), Japan Ministry of Internal Affairs and Communications (MIC) Communications Report, India Ministry of Electronics and Information Technology (MeitY), Federal Communications Commission (FCC) Wireless Reports, UK Office for National Statistics (ONS) Internet Access Data, App Annie (data.ai) Intelligence, and Sensor Tower Market Intelligence.

App download statistics, revenue generation data, platform penetration rates, regulatory compliance requirements, emerging technology adoption patterns, and competitive landscape analysis were gathered across iOS, Android, and emerging mobile platforms using these sources.


Primary Research

Qualitative and quantitative insights were obtained by interviewing supply-side and demand-side stakeholders during the primary research process. The supply-side sources consist of CEOs, CTOs, VPs of Product Development, chief of mobile strategy, and monetization directors from mobile app publishers, platform developers, and mobile ad networks. In addition to procurement leaders from enterprise mobility adopters, demand-side sources included chief mobile officers, digital transformation directors, app development managers, gaming studios, fintech companies, healthcare app providers, and retail/e-commerce mobile strategists. Market segmentation was validated in the gaming, entertainment, social media, productivity, and enterprise app categories through primary research. Development pipeline timelines were also confirmed, and insights regarding user acquisition costs, retention strategies, monetization models (in-app purchases, subscriptions, advertising), and platform-specific optimization dynamics were analyzed.

Primary Respondent Breakdown:

By Designation: C-level Primaries (28%), Director Level (34%), Others (38%)

By Region: North America (31%), Europe (29%), Asia-Pacific (33%), Rest of World (7%)


Market Size Estimation

Revenue mapping and download/installation volume analysis were employed to determine the global market valuation. The methodology comprised the following:

Identification of over 50 significant publishers and platform providers in North America, Europe, Asia-Pacific, the Middle East and Africa, and Latin America

Product mapping in native, hybrid, web, and progressive web applications (PWAs)

Segmentation of categories including gaming, social networking, entertainment, m-commerce, fintech, health and fitness, education, and enterprise productivity

Examination of annual revenues that are specific to mobile app portfolios, including in-app advertising, in-app purchases, and subscription revenue streams, as reported and modeled

In 2024, the coverage of publishers will account for 75-80% of the global market share.

Extrapolation is employed to generate segment-specific valuations by combining bottom-up (active user base × ARPU by country/region) and top-down (publisher revenue validation) methodologies.

Download Free Sample

Kindly complete the form below to receive a free sample of this Report

Download PDF ×

We do not share your information with anyone. However, we may send you emails based on your report interest from time to time. You may contact us at any time to opt-out.

















