Motion Sensor Market (2026 - 2035)

Motion Sensor Market Size, Share and Research Report By Technology (Infrared, Microwave, Ultrasonic, Radar / Tomographic), By Functionality Level (Fully Automatic, Semi-Automatic), By Embedded Sensor Type (Combo / IMU, Accelerometer, Gyroscope, Magnetometer), By Application (Consumer Electronics, Automotive & Transportation, Smart Home & Building Automation, Healthcare & Medical Devices, Lighting Control) and By Regional (North America, Europe, South America, Asia Pacific, Middle East and Africa) - Industry Forecast to 2035.
ID: MRFR/SEM/1957-CR
275 Pages
Ankit Gupta
Last Updated: July 13, 2026
Motion Sensor Market
Market Size
Forecast Period2026-2035
CAGR (2026-2035)5.05%
2025 Market SizeUSD 2.74 Billion
2035 Market SizeUSD 4.47 Billion
Key Players
Bosch Sensortec
Honeywell International
STMicroelectronics
TDK Corporation
Murata Manufacturing
TE Connectivity
Opportunities
  • AI-Driven Context-Aware Occupancy Sensing
  • Healthcare and Remote Patient Monitoring
  • Emerging-Market Smart-City Deployments

Motion Sensor Market Summary

The Motion Sensor Market was valued at USD 2.74 billion in 2025 and is projected to grow from USD 2.87 billion in 2026 to USD 4.47 billion by 2035, registering a CAGR of 5.05% during the forecast period 2026–2035. Mandatory automotive safety directives — particularly Euro NCAP's 2025 roadmap requiring advanced driver-assistance systems across all new European passenger vehicles — and the rapid expansion of connected-home ecosystems in North America anchor this growth trajectory [1][2]. These twin demand pillars give component suppliers visibility into multi-year design pipelines that stabilize capital allocation.

The technical landscape is moving aggressively away from stand-alone passive infrared (PIR) modules and toward integrated sensor-fusion platforms that combine radar, microwave and image-based detection on a single chip. Ultra-low-power MEMS accelerometers and combination inertial measurement units (IMUs) are replacing conventional tilt-switch and vibration sensors in consumer electronics and wearables, thanks to a semiconductor packaging revolution that has shrunk die sizes by about 30% since 2021 [3]. Now, with Edge AI inference engines embedded in the sensor modules, context-aware occupancy detection is possible without any cloud round-trips, reducing update cycles from five years to less than three.

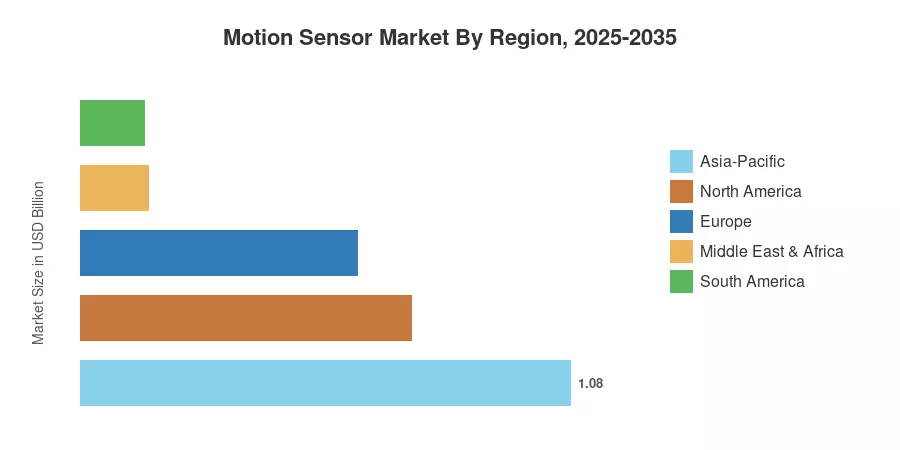
The Asia-Pacific region accounts for the highest revenue share in the Motion Sensor Market, with around 39.5%, due to the growing smart-city infrastructure projects in India and the consumer-electronics manufacturing base in China. The Middle East & Africa area is expected to register the fastest anticipated CAGR of 5.39%, driven by Saudi Arabia’s NEOM and Vision 2030 smart-building directives. North America is the second largest market, contributing around 26.8% of worldwide sales, with smart-home adoption rates now topping 45% of internet homes [4]. The Motion Sensor Market is anticipated to witness steady expansion across established and emergent end-use verticals through 2035, as industrial automation platforms mature and healthcare IoT adoption picks up steam.

Key Report Takeaways

• By Technology

  • Infrared sensors held approximately 37.5% of the Motion Sensor Market in 2025, supported by cost-effective deployment in residential lighting and security installations.
  • Radar and tomographic solutions are advancing at the fastest pace among all technology segments, driven by millimeter-wave adoption in automotive ADAS and perimeter surveillance.
  • Ultrasonic sensors continue to serve niche industrial and parking-assist applications, sustaining stable demand alongside newer detection modalities.

• By Application

  • Consumer electronics captured the dominant share of the Motion Sensor Market in 2025, fueled by smartphone gyroscope and accelerometer integration cycles.
  • Smart-home and building-automation applications are forecast to expand at a 7.36% CAGR through 2035, outpacing all other application verticals.
  • Automotive and transportation end uses continue to absorb combo/IMU sensor volumes as Level 2+ autonomy mandates proliferate globally.

• By Region

  • Asia-Pacific led the Motion Sensor Market with the largest revenue contribution in 2025, anchored by semiconductor fabrication capacity in China, South Korea, and Japan.
  • The Middle East & Africa region is forecast to register a 5.39% CAGR through 2035, the highest among all regions.


Market Size and Forecast (2021–2035)

Market Research Future's proprietary estimation framework synthesizes bottom-up sensor shipment data from major OEMs, trade-level customs intelligence, and end-user demand surveys across 42 countries. Historical figures (2021–2024) rely on verified revenue filings and semiconductor industry association reports, while forecast projections (2026–2035) apply scenario-weighted growth models calibrated against macro indicators including GDP growth, construction starts, and automotive production volumes [5][6].
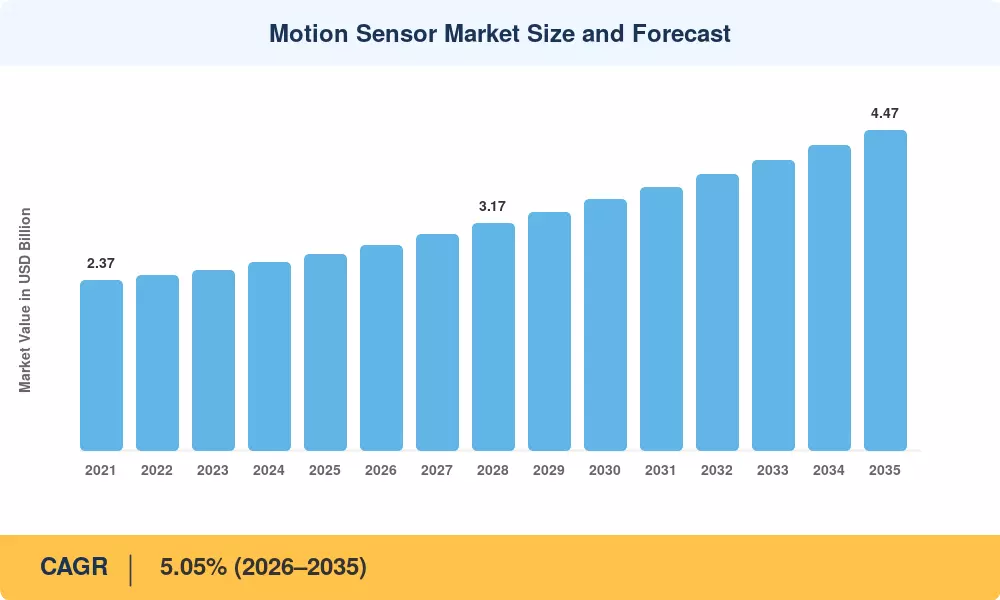
Motion Sensor Market Size and Forecast
Our Impact
Enabled $4.3B Revenue Impact for Fortune 500 and Leading Multinationals
Partnering with 2000+ Global Organizations Each Year
30K+ Citations by Top-Tier Firms in the Industry

Driver Impact Analysis

Driver ~% Impact on CAGR Geographic Relevance Impact Timeline
Mandatory automotive safety regulations ~18% Europe, North America Short-term (≤2 yr)
Smart-home ecosystem expansion ~16% North America, Asia-Pacific Medium-term (2–4 yr)
Edge-AI and ultra-low-power sensor design ~15% Global Medium-term (2–4 yr)
Industrial automation and robotics ~14% Asia-Pacific, Europe Long-term (≥4 yr)
Healthcare IoT and remote patient monitoring ~12% North America, Europe Medium-term (2–4 yr)
Smart-city infrastructure programs ~13% Asia-Pacific, MEA Long-term (≥4 yr)
LED lighting retrofit and energy codes ~12% Europe, North America Short-term (≤2 yr)


Mandatory Automotive Safety Regulations

The European New Car Assessment Programme (Euro NCAP) now requires improved pedestrian detection and automated emergency braking for all new passenger vehicles sold after 2024, with tighter limits due in 2027 [1]. These rules directly correlate to higher per-vehicle sensor content, with average motion-sensor bill-of-materials increasing from USD 28 to an expected USD 41 between 2022 and 2026 [8]. The U.S. Infrastructure Investment and Jobs Act has dedicated USD 7.5 billion to intelligent transportation systems through 2028, further ushering radar and combo-IMU sensor quantities into commercial-vehicle fleets [2].


Smart-Home Ecosystem Expansion

Connected-home device shipments surpassed 1.1 billion units globally in 2024, with motion-triggered security cameras, smart lighting, and HVAC occupancy controls representing the fastest-growing hardware categories [4]. Amazon, Google, and Apple's adoption of the Matter interoperability standard has eliminated a key friction point for sensor OEMs, enabling single-SKU products that work across ecosystems. North American broadband households with at least one motion-sensing device crossed the 45% threshold in late 2024, and European adoption trails by roughly 18 months [4][7].

Edge-AI and Ultra-Low-Power Sensor Design

Recent on-chip neural-network accelerators enable gesture recognition, fall detection, and occupancy counting at the edge, using motion sensors and power budgets below 50 microwatts [9]. In 2024, both STMicroelectronics and Bosch Sensortec announced sub-milliwatt IMU modules with machine-learning classifiers embedded in the sensor ASIC, removing the need for a separate microcontroller [3]. The design move is reducing sensor update cycles and expanding the range of addressable applications for battery-powered wearables and asset trackers.


Industrial Automation and Robotics Growth

The International Federation of Robotics reported a record 590,000 industrial robot installations worldwide in 2023, each requiring multiple motion and inertial sensors for navigation, collision avoidance, and vibration monitoring [12]. Collaborative robots (cobots) in particular demand high-precision six-axis IMUs that can operate in uncaged environments alongside human workers. Factory-floor IoT sensor meshes are expected to grow at double-digit rates through 2030 as manufacturers pursue predictive-maintenance strategies [14].


Restraints Impact Analysis

The restraint impact percentages below are directional estimates of headwinds against market growth. They should not be subtracted directly from the headline CAGR [5].

Restraint ~% Negative Impact on CAGR Geographic Relevance Impact Timeline
False triggers and environmental interference ~–15% Global Short-term (≤2 yr)
Semiconductor supply-chain cyclicality ~–14% Asia-Pacific, Global Medium-term (2–4 yr)
Privacy and regulatory pushback on sensing ~–12% Europe, North America Medium-term (2–4 yr)
Price erosion in commoditized PIR segments ~–10% Asia-Pacific Long-term (≥4 yr)
Integration complexity in legacy buildings ~–9% Europe, South America Long-term (≥4 yr)


False Triggers and Environmental Interference

Passive infrared sensors remain susceptible to false activations from HVAC airflow, pet movement, and direct sunlight, generating nuisance alerts that erode consumer confidence in smart-security systems [17]. Industry surveys indicate that approximately 35% of residential motion-sensor users have disabled at least one device due to persistent false alarms, effectively shrinking the addressable installed base. Dual-technology sensors combining PIR with microwave verification reduce false-trigger rates by roughly 80%. However, their higher price point (typically 2.5× a standalone PIR unit) slows adoption in price-sensitive residential segments [7].

Semiconductor Supply-Chain Cyclicality

Motion-sensor chipmakers remain exposed to the broader semiconductor cycle, which saw a 12% revenue contraction across the MEMS industry in the first half of 2023 before rebounding in late 2024 [6]. Lead times for specialty analog components used in signal conditioning still exceed 20 weeks during up-cycle peaks, forcing Tier-1 automotive suppliers to carry elevated buffer inventories. This cyclicality introduces demand volatility that complicates capacity-planning investments for sensor foundries in Taiwan and South Korea.

Privacy and Regulatory Pushback

The EU's AI Act, which entered phased enforcement in 2025, classifies certain occupancy-sensing and people-counting technologies as "high-risk" AI systems requiring conformity assessments and transparency disclosures [18]. Compliance costs for sensor OEMs selling into European commercial-building automation could rise by an estimated 8–12% of per-unit cost, potentially slowing deployment timelines. Similar regulatory frameworks under discussion in California and Canada's proposed Artificial Intelligence and Data Act add further uncertainty for cross-border product strategies.


Motion Sensor Market Opportunities

AI-Driven Context-Aware Occupancy Sensing

Next-generation motion sensors that fuse radar, thermal, and acoustic inputs through on-device AI models can distinguish between occupied-but-idle and actively-used spaces with over 95% accuracy [9]. Commercial real-estate operators targeting LEED and WELL certification increasingly demand this granularity for energy optimization, opening a premium sensor tier that commands 3–4× the ASP of conventional PIR modules.

Healthcare and Remote Patient Monitoring

Fall-detection wearables and contactless vital-sign monitors represent a USD 1.2 billion addressable opportunity within the broader Motion Sensor Market by 2030 [11]. Aging demographics in Japan, Germany, and Italy — where populations over 65 will exceed 30% by 2035 — create sustained demand for non-intrusive motion-sensing devices integrated into telehealth platforms.

Emerging-Market Smart-City Deployments

India's Smart Cities Mission has committed over USD 7.5 billion across 100 cities, with intelligent street-lighting and traffic-management systems requiring millions of motion-sensor nodes [10]. Similar programs in Saudi Arabia (NEOM), Egypt (New Administrative Capital), and Brazil (São Paulo Smart Corridors) are creating greenfield sensor demand in regions where legacy infrastructure is minimal.

Sensor-as-a-Service and Data Monetization

Building-management companies are piloting subscription models where motion-sensor hardware is deployed at no upfront cost and monetized through recurring analytics fees tied to occupancy dashboards and space-utilization reporting. This shift from capex to opex lowers adoption barriers for mid-market commercial tenants and creates annuity revenue streams for sensor OEMs.

Automotive Cabin-Sensing Mandates

Euro NCAP's 2026 protocol will award safety ratings based on driver-monitoring and child-presence-detection capabilities, both requiring interior-cabin motion sensors [1]. This mandate alone is expected to add approximately two additional sensor modules per vehicle across European and North American fleets, expanding the automotive motion-sensor TAM by an estimated 18–22% between 2026 and 2030.


Motion Sensor Market Future Outlook

AI-Enabled Autonomous Sensing Ecosystems

By 2030, an estimated 60% of newly deployed motion sensors will ship with embedded machine-learning inference capabilities, transforming them from simple detection switches into context-aware perception nodes [9]. This shift enables truly autonomous building-management systems that adjust lighting, HVAC, and security protocols in real time without human intervention, a capability that the IEA estimates could reduce commercial building energy consumption by 15–20% globally [15].

Platform Economics and Sensor-as-a-Service

The Motion Sensor Market is gravitating toward platform business models where hardware margins are secondary to recurring software and analytics revenue. Major players like Honeywell and Bosch are launching cloud-connected sensor platforms that bundle occupancy analytics, predictive maintenance dashboards, and energy-optimization APIs into subscription packages, mirroring the SaaS transition that reshaped enterprise software a decade ago.

Electrification and Sustainable Building Codes

Global construction codes are tightening rapidly: the EU's EPBD recast requires all new buildings to be zero-emission by 2030, and the U.S. DOE's updated ASHRAE 90.1 standard mandates occupancy-based controls in over 80% of commercial lighting zones [15][16]. These regulatory vectors guarantee a structural floor for motion-sensor demand in the built environment, independent of cyclical economic fluctuations. IRENA projects that smart-building sensor deployments will contribute to a cumulative 3.2 gigatons of CO₂ reduction between 2025 and 2040 [19].

Convergence of Sensing Modalities for Spatial Intelligence

The next decade will see radar, LiDAR, thermal, and inertial sensors converge into unified spatial-intelligence platforms capable of centimeter-level occupancy mapping across entire building floors [9][14]. This convergence unlocks use cases ranging from retail heat-mapping and warehouse logistics optimization to hospital patient-flow management. Companies investing in multi-modal sensor-fusion IP today will hold durable competitive advantages as the Motion Sensor Market transitions from point detection to holistic spatial awareness.


Motion Sensor Market Segmentation

By Technology

Segment Key Metric Primary Demand Driver
Infrared ~37.5% share (2025) Cost-effective residential and commercial security
Microwave USD 0.44 Billion (2025) Industrial and perimeter detection reliability
Ultrasonic 4.62% CAGR (2026–2035) Parking assist and proximity sensing
Radar / Tomographic 5.85% CAGR (2026–2035) Automotive ADAS and mmWave building sensing


Infrared technology remains the backbone of the Motion Sensor Market, deployed across residential security systems, commercial lighting controls, and consumer appliances due to its low component cost and mature supply chain. PIR modules retail for under USD 1.50 at volume, making them the default choice for price-sensitive applications in emerging markets. Radar and tomographic solutions, while representing a smaller installed base, are gaining rapid traction as millimeter-wave chipsets from Texas Instruments and Infineon drop below the USD 5 threshold for automotive-grade modules, enabling broader adoption in smart-building and gesture-recognition verticals [3][13].

By Functionality Level

Segment Key Metric Primary Demand Driver
Fully Automatic ~59.6% share (2025) Smart-home, automotive, and commercial automation
Semi-Automatic ~40.4% share (2025) Cost-constrained industrial and residential installations


Fully automatic motion sensors dominate the Motion Sensor Market because end users increasingly demand set-and-forget solutions that require no manual calibration or sensitivity adjustment. The proliferation of smartphone-configured sensor hubs and voice-assistant integration has accelerated this preference. Semi-automatic systems retain relevance in industrial environments where operators need manual override capabilities for safety-critical processes.

By Embedded Sensor Type

Segment Key Metric Primary Demand Driver
Combo / IMU ~36.2% share (2025) Multi-axis navigation, wearables, smartphones
Accelerometer 4.88% CAGR (2026–2035) Consumer electronics, vibration monitoring
Gyroscope USD 0.38 Billion (2025) Optical image stabilization, drone navigation
Magnetometer 4.45% CAGR (2026–2035) Compass functionality, indoor positioning


Combo/IMU modules command the largest share of the Motion Sensor Market by embedded sensor type because smartphone, wearable, and automotive platforms increasingly require six-axis or nine-axis inertial data from a single package. Bosch Sensortec's BMI270 and STMicroelectronics' LSM6DSO families set the performance benchmarks in this segment. Standalone accelerometers sustain healthy demand in industrial condition-monitoring and consumer step-counting applications where full IMU capability is unnecessary [3].

By Application

Segment Key Metric Primary Demand Driver
Consumer Electronics ~44.6% share (2025) Smartphone and wearable sensor integration
Automotive & Transportation USD 0.46 Billion (2025) ADAS mandates and cabin sensing
Smart Home & Building Automation 7.36% CAGR (2026–2035) Occupancy-based energy management
Healthcare & Medical Devices 6.42% CAGR (2026–2035) Remote patient monitoring, fall detection
Lighting Control ~8.5% share (2025) Energy-code compliance, retrofit programs


Consumer electronics continues to absorb the single largest slice of Motion Sensor Market revenues, driven by the smartphone replacement cycle and the proliferation of TWS earbuds and fitness trackers that embed accelerometers and gyroscopes. Smart-home and building-automation applications represent the fastest-growing vertical, with motion-triggered thermostats, security cameras, and automated lighting systems becoming standard features in new residential construction across North America and Europe [4][16].


Regional Market Share Analysis

Region Key Metric Primary Investment Themes
Asia-Pacific ~39.5% revenue share (2025) Consumer electronics manufacturing, smart-city infrastructure
North America ~26.8% revenue share (2025) Smart-home ecosystems, automotive ADAS
Europe ~22.3% revenue share (2025) Automotive safety mandates, energy-efficiency codes
South America ~5.2% revenue share (2025) Urban security systems, smart-lighting retrofit
Middle East & Africa 5.39% CAGR (2026–2035) Smart-building mega-projects, Vision 2030
Total USD 2.74 Billion (2025)

The Motion Sensor Market exhibits distinct regional growth profiles shaped by regulatory environments, infrastructure maturity, and consumer-technology adoption curves.


North America

Country Key Metric Key Driver
United States ~78% of regional share Smart-home adoption, ADAS mandates
Canada 4.85% CAGR (2026–2035) Building energy codes, healthcare IoT
Mexico USD 0.06 Billion (2025) Automotive assembly exports, industrial automation


The United States dominates the North American Motion Sensor Market, with smart-security camera shipments exceeding 42 million units in 2024 and the DOE's updated commercial building energy codes mandating occupancy-based lighting controls in all new federal facilities [4][15]. Canada's aggressive net-zero building standards and Mexico's expanding automotive-assembly sector for global OEMs provide complementary growth vectors across the region.

Europe

Country Key Metric Key Driver
Germany ~24% of regional share Automotive Tier-1 supplier base, Industrie 4.0
United Kingdom 5.12% CAGR (2026–2035) Smart-home retrofit, NHS telehealth
France USD 0.09 Billion (2025) Building energy performance regulations
Italy 4.78% CAGR (2026–2035) Aging population, home-automation subsidies
Spain ~6% of regional share Tourism-sector building automation
Nordic Countries 5.25% CAGR (2026–2035) Green building leadership, high digitalization
Russia USD 0.04 Billion (2025) Industrial and defense applications
Rest of Europe ~12% of regional share Varied regulatory adoption timelines


Europe's Motion Sensor Market benefits from the region's stringent automotive safety ecosystem centered on Euro NCAP protocols and the EU Energy Performance of Buildings Directive (EPBD), which mandates occupancy-responsive HVAC and lighting controls in all new commercial structures by 2027 [1][16]. Germany's dense automotive supply chain ensures high-volume consumption of IMU and radar modules. At the same time, the United Kingdom's NHS Long Term Plan drives motion-sensing wearable adoption for remote patient monitoring.

Asia-Pacific

Country Key Metric Key Driver
China ~42% of regional share MEMS fabrication, consumer electronics assembly
India 6.15% CAGR (2026–2035) Smart Cities Mission, industrial corridor development
Japan USD 0.18 Billion (2025) Aging-society robotics, automotive OEM demand
South Korea ~12% of regional share Semiconductor ecosystem, 5G infrastructure
ASEAN 5.68% CAGR (2026–2035) Urbanization, smart-building investment
Rest of Asia-Pacific ~7% of regional share Infrastructure modernization


Asia-Pacific's dominance in the Motion Sensor Market stems from China's role as the world's largest MEMS production base and the region's consumer-electronics assembly concentration [7]. India's Phase III Smart Cities Mission is deploying sensor-integrated street-lighting across 50 additional municipalities through 2028, while Japan's Society 5.0 initiative funds motion-sensing robotics for elderly care and logistics automation [10][14].

South America

Country Key Metric Key Driver
Brazil ~58% of regional share Urban security infrastructure, commercial construction
Argentina 4.52% CAGR (2026–2035) Industrial automation adoption
Rest of South America USD 0.03 Billion (2025) Gradual smart-building investment


Brazil's municipal security programs — particularly in São Paulo and Rio de Janeiro — continue to drive motion-sensor procurement for surveillance and access-control systems, while Argentina's growing industrial automation footprint is pulling sensor demand into manufacturing and logistics facilities across the Pampas industrial corridor.

Middle East & Africa

Country Key Metric Key Driver
Saudi Arabia ~32% of regional share NEOM, Vision 2030 smart infrastructure
UAE 5.58% CAGR (2026–2035) Smart-city standards, commercial building codes
South Africa USD 0.02 Billion (2025) Mining automation, urban security
Egypt 5.31% CAGR (2026–2035) New Administrative Capital sensor deployment
Rest of MEA ~22% of regional share Infrastructure modernization


The Middle East & Africa region is the fastest-growing geography in the Motion Sensor Market, driven almost entirely by Gulf Cooperation Council mega-projects that specify sensor-rich smart-building standards from the design phase [10]. Saudi Arabia's NEOM alone is projected to deploy over 4 million connected sensor nodes across its initial residential and commercial zones. At the same time, Egypt's New Administrative Capital integrates motion-sensing controls into all government and commercial buildings.


Motion Sensor Market By Region, 2025-2035

Competitive Benchmarking

The Motion Sensor Market exhibits moderate concentration, with an estimated Herfindahl-Hirschman Index (HHI) between 800 and 1,100, and the top five players collectively holding approximately 35–42% of global revenues. Competition centers on integrated design capability — firms that control MEMS fabrication, ASIC design, packaging, and application software capture the most durable design wins. Vertically integrated chipmakers maintain pricing power through proprietary sensor-fusion algorithms and direct OEM relationships, while smaller specialists compete on niche performance parameters or regional distribution strength.

Company Est. Revenue Share Range Key Offerings for the Motion Sensor Market Strategic Positioning
Bosch Sensortec ~8–11% BMI270 IMU, BMA400 accelerometer, smart-home hubs Vertically integrated MEMS leader; automotive + consumer
Honeywell International ~7–10% PIR occupancy sensors, building-automation platforms Building controls and aerospace sensor heritage
STMicroelectronics ~6–9% LSM6DSO IMU, IIS2ICLX inclinometer, automotive MEMS Broad automotive and industrial sensor portfolio
TDK Corporation (InvenSense) ~5–8% ICM-42688 IMU, ultrasonic ToF modules High-performance consumer and AR/VR motion tracking
Murata Manufacturing ~4–7% Gyroscopes, accelerometers, combo sensors Miniaturization expertise; strong Japanese OEM ties
TE Connectivity ~3–6% Industrial motion and vibration sensors Harsh-environment reliability; industrial automation
NXP Semiconductors ~3–5% Radar sensor SoCs, automotive motion processors Automotive radar leadership; UWB positioning
Panasonic Corporation ~3–5% PIR sensors, MEMS gyroscopes, smart-home modules Diverse consumer and industrial product lines
Microchip Technology ~2–4% Motion-sensing MCUs, gesture-recognition ICs Low-power embedded solutions; IoT edge platforms
Analog Devices ~2–4% High-precision MEMS accelerometers, IMUs Precision industrial and defense sensing applications


Recent News & Developments

  • STMicroelectronics (June 2026)—Launched the IIS3DWB10IS MEMS vibration sensor, featuring integrated AI processing to enable high-frequency condition monitoring and predictive maintenance for industrial equipment.
  • STMicroelectronics (April 2026)—Introduced the VD55G4 and VD65G4 ultra-low-power image sensors, designed with "detect-and-wake" functionality to support continuous monitoring in IoT and wearable applications.
  • Silvus Technologies (April 2026)—Released the FASST 6000 Spectrum Sensor, providing advanced RF movement and signal detection capabilities for tactical intelligence and distributed sensor networks.


Motion Sensor Market Report Scope

Parameter Detail
Market Scope Global Motion Sensor Market across technology, functionality, embedded sensor type, application, and geography
Study Period 2021–2035
CAGR (Forecast) 5.05% (2026–2035)
Base Year Market Size USD 2.74 Billion (2025)
Forecast Endpoint USD 4.47 Billion (2035)
Fastest Growing Segments Smart Home & Building Automation (by application); Radar/Tomographic (by technology); Middle East & Africa (by geography)
Companies Profiled Bosch Sensortec, Honeywell, STMicroelectronics, TDK Corporation, Murata Manufacturing, TE Connectivity, NXP Semiconductors, Panasonic Corporation, Microchip Technology, Analog Devices
Valuation Currency USD Billion


FAQs

How do dual-technology sensors compare to standalone PIR modules for commercial security installations?
Dual-technology sensors combining PIR with microwave verification reduce false alarms by approximately 80% but cost 2.5× more per unit [17]. Commercial projects with high foot traffic typically recover the premium within 12 months through reduced guard dispatches.
What certification requirements apply to motion sensors used in automotive cabin-monitoring systems?
Automotive cabin sensors must meet AEC-Q100 reliability qualification and comply with ISO 26262 functional-safety standards up to ASIL-B [1]. Regional type-approval bodies impose additional EMC and environmental-testing protocols.
How are subscription-based sensor deployment models changing procurement strategies for facility managers?
Sensor-as-a-service models shift costs from capex to opex, bundling hardware with recurring analytics fees [20]. Facility managers gain occupancy dashboards without large upfront investments, lowering adoption barriers for mid-market tenants.
What is the typical power budget for edge-AI-enabled motion sensors in battery-operated wearables?
Leading-edge AI motion sensors operate below 50 microwatts during always-on inference, enabling 12–18 months of battery life in coin-cell-powered wearables [9]. Power-gating architectures activate full processing only upon detecting a motion event.
How do MEMS packaging advances affect motion sensor module pricing trends?
Wafer-level chip-scale packaging has reduced MEMS die footprints by roughly 30% since 2021, lowering per-unit material costs by 15–20% [3]. These savings partially offset ASP pressure from commoditization in consumer-grade accelerometer segments.
What role do motion sensors play in achieving LEED and WELL building certifications?
LEED v4.1 awards up to three points for occupancy-responsive lighting and HVAC controls, requiring motion sensors in at least 75% of regularly occupied spaces [16]. WELL certification adds indoor-air-quality credits tied to occupancy-driven ventilation.
How does the EU AI Act classification affect motion-sensor-based people-counting systems?
The EU AI Act classifies certain occupancy-sensing systems as high-risk, requiring conformity assessments and transparency documentation [18]. Compliance costs may increase per-unit expenses by 8–12% for sensors sold into European commercial-building automation.    
Author
Author
Author Profile
Ankit Gupta LinkedIn
Team Lead - Research
Ankit Gupta is a seasoned market intelligence and strategic research professional with over six plus years of experience in the ICT and Semiconductor industries. With academic roots in Telecom, Marketing, and Electronics, he blends technical insight with business strategy. Ankit has led 200+ projects, including work for Fortune 500 clients like Microsoft and Rio Tinto, covering market sizing, tech forecasting, and go-to-market strategies. Known for bridging engineering and enterprise decision-making, his insights support growth, innovation, and investment planning across diverse technology markets.

Research Approach


Secondary Research

The secondary research process involved comprehensive analysis of regulatory databases, industry publications, technical standards documentation, and authoritative technology organizations. Key sources included the US Department of Energy (DOE), National Institute of Standards and Technology (NIST), Institute of Electrical and Electronics Engineers (IEEE), International Electrotechnical Commission (IEC), US Consumer Product Safety Commission (CPSC), Occupational Safety and Health Administration (OSHA), European Committee for Electrotechnical Standardization (CENELEC), Japan Electronics and Information Technology Industries Association (JEITA), International Data Corporation (IDC), Consumer Technology Association (CTA), SEMI (Semiconductor Equipment and Materials International), National Electronics Manufacturing Initiative (NEMI), Security Industry Association (SIA), Automotive Industry Action Group (AIAG), and national technology ministry reports from key markets. These sources were used to collect shipment statistics, regulatory compliance data, technical safety studies, adoption trends, and competitive landscape analysis for passive infrared sensors, ultrasonic sensors, microwave sensors, dual technology sensors, and tomographic sensor technologies.


Primary Research

Qualitative and quantitative insights were obtained by interviewing supply-side and demand-side stakeholders during the primary research process. The supply-side sources consisted of CEOs, VPs of Engineering, product management leaders, and strategic sourcing directors from OEMs, semiconductor foundries, and motion sensor manufacturers. Demand-side sources consist of procurement leads from smart home device manufacturers, industrial automation firms, healthcare technology providers, automotive Tier 1 suppliers, and automotive electronics engineers, as well as IoT systems integrators, building automation consultants, and security systems architects. Market segmentation was verified, technology roadmaps were confirmed, and insights regarding integration patterns, pricing strategies, and supply chain dynamics were obtained through primary research.

Primary Respondent Breakdown:

By Designation: C-level Primaries (32%), Director Level (30%), Others (38%)

By Region: North America (32%), Europe (30%), Asia-Pacific (28%), Rest of World (10%)


Market Size Estimation

Global market valuation was derived through revenue mapping and unit shipment analysis. The methodology included:

Identification of 50+ key manufacturers across North America, Europe, Asia-Pacific, and Latin America

Product mapping across passive infrared, ultrasonic, microwave, dual technology, and tomographic sensor categories

Analysis of reported and modeled annual revenues specific to motion sensor portfolios

Coverage of manufacturers representing 75-80% of global market share in 2024

Extrapolation using bottom-up (unit volume × ASP by application/region) and top-down (manufacturer revenue validation) approaches to derive segment-specific valuations

Download Free Sample

Kindly complete the form below to receive a free sample of this Report

Download PDF ×

We do not share your information with anyone. However, we may send you emails based on your report interest from time to time. You may contact us at any time to opt-out.
















