Naphtha Market (2026 - 2035)

Naphtha Market Research Report Information By Type (Light Naphtha and Heavy Naphtha), By Application (Chemicals, Energy and Fuel and Others), By Process (Gasoline Blending, Naphtha Reforming, Steam Cracking and Others), and By Region (North America, Europe, Asia-Pacific, And Rest Of The World) – Market Forecast Till 2035
ID: MRFR/CnM/0481-HCR
111 Pages
Chitranshi Jaiswal
Last Updated: July 11, 2026
Naphtha Market
Market Size
Forecast Period2026-2035
CAGR (2026-2035)4.25%
2025 Market SizeUSD 185,400 Million
2035 Market SizeUSD 281,100 Million
Key Players
Shell plc
ExxonMobil
TotalEnergies
Saudi Aramco
Reliance Industries
BP plc
Opportunities
  • Bio-Naphtha Scale-Up in Europe and North America
  • Digital Naphtha Trading and Price Transparency Platforms
  • Emerging-Market Refinery-Petrochemical Integration

Naphtha Market Summary

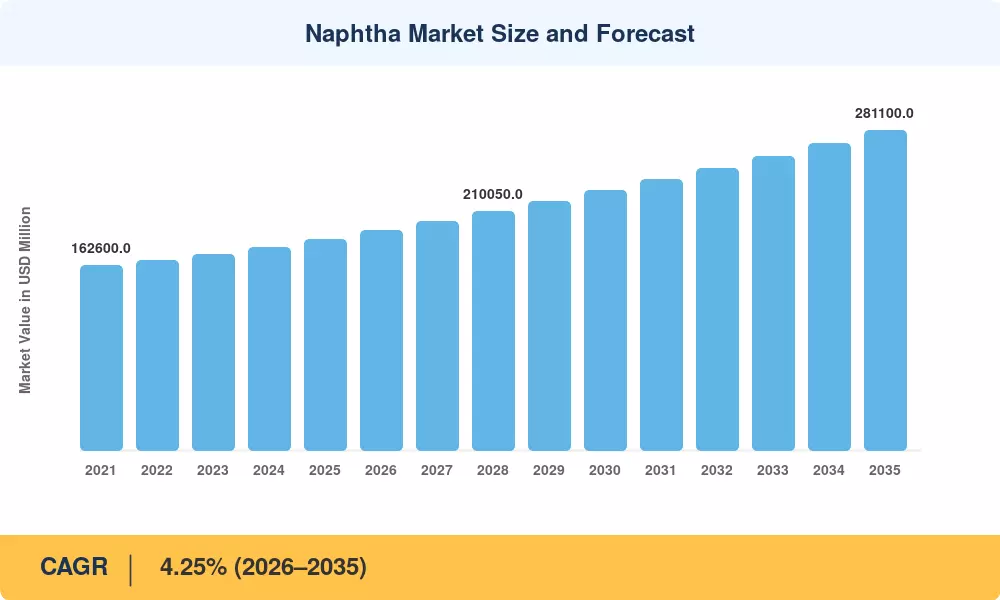
The global Naphtha Market reached an estimated USD 185,400 Million in 2025 and is projected to grow from USD 193,280 Million in 2026 to USD 281,100 Million by 2035, registering a CAGR of 4.25% during the forecast period. This expansion is anchored in sustained petrochemical feedstock demand from integrated olefin complexes across East and Southeast Asia, where governments have approved over USD 48 billion in new cracker investments since 2022 [2]. Policy catalysts such as China's 14th Five-Year Plan petrochemical capacity targets and India's Petroleum, Chemicals and Petrochemicals Investment Region (PCPIR) framework continue to underpin long-term volume commitments in the Naphtha Market.

A structural transformation is reshaping how refiners and traders value light hydrocarbon mixtures. Legacy straight-run processing routes are gradually giving way to advanced catalytic reforming units and modular steam cracking feedstock configurations designed to extract higher-value aromatics and olefins from the same barrel. The European Union's Renewable Energy Directive III (RED III) mandates a minimum 5.5% advanced-biofuel share in transport fuels by 2030, driving investment in bio-naphtha production that exceeded EUR 2.1 billion in announced capacity between 2023 and 2025 [3].

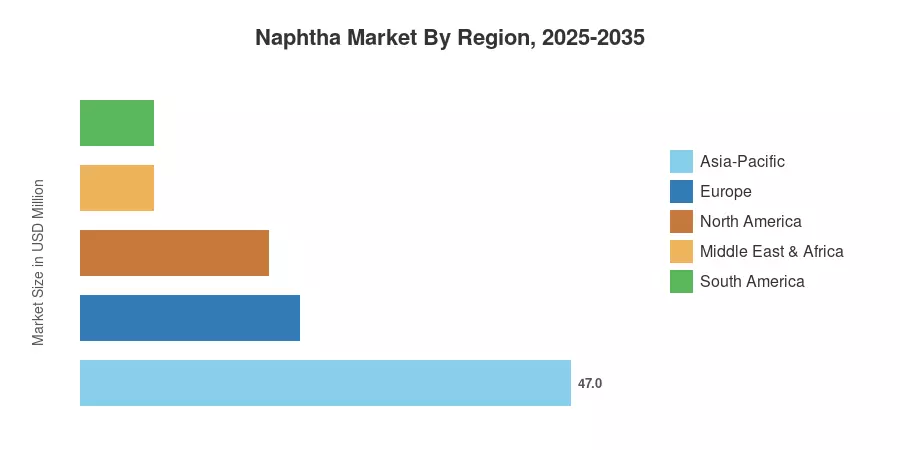
Asia-Pacific dominates the Naphtha Market with approximately 47% of global demand, supported by China, India, Japan, and South Korea's combined refinery products output. Europe holds the second-largest share at roughly 21%, while North America accounts for 18%. The fastest regional growth belongs to Asia-Pacific, expanding at a 5.05% CAGR as new mega-crackers in Zhejiang, Gujarat, and Rayong come online before 2030. As circular-feedstock substitution accelerates in developed regions and greenfield capacity rises in emerging economies, the Naphtha Market is set for a decade of compositional change alongside steady volume growth.


Key Report Takeaways — Naphtha Market

By Type

  • Light naphtha commanded 61.5% of the naphtha market volume in 2025, driven by catalytic reformer demand for low-boiling-point hydrocarbon solvents and aromatic chemical feedstock
  • Heavy naphtha is forecast to grow at a 3.48% CAGR through 2035, supported by residue-upgrading programs in Middle Eastern refineries

By Source

  • Refinery-based grades retained roughly 74% of the Naphtha Market in 2025, reflecting the dominance of integrated refining-petrochemical complexes
  • Bio-naphtha is advancing at a 5.90% CAGR to 2035, the fastest among all source segments, propelled by EU RED III mandates and California LCFS credits

By End-User

  • Petrochemicals consumed 64% of global naphtha volume, as steam cracking feedstock requirements from ethylene producers remain the primary consumption driver
  • Paints and coatings end-users are expanding at a 4.10% CAGR, underpinned by construction activity in Southeast Asia

By Region

  • Asia-Pacific held 47% of the Naphtha Market demand in 2025, with new cracker capacity in China and India absorbing incremental supply
  • North America is experiencing a refinery products surplus from condensate splitter expansions along the Gulf Coast


Naphtha Market Size and Forecast (2021–2035)

MRFR's proprietary estimation framework integrates refinery throughput data from the IEA, trade-flow statistics from UN Comtrade, and company-level production disclosures to construct both historical and forward-looking Naphtha Market valuations. Forecast assumptions incorporate planned capacity additions, announced plant closures, and policy-driven demand shifts across chemical processing fuels and fuel blending components.
Naphtha Market Size and Forecast
Our Impact
Enabled $4.3B Revenue Impact for Fortune 500 and Leading Multinationals
Partnering with 2000+ Global Organizations Each Year
30K+ Citations by Top-Tier Firms in the Industry

Driver Impact Analysis

Driver ~% Impact on CAGR Geographic Relevance Impact Timeline
Mega-cracker capacity additions in Asia +1.10% Asia-Pacific Short-term (≤2 yr)
Bio-naphtha policy mandates (RED III, LCFS) +0.65% Europe, North America Medium-term (2–4 yr)
Catalytic reforming modernization +0.50% Global Medium-term (2–4 yr)
Rising aromatic chemical feedstock demand +0.45% Asia-Pacific, Europe Long-term (≥4 yr)
Fuel blending specification tightening +0.35% North America, Europe Medium-term (2–4 yr)
Condensate splitter expansions +0.30% North America Short-term (≤2 yr)
Circular pyrolysis oil integration +0.25% Europe Long-term (≥4 yr)


Mega-Cracker Capacity Additions in Asia

China's Zhejiang Petrochemical Phase II and India's Jamnagar SEZ expansion together add over 4 million tons per year of ethylene capacity that depends heavily on steam cracking feedstock derived from light naphtha. The combined capital outlay exceeds USD 22 billion, and both complexes have locked multi-year naphtha term contracts with Middle Eastern and West African suppliers through 2029 [2]. This structural demand pull is the single largest driver of the Naphtha Market through the near term.

Bio-Naphtha Policy Mandates

The EU's RED III directive requires member states to achieve a 5.5% advanced-biofuel share in transport energy by 2030, creating policy-linked premiums that make bio-naphtha production commercially viable at scale. In California, Low Carbon Fuel Standard (LCFS) credit prices averaged USD 68 per ton of CO₂ equivalent in 2024, incentivizing refiners to blend renewable petrochemical feedstock into their steam cracker feed slats [3]. Neste's Rotterdam and Singapore bio-refineries account for approximately 1.5 Mt/yr of bio-naphtha supply, with three additional facilities under construction.

Catalytic Reforming Modernization

Refiners globally are investing an estimated USD 9.4 billion in continuous catalytic reformer (CCR) upgrades between 2024 and 2030, targeting higher aromatics yields from the same light naphtha barrel. These modernized units demand tighter boiling-range specifications, which in turn increases the premium for chemical-grade hydrocarbon solvents relative to commodity-grade material. The resulting quality segmentation is reshaping trade flows in the Naphtha Market and rewarding suppliers with precise distillation control.

Rising Aromatic Chemical Feedstock Demand

Global paraxylene demand — the primary downstream pull for aromatic chemical feedstock — is projected to grow at 4.8% annually through 2032, driven by PET resin consumption in Asia-Pacific packaging sectors [6]. Each ton of paraxylene produced requires approximately 7.5 tons of reformer-grade naphtha, establishing a durable volume linkage between aromatics growth and the Naphtha Market.


Restraints Impact Analysis

Restraint ~% Impact on CAGR Geographic Relevance Impact Timeline
Ethane cracker substitution –0.55% North America, MEA Short-term (≤2 yr)
Decarbonization pressure on refinery throughput –0.40% Europe Long-term (≥4 yr)
Crude oil price volatility –0.30% Global Short-term (≤2 yr)
Propane dehydrogenation (PDH) competition –0.25% China, North America Medium-term (2–4 yr)
Trade policy and tariff uncertainty –0.20% Global Medium-term (2–4 yr)


Ethane Cracker Substitution

North American and Middle Eastern chemical processing fuels economics overwhelmingly favor ethane over naphtha as an olefin feedstock. U.S. Gulf Coast ethane crackers operated at a USD 180/ton cost advantage versus naphtha-based units throughout 2024 [15]. Each new ethane cracker displaces roughly 0.8–1.0 Mt/yr of naphtha demand, and six projects are scheduled for commissioning in the U.S. and Saudi Arabia by 2028.

Decarbonization Pressure on European Refinery Throughput

By 2030, the EU's Fit for 55 package aims to reduce greenhouse gas emissions by 55%, which would result in fewer crude runs at various European refineries. An estimated 1.8 Mt/yr of refinery products, including naphtha, have already been removed from the European supply due to closures at Grangemouth (UK) and Schwedt partial idling (Germany) [16]. The net result is a tightening supply balance that increases procurement prices for regional purchasers in the Naphtha Market, even though circular pyrolysis oil partially compensates for lost volumes.


Crude Oil Price Volatility

Naphtha pricing and margin calculations for importers of industrial petroleum products are directly impacted by changes in Brent crude. Front-month Brent fluctuated between USD 71 and USD 93 per barrel in 2024, which caused steam cracker operators with term-locked feedstock costs to experience margin compression [17]. Long-term capital commitments are discouraged by such volatility, which also adds uncertainty to the forward curve of the naphtha market.


Naphtha Market Opportunities

Bio-Naphtha Scale-Up in Europe and North America

Policy-linked premiums in Europe (RED III) and California (LCFS) create a runway for bio-naphtha capacity to triple from 2.1 Mt/yr in 2025 to over 6 Mt/yr by 2032. Early movers securing certified sustainable feedstock supply chains will capture pricing power in a segment growing at 5.90% CAGR This represents the highest-margin opportunity in the Naphtha Market today.

Digital Naphtha Trading and Price Transparency Platforms

Blockchain-enabled commodity trading platforms such as VAKT and Komgo are reducing settlement times for refinery products transactions from five days to near real-time. Adoption of digital platforms enables smaller traders and downstream petrochemical feedstock buyers to access spot liquidity previously reserved for majors Platform economics could unlock USD 2.5 billion in efficiency gains across the naphtha value chain by 2030 [20].

Emerging-Market Refinery-Petrochemical Integration

A significant increase in demand for imported light hydrocarbon mixtures will result from the commissioning of integrated refinery-petrochemical complexes in nations like Nigeria, Indonesia, and Vietnam. With a dedicated naphtha hydrotreater feeding a 780 kt/yr polypropylene unit, the Dangote Refinery in Lagos alone has a 650,000 bpd crude capacity Suppliers who sign term contracts early benefit from these greenfield projects' first-mover advantages.


Circular Pyrolysis Oil as Supplementary Feedstock

With ISCC PLUS certification, European steam crackers are including up to 15% pyrolysis oil made from mixed plastic waste into their naphtha feed slats. For chemical processing fuel manufacturers engaging in pyrolysis technology, this circular-feedstock route provides a new revenue stream and fetches premiums of EUR 150–250/ton over fossil grades


Specialty Hydrocarbon Solvents for Electronics Manufacturing

The semiconductor fabrication boom in East Asia and the U.S. CHIPS Act investment cycle are driving demand for ultra-high-purity hydrocarbon solvents derived from naphtha fractionation. This niche application commands margins 3–4× higher than commodity-grade material and is expanding at an estimated 6.2% CAGR [21]


Naphtha Market Future Outlook

Digitalization of Feedstock Optimization

Artificial intelligence and digital-twin technology are enabling refiners to optimize naphtha cut-point selection in real time, improving aromatic chemical feedstock yields by 2–3% per barrel. The IEA estimates that digitalization across refining could unlock USD 15 billion in annual value by 2030 [23]. For the Naphtha Market, this means higher-quality differentiated products commanding premium pricing in competitive petrochemical feedstock procurement.

Electrification and the Shifting Refinery Slate

The global electrification supercycle — projected at USD 6.7 trillion of investment through 2035 by IRENA — will reduce gasoline demand in OECD markets, pushing refiners to re-allocate light hydrocarbon mixtures toward petrochemical routes rather than fuel blending components [24]. This refinery-to-petrochemical pivot increases available naphtha supply for crackers and reformers, structurally benefiting the Naphtha Market's volume trajectory.

ESG Reporting and Carbon-Intensity Tracking

Scope 3 emissions reporting under ISSB standards is compelling petrochemical buyers to track the carbon footprint of every ton of steam cracking feedstock purchased. Bio-naphtha and mass-balance-certified circular grades carry lower embedded carbon scores, creating a two-tier pricing structure that will reshape competitive dynamics in the Naphtha Market through 2035 [16].

Hydrogen Economy Implications

Green hydrogen adoption in refinery hydroprocessing units could alter naphtha economics by reducing the cost of hydrotreating heavy fractions into lighter chemical processing fuels. The U.S. DOE's Hydrogen Shot program targets USD 1/kg green hydrogen by 2030, which, if achieved, could lower naphtha hydrotreating costs by an estimated 12–18% and expand refinery products yield flexibility [25].


Naphtha Market Segmentation

By Type

Segment Key Metric Primary Demand Driver
Light Naphtha 61.5% share (2025) Catalytic reformer and steam cracking feedstock demand
Heavy Naphtha 3.48% CAGR (2026–2035) Residue upgrading and gasoline fuel blending components


Light naphtha dominates the Naphtha Market because catalytic reformers and ethylene crackers require low-boiling-point fractions to maximize aromatics and olefin yields. The segment's pricing premium over heavy grades averaged USD 35–50/ton in 2024, reflecting tight supply from high-conversion refineries. Asia-Pacific's new mega-crackers are configured almost exclusively for light naphtha feed, reinforcing this segment's structural advantage as the primary petrochemical feedstock globally.

Heavy naphtha serves gasoline blending pools and, increasingly, feeds residue-upgrading hydrocrackers in Middle Eastern refineries. Saudi Aramco's Ras Tanura and Jazan refineries are among the largest consumers of heavy-grade industrial petroleum products for secondary conversion, sustaining steady demand even as the lighter fraction captures the headline growth.

By Source

Segment Key Metric Primary Demand Driver
Refinery-Based 74% share (2025) Integrated refining-petrochemical operations
Bio-Naphtha 5.90% CAGR (2026–2035) RED III, LCFS policy mandates
Others (Condensate, GTL) USD 18,400 Million (2025) Condensate splitter and GTL-derived supply


Refinery-based naphtha remains the backbone of global supply, flowing from crude distillation units directly into integrated steam crackers and reformers. The dominance of this source in the Naphtha Market reflects decades of infrastructure investment by refinery-integrated producers such as ExxonMobil, Shell, and Reliance Industries. Bio-naphtha, though still small in absolute volume, is the fastest-growing source segment. Neste, TotalEnergies, and ENI are scaling production of hydrogenated vegetable oil (HVO)-derived petrochemical raw materials certified under ISCC PLUS, commanding premiums of EUR 200–350/ton above fossil equivalents.

By End-User Industry

Segment Key Metric Primary Demand Driver
Petrochemicals 64% share (2025) Ethylene and aromatics production via steam cracking feedstock
Agriculture 3.65% CAGR Solvent-grade naphtha for agrochemical formulations
Paints & Coatings 4.10% CAGR Construction-sector hydrocarbon solvents demand
Aerospace USD 2,400 Million (2025) Specialty fuel blending components for jet-range products
Other Industries 3.20% CAGR Varied industrial petroleum products applications


The petrochemicals segment is the undisputed volume driver for the Naphtha Market, consuming light and heavy grades alike as the principal input for ethylene, propylene, butadiene, and benzene-toluene-xylene (BTX) production. Asia-Pacific's ethylene capacity expansion alone will absorb an incremental 12 Mt/yr of naphtha by 2030. The paints and coatings segment benefits from urbanization-driven construction activity, particularly in India and ASEAN economies, where hydrocarbon solvents derived from naphtha remain the preferred formulation base over water-based alternatives in industrial applications.


Regional Market Share Analysis

Region Key Metric Primary Investment Themes
Asia-Pacific 47% share (2025) Mega-cracker builds; aromatic chemical feedstock expansion
Europe 21% share (2025) Bio-naphtha mandates; circular pyrolysis integration
North America 18% share (2025) Condensate splitter exports; ethane substitution dynamics
South America 7% share (2025) Refinery modernization; Braskem-led petrochemical growth
Middle East & Africa 7% share (2025) Integrated refinery-petrochemical complexes; export hub development
Total 100%

The Naphtha Market exhibits pronounced regional concentration, with Asia-Pacific alone absorbing nearly half of global volumes. Regional trade flows are shaped by refinery configuration, petrochemical feedstock requirements, and policy-driven transitions toward bio-naphtha and circular alternatives.


North America

Country Key Metric Key Driver
United States 4.05% CAGR Condensate splitter expansion along the U.S. Gulf Coast
Canada USD 4,800 Million (2025) Alberta oil-sands upgrader output
Mexico 3.15% CAGR Dos Bocas refinery ramp-up


The North American Naphtha Market is shaped by a structural surplus of light naphtha from condensate splitters in Texas and Louisiana, which increasingly serves as an export feedstock for Asian and European steam cracking feedstock buyers. U.S. naphtha exports grew 14% year-on-year in 2024, reaching 420 kt/month [13]. Mexico's Dos Bocas refinery, once fully operational, will absorb a portion of Gulf Coast light hydrocarbon mixtures domestically, partially rebalancing regional flows.

Europe

Country Key Metric Key Driver
Germany USD 8,200 Million (2025) BASF Ludwigshafen steam cracker complex
United Kingdom 2.95% CAGR Post-Grangemouth supply rebalancing
France 3.10% CAGR TotalEnergies Gonfreville reformer upgrade
Italy USD 4,100 Million (2025) ENI biorefinery integration
Spain 3.25% CAGR Repsol Puertollano aromatics expansion
Nordic Countries USD 3,600 Million (2025) Neste bio-naphtha production hub
Russia USD 5,400 Million (2025) Domestic refinery products self-sufficiency
Rest of Europe 3.00% CAGR Varied refinery modernization programs


Europe's Naphtha Market is undergoing a dual transition — declining conventional refinery throughput under Fit for 55 mandates combined with rapid growth in bio-naphtha and circular pyrolysis oil volumes. Germany remains the continent's largest consumer, driven by BASF and Dow Stade integrated crackers, while Nordic producers like Neste command premium pricing for ISCC PLUS-certified renewable petrochemical raw materials [3].

Asia-Pacific

Country Key Metric Key Driver
China 5.15% CAGR Zhejiang Phase II; Shandong Yulong mega-cracker
India USD 12,500 Million (2025) IOCL Panipat; Reliance Jamnagar expansion
Japan 2.85% CAGR Domestic cracker consolidation and efficiency gains
South Korea USD 9,800 Million (2025) SK-Hyundai petrochemical feedstock demand
ASEAN 5.35% CAGR Thai and Vietnamese integrated complexes
Rest of Asia-Pacific 4.20% CAGR Emerging refinery-petrochemical projects


Asia-Pacific is the engine of the Naphtha Market, absorbing incremental supply from the Middle East, West Africa, and North America to feed a build-out of ethylene and aromatics capacity unprecedented in scale. China alone is expected to add 15 Mt/yr of new cracker capacity between 2025 and 2030, while India's PCPIR zones are attracting over USD 18 billion in downstream investments that rely on imported and domestic steam cracking feedstock [2][9].

South America

Country Key Metric Key Driver
Brazil USD 8,900 Million (2025) Braskem ethylene complex at Triunfo and Camaçari
Argentina 3.50% CAGR Vaca Muerta condensate-derived naphtha supply growth
Rest of South America 2.80% CAGR Limited cracker capacity; import dependency


Brazil anchors the South American Naphtha Market through Braskem's integrated polyethylene and polypropylene operations, which consume approximately 4.5 Mt/yr of naphtha-range chemical processing fuels. Argentina's Vaca Muerta shale play is producing increasing volumes of condensate, offering a potential local naphtha source that could reduce the region's import dependency over the next decade [22].

Middle East & Africa

Country Key Metric Key Driver
Saudi Arabia 4.60% CAGR Amiral complex; SATORP refinery-petrochemical integration
UAE USD 3,200 Million (2025) ADNOC Ruwais and Borouge expansion
South Africa 2.70% CAGR Sasol GTL-derived naphtha output
Egypt 3.40% CAGR Tahrir Petrochemicals Complex startup
Rest of MEA 3.10% CAGR Emerging refinery projects; Dangote commissioning


The Middle East is transitioning from a pure naphtha exporter to a balanced exporter-consumer as integrated complexes like Saudi Arabia's Amiral and the UAE's Borouge 4 add downstream industrial petroleum products capacity. Africa's Naphtha Market is nascent but growing, led by Nigeria's Dangote refinery and Egypt's Tahrir complex, both of which represent first-of-their-kind refinery-petrochemical integration on the continent [8].


Naphtha Market By Region, 2025-2035

Competitive Benchmarking

The Naphtha Market exhibits medium concentration, with the top five producers accounting for an estimated 28–35% of global merchant supply. A Herfindahl-Hirschman Index (HHI) in the 800–1,100 range reflects a fragmented competitive field where national oil companies, international oil majors, and independent refiners coexist. Competition centers on contract reliability, product quality specifications, and logistical proximity to consuming petrochemical feedstock complexes.

Company Est. Revenue Share Range Key Offerings for Naphtha Market Strategic Positioning
Shell plc ~6–9% Full-range refinery products; bio-naphtha via Shell Energy Integrated supermajor with global trading reach
ExxonMobil ~5–8% Light and heavy naphtha from Baytown, Singapore, Rotterdam Refinery-petrochemical integration leader
TotalEnergies ~4–7% Bio-naphtha; Gonfreville and Antwerp reformer output European circular-feedstock pioneer
Saudi Aramco ~5–8% Export-grade light naphtha from Ras Tanura and Yanbu Largest single-country naphtha exporter
Reliance Industries ~4–6% Jamnagar complex; steam cracking feedstock self-supply India's dominant refiner-petrochemical operator
BP plc ~3–5% Whiting, Gelsenkirchen refinery grades Pivot toward integrated energy and trading
SABIC ~3–5% Jubail-integrated chemical processing fuels Downstream petrochemicals-linked supply
Neste Oyj ~2–4% ISCC PLUS-certified bio-naphtha and renewable grades Global bio-naphtha market share leader
Formosa Petrochemical ~2–4% Mailiao complex; Taiwan-based aromatic chemical feedstock Cost-competitive Asian refiner
SK Energy ~2–3% Ulsan refinery; South Korean petrochemical raw materials supply Integrated Korean energy-chemicals group


Recent News & Developments

  • Neste Oyj (March 2025): Announced a 400 kt/yr bio-naphtha capacity expansion at its Rotterdam facility, targeting ISCC PLUS-certified supply for European petrochemical feedstock buyers [3].
  • Saudi Aramco (January 2025): Signed a five-year naphtha term contract with Zhejiang Petrochemical for 2.4 Mt/yr, the largest single supply agreement in the Naphtha Market's recent history [8].
  • BASF SE (November 2024): Commissioned a ChemCycling pyrolysis oil integration unit at Ludwigshafen, capable of processing 120 kt/yr of circular-derived light hydrocarbon mixtures [11].
  • Reliance Industries (September 2024): Completed the debottlenecking of Jamnagar's ethylene cracker, increasing naphtha intake capacity by 800 kt/yr to meet rising domestic steam cracking feedstock demand [9].
  • European Commission (July 2024): Finalized RED III implementing rules requiring 5.5% advanced-biofuel share by 2030, directly stimulating bio-naphtha investment across the EU [3].
  • ExxonMobil (April 2024): Inaugurated a new condensate splitter at Beaumont, Texas, adding 250 kbpd of light naphtha export capacity to the Gulf Coast refinery products hub [13].
  • TotalEnergies (January 2024): Acquired a 50% stake in a Finnish pyrolysis oil start-up, signaling strategic commitment to circular hydrocarbon solvents and aromatic chemical feedstock production [27].
  • Indian Oil Corporation (October 2023): Received board approval for the USD 5.5 billion Panipat Refinery expansion, including a 1.2 Mt/yr naphtha-fed olefin complex [9].


Naphtha Market Report Scope

Parameter Detail
Market Scope Global Naphtha Market encompassing refinery-based, bio-naphtha, and other sources
Study Period 2021–2035
CAGR 4.25% (2026–2035)
Base Year Market Size USD 185,400 Million (2025)
Forecast Endpoint USD 281,100 Million (2035)
Fastest Growing Segment Bio-Naphtha (by source, 5.90% CAGR); Asia-Pacific (by region, 5.05% CAGR)
Companies Profiled Shell, ExxonMobil, TotalEnergies, Saudi Aramco, Reliance Industries, BP, SABIC, Neste, Formosa Petrochemical, SK Energy
Valuation Currency USD Million


FAQs

What is the current valuation of the Naphtha Market as of 2024?

The Naphtha Market was valued at 316.08 USD Billion in 2024.

What is the projected market valuation for the Naphtha Market in 2035?

The Naphtha Market is projected to reach a valuation of 466.4 USD Billion by 2035.

What is the expected CAGR for the Naphtha Market during the forecast period 2025 - 2035?

The expected CAGR for the Naphtha Market during the forecast period 2025 - 2035 is 3.6%.

Which companies are considered key players in the Naphtha Market?

Key players in the Naphtha Market include Saudi Aramco, ExxonMobil, Royal Dutch Shell, BP, TotalEnergies, Chevron, Reliance Industries, PetroChina, and SABIC.

What are the main segments of the Naphtha Market by type?

The main segments by type are Light Naphtha, valued at 186.4 USD Billion, and Heavy Naphtha, valued at 280.0 USD Billion.

How is the Naphtha Market segmented by application?

The Naphtha Market is segmented by application into Chemicals, valued at 186.4 USD Billion, Energy and Fuel, valued at 220.0 USD Billion, and Others, valued at 60.0 USD Billion.

What processes are included in the Naphtha Market segmentation?
The Naphtha Market includes processes such as Gasoline Blending, valued at 150.0 USD Billion, Naphtha Reforming, valued at 120.0 USD Billion, and Steam Cracking, valued at 130.0 USD Billion.
What is the valuation of the Chemicals segment in the Naphtha Market?
The Chemicals segment in the Naphtha Market was valued at 186.4 USD Billion in 2024.
What is the valuation of the Energy and Fuel segment in the Naphtha Market?
The Energy and Fuel segment in the Naphtha Market is valued at 220.0 USD Billion.
What are the projected trends for the Naphtha Market in the coming years?
The Naphtha Market is expected to grow steadily, with a projected valuation of 466.4 USD Billion by 2035, driven by a CAGR of 3.6%.
Author
Author
Author Profile
Chitranshi Jaiswal LinkedIn
Team Lead - Research
Chitranshi is a Team Leader in the Chemicals & Materials (CnM) and Energy & Power (EnP) domains, with 6+ years of experience in market research. She leads and mentors teams to deliver cross-domain projects that equip clients with actionable insights and growth strategies. She is skilled in market estimation, forecasting, competitive benchmarking, and both primary & secondary research, enabling her to turn complex data into decision-ready insights. An engineer and MBA professional, she combines technical expertise with strategic acumen to solve dynamic market challenges. Chitranshi has successfully managed projects that support market entry, investment planning, and competitive positioning, while building strong client relationships. Certified in Advanced Excel & Power BI she leverages data-driven approaches to ensure accuracy, clarity, and impactful outcomes.

Research Approach


Secondary Research

The secondary research process involved comprehensive analysis of regulatory databases, industry publications, energy sector reports, and authoritative petrochemical organizations. Key sources included the US Energy Information Administration (EIA), International Energy Agency (IEA), Organization of the Petroleum Exporting Countries (OPEC), International Renewable Energy Agency (IRENA), American Fuel & Petrochemical Manufacturers (AFPM), European Chemical Industry Council (Cefic), American Petroleum Institute (API), International Energy Forum (IEF), National Institute of Standards and Technology (NIST), US Environmental Protection Agency (EPA), European Environment Agency (EEA), International Maritime Organization (IMO), World Bank Commodity Markets, BP Statistical Review of World Energy, and national energy ministry reports from key markets. These sources were used to collect production statistics, refining capacity data, trade flow analysis, regulatory compliance requirements, and market landscape analysis for light naphtha, heavy naphtha, gasoline blending applications, steam cracking operations, and naphtha reforming processes.


Primary Research

Qualitative and quantitative insights were obtained by interviewing supply-side and demand-side stakeholders during the primary research process. CEOs, VPs of Refining Operations, regulatory affairs heads, and commercial directors from independent refiners, petrochemical manufacturers, and integrated oil corporations comprised the supply-side sources. Energy trading analysts, procurement heads from chemical plants, gasoline blending facility managers, steam cracker operators, and supply chain directors from petrochemical complexes, fuel distribution companies, and industrial end-users constituted demand-side sources. Market segmentation was verified, refinery expansion timelines were confirmed, and insights regarding feedstock sourcing patterns, pricing benchmarks, and regulatory compliance dynamics were obtained through primary research.

Primary Respondent Breakdown:

By Designation: C-level Primaries (28%), Director Level (32%), Others (40%)

By Region: North America (32%), Europe (30%), Asia-Pacific (33%), Rest of World (5%)


Market Size Estimation

Global market valuation was derived through production volume analysis and revenue mapping across the value chain. The methodology included:

Identification of over 50 significant refiners and petrochemical producers in North America, Europe, Asia-Pacific, the Middle East, and Latin America

Product mapping across light naphtha, heavy naphtha, and specialty naphtha grades

Process analysis covering gasoline blending, naphtha reforming, steam cracking, and other derivative applications

Analysis of reported and modeled annual revenues specific to naphtha production and trading portfolios

Coverage of manufacturers and traders representing 75-80% of global market volume in 2024

Extrapolation using bottom-up (production volume × spot price by region) and top-down (refinery revenue validation) approaches to derive segment-specific valuations for chemicals, energy/fuel, and other application categories

Download Free Sample

Kindly complete the form below to receive a free sample of this Report

Download PDF ×

We do not share your information with anyone. However, we may send you emails based on your report interest from time to time. You may contact us at any time to opt-out.















