×
  • Cat-intel
  • MedIntelliX
  • Resources
  • About Us
  • Hero Background
    English
    Chinese
    French
    Japanese
    Korean
    German
    Spanish

    Netherlands Sustainable Chemicals Market Size

    ID: MRFR/CnM/11885-HCR
    128 Pages
    Anshula Mandaokar
    October 2025

    Netherlands Sustainable Chemicals Market Research Report Information Product (Bio-Alcohols, Bio-Organic Acids, Bio-Solvents, Bio-Polymers, and Others), By Application (Food & Beverages, Agricultural, Personal Care, Packaging, Automotive, and Others) –Market Forecast Till 2035

    Share:
    Download PDF ×

    We do not share your information with anyone. However, we may send you emails based on your report interest from time to time. You may contact us at any time to opt-out.

    Netherlands Sustainable Chemicals Market Infographic
    Purchase Options

    Netherlands Sustainable Chemicals Size

    Netherlands Sustainable Chemicals Market Growth Projections and Opportunities

    Numerous factors determine the dynamics and growth trajectory of the Netherlands Sustainable Chemicals Market. The global focus on sustainability and environmental friendliness drives this market. As climate change and environmental degradation worries rise, sustainable solutions are in demand, and the Netherlands is a leader. Sustainable chemical developments have thrived due to the Dutch government's green economy and carbon reduction efforts.

    The Netherlands Sustainable Chemicals Market is also shaped by strict regulations. Strong environmental rules in the country promote eco-friendly alternatives and prohibit chemical use. This regulatory environment maintains compliance and promotes sustainable chemical technology research. Companies in this market must follow certain standards, promoting responsible and sustainable business practices.

    Additionally, customer awareness and tastes greatly affect the industry. The Netherlands' well-informed and ecologically conscientious consumers actively seek products with low environmental impact. This understanding has changed customer tastes for sustainable products, prompting corporations to develop and market eco-friendly chemicals. This transition drives the market to offer sustainable alternatives in agriculture, manufacturing, and other areas.

    Sustainable chemical markets in the Netherlands are also shaped by investments and collaborations. The government and commercial sector engage in R&D to expedite sustainable chemical solution invention and adoption. Academic, scientific, and business collaborations boost sustainable chemical efforts to address environmental issues.

    Global market trends and economic considerations shape the Netherlands Sustainable Chemicals Market. International market dynamics, trade agreements, and economic conditions affect sustainable chemical demand and supply as the world becomes more sustainable. Being a worldwide chemical player, the Netherlands can capitalize on these trends by attracting foreign investments and creating global partnerships.

    Market challenges include early expenditures of adopting sustainable practices. While the long-term benefits are clear, corporations may confront greater manufacturing costs and large capital investments. Strategic thinking, innovative technologies, and government and financial institution cooperation are needed to overcome these obstacles.
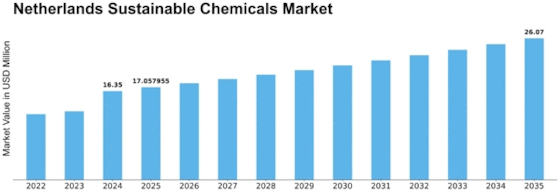
    Netherlands Sustainable Chemicals Market Size Graph
    Author
    Anshula Mandaokar
    Team Lead - Research

    Anshula Mandaokar holds an academic degree in Chemical Engineering and has been contributing to the field for more than 5 years. She has expertise in Market Research and Business Consulting and serves as a Team Lead for a reputed Market Research firm under the Chemicals and Materials domain spectrum. She has worked on multiple projects, generating explicit results in a quick turnaround time. Her understanding of data interpretation justifies her role as a leader.

    Leave a Comment

    FAQs

    What is the current valuation of the Netherlands Sustainable Chemicals Market?

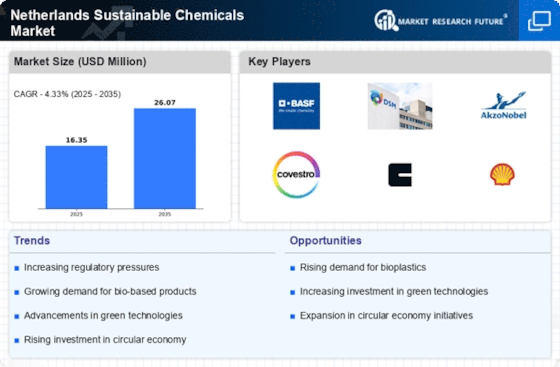
    The market valuation was 16.35 USD Million in 2024.

    What is the projected market size for the Netherlands Sustainable Chemicals Market by 2035?

    The market is projected to reach 26.07 USD Million by 2035.

    What is the expected CAGR for the Netherlands Sustainable Chemicals Market during the forecast period 2025 - 2035?

    The expected CAGR is 4.33% during the forecast period 2025 - 2035.

    Which companies are considered key players in the Netherlands Sustainable Chemicals Market?

    Key players include BASF, DSM, AkzoNobel, Covestro, Clariant, Shell, Evonik, Fibrant, and Lanxess.

    What are the main product segments in the Netherlands Sustainable Chemicals Market?

    Main product segments include Bio-Alcohols, Bio-Organic Acids, Bio-Solvents, Bio-Polymers, and Others.

    Market Summary

    As per MRFR analysis, the Netherlands Sustainable Chemicals Market Size was estimated at 16.35 USD Million in 2024. The sustainable chemicals industry is projected to grow from 17.06 in 2025 to 26.07 by 2035, exhibiting a compound annual growth rate (CAGR) of 4.33 during the forecast period 2025 - 2035.

    Key Market Trends & Highlights

    The Netherlands Sustainable Chemicals Market is experiencing a transformative shift towards sustainability and innovation.

    • The market is witnessing increased regulatory support, driving the adoption of sustainable practices.
    • There is a notable rise in biobased chemicals, particularly in the bio-alcohols segment, which remains the largest.
    • Consumer demand for sustainability is influencing product development in the food and beverages sector, the largest market segment.
    • Increased investment in sustainable technologies and government policies are key drivers propelling market growth.

    Market Size & Forecast

    2024 Market Size 16.35 (USD Million)
    2035 Market Size 26.07 (USD Million)
    CAGR (2025 - 2035) 4.33%
    Largest Regional Market Share in 2024 Europe

    Major Players

    <p>BASF (DE), DSM (NL), AkzoNobel (NL), Covestro (DE), Clariant (CH), Shell (GB), Evonik (DE), Fibrant (NL), Lanxess (DE)</p>

    Market Trends

    The Netherlands Sustainable Chemicals Market is currently experiencing a transformative phase, driven by increasing environmental awareness and regulatory pressures. Stakeholders across various sectors are actively seeking sustainable alternatives to traditional chemical products, which has led to a surge in innovation and investment in green technologies. This shift is not merely a trend but appears to be a fundamental change in how chemicals are produced and consumed. Companies are increasingly adopting circular economy principles, which emphasize resource efficiency and waste reduction, thereby aligning with broader sustainability goals. Moreover, the market landscape is characterized by collaboration among industry players, research institutions, and governmental bodies. This collaborative approach seems to foster the development of new materials and processes that minimize environmental impact. As consumers become more discerning, the demand for transparency in sourcing and production practices is likely to grow. Consequently, businesses that prioritize sustainability may find themselves better positioned to capture market share and enhance their reputations. The ongoing evolution of the Netherlands Sustainable Chemicals Market suggests a promising future, where sustainable practices are not only beneficial for the environment but also economically viable for businesses.

    Increased Regulatory Support

    The regulatory environment in the Netherlands is becoming increasingly supportive of sustainable practices. Government initiatives and policies are encouraging companies to adopt greener technologies and processes. This regulatory backing is likely to accelerate the transition towards sustainable chemicals, as firms seek compliance and competitive advantage.

    Rise of Biobased Chemicals

    There is a noticeable shift towards biobased chemicals, which are derived from renewable resources. This trend indicates a growing preference for materials that reduce reliance on fossil fuels. As research and development in this area progresses, biobased chemicals may become more prevalent in various applications.

    Consumer Demand for Sustainability

    Consumer preferences are evolving, with a marked increase in demand for sustainable products. This trend suggests that companies in the Netherlands Sustainable Chemicals Market must adapt to meet the expectations of environmentally conscious consumers. Businesses that prioritize sustainability in their offerings may enhance their market position.

    Netherlands Sustainable Chemicals Market Market Drivers

    International Trade Opportunities

    The Netherlands Sustainable Chemicals Market is poised to benefit from expanding international trade opportunities. As global demand for sustainable chemicals rises, the Netherlands is strategically positioned as a key player in the European market. In 2025, it is estimated that exports of sustainable chemicals from the Netherlands could increase by 25%, driven by favorable trade agreements and a strong reputation for quality. This growth in international trade not only enhances the visibility of Dutch sustainable products but also encourages local manufacturers to scale their operations. The ability to access new markets presents a significant opportunity for companies within the industry, potentially leading to increased revenues and market share. As the global landscape shifts towards sustainability, the Netherlands is likely to emerge as a hub for sustainable chemical exports.

    Government Policies and Incentives

    The Netherlands Sustainable Chemicals Market benefits significantly from robust government policies and incentives aimed at promoting sustainability. The Dutch government has implemented various initiatives, including tax breaks and grants for companies investing in sustainable practices. In 2025, it is estimated that these incentives could lead to a 20% increase in the adoption of sustainable chemicals among manufacturers. Such policies not only encourage existing companies to transition towards greener alternatives but also attract new entrants to the market. The regulatory framework is designed to support innovation while ensuring compliance with environmental standards. This proactive approach by the government is likely to create a conducive environment for the growth of the sustainable chemicals sector, fostering collaboration between public and private entities.

    Growing Awareness of Environmental Impact

    There is a notable increase in awareness regarding the environmental impact of chemical production within the Netherlands Sustainable Chemicals Market. Consumers and businesses alike are becoming more conscious of the ecological footprint associated with traditional chemical processes. This heightened awareness is driving demand for sustainable alternatives, as stakeholders seek to minimize their environmental impact. In 2025, it is projected that the market for sustainable chemicals could grow by 15% as consumers prioritize eco-friendly products. Companies are responding to this shift by reformulating their product lines to include sustainable options, thereby aligning with consumer preferences. This trend not only enhances brand loyalty but also positions companies favorably in a competitive market increasingly focused on sustainability.

    Increased Investment in Sustainable Technologies

    The Netherlands Sustainable Chemicals Market is witnessing a surge in investments directed towards sustainable technologies. This trend is largely driven by both public and private sectors recognizing the need for environmentally friendly alternatives. In 2025, investments in sustainable chemical production technologies are projected to reach approximately 1.5 billion euros, reflecting a growing commitment to sustainability. Companies are increasingly allocating resources to research and development, aiming to innovate and enhance the efficiency of sustainable chemical processes. This influx of capital not only fosters innovation but also positions the Netherlands as a leader in sustainable chemical production, potentially attracting further investments and partnerships. As a result, the industry is likely to experience accelerated growth, driven by advancements in technology and a collective push towards sustainability.

    Technological Advancements in Chemical Production

    Technological advancements play a crucial role in shaping the Netherlands Sustainable Chemicals Market. Innovations in production processes, such as the development of biocatalysis and green chemistry techniques, are enabling manufacturers to produce chemicals with reduced environmental impact. In 2025, it is anticipated that these advancements could lead to a 30% increase in the efficiency of sustainable chemical production. Companies are investing in cutting-edge technologies that not only enhance productivity but also lower energy consumption and waste generation. This shift towards more efficient production methods is likely to attract further investment and drive the growth of the sustainable chemicals sector. As technology continues to evolve, the industry is expected to adapt, fostering a culture of continuous improvement and sustainability.

    Market Segment Insights

    By Product: Bio-Alcohols (Largest) vs. Bio-Polymers (Fastest-Growing)

    <p>In the Netherlands Sustainable Chemicals Market, the product segment showcases a dynamic distribution among its constituents. Bio-Alcohols hold the largest market share, cementing their position as a staple in the sustainable chemicals landscape. Following closely are Bio-Organic Acids and Bio-Solvents, which also represent significant portions of the market. Together, these segments illustrate a robust transformation towards more sustainable chemical alternatives, gaining traction in various industrial applications.</p>

    <p>Bio-Alcohols (Dominant) vs. Bio-Polymers (Emerging)</p>

    <p>Bio-Alcohols emerge as the dominant force in the Netherlands Sustainable Chemicals Market, finding extensive applications in fuels, solvents, and chemical intermediates. Their favorable properties, combined with increasing regulatory support for renewable energy sources, bolster their market presence. In contrast, Bio-Polymers are identified as an emerging segment, rapidly gaining attention due to their biodegradable nature and compatibility with existing production processes. As industries seek more sustainable materials, Bio-Polymers are experiencing accelerated growth, driven by consumer demand for eco-friendly products and innovations in production technologies.</p>

    By Application: Food & Beverages (Largest) vs. Personal Care (Fastest-Growing)

    <p>In the Netherlands Sustainable Chemicals Market, the application segment is dominated by Food & Beverages, which holds a significant market share due to the increased consumer demand for sustainable products in this sector. Following closely are Agricultural and Packaging applications that are also pivotal in contributing to market dynamics. Personal Care, while smaller in market share compared to Food & Beverages, is gaining traction as consumers increasingly prioritize eco-friendly ingredients in their personal care products.</p>

    <p>Food & Beverages (Dominant) vs. Personal Care (Emerging)</p>

    <p>The Food & Beverages application is characterized by its extensive use of sustainable chemicals in food processing, preservation, and packaging, reflecting the sector's adaptation to consumer preferences for organic and environmentally friendly alternatives. On the other hand, the Personal Care segment is emerging rapidly as manufacturers respond to the rising demand for natural and sustainable ingredients in cosmetics and personal hygiene products. This segment is driven by consumers' growing awareness of chemical safety and environmental impacts, prompting brands to innovate and create more eco-conscious product lines.</p>

    Get more detailed insights about Netherlands Sustainable Chemicals Market Research Report - Forecast by 2035

    Regional Insights

    North America : Innovation and Sustainability Leader

    North America is witnessing a robust growth in the sustainable chemicals market, driven by increasing environmental regulations and consumer demand for eco-friendly products. The U.S. holds the largest market share at approximately 60%, followed by Canada at around 25%. Regulatory frameworks such as the Green Chemistry Initiative are catalyzing innovation and investment in sustainable practices. Leading countries in this region include the United States and Canada, with major players like BASF and Covestro actively investing in sustainable technologies. The competitive landscape is characterized by a mix of established chemical giants and innovative startups focusing on bio-based and recycled materials. This dynamic environment fosters collaboration and accelerates the transition towards a circular economy.

    Europe : Sustainability and Innovation Hub

    Europe is at the forefront of the sustainable chemicals market, driven by stringent regulations and a strong commitment to sustainability. The Netherlands, as a key player, holds approximately 30% of the market share, followed closely by Germany at 25%. The European Green Deal and REACH regulations are pivotal in shaping market dynamics, promoting sustainable practices across the industry. Leading countries include the Netherlands, Germany, and France, with key players such as DSM and AkzoNobel leading the charge in innovation. The competitive landscape is marked by significant investments in R&D and partnerships aimed at developing sustainable solutions. The presence of numerous startups further enhances the region's capacity for innovation, making Europe a global leader in sustainable chemicals.

    Asia-Pacific : Emerging Market Potential

    The Asia-Pacific region is rapidly emerging as a significant player in the sustainable chemicals market, driven by increasing industrialization and environmental awareness. China leads the market with a share of approximately 40%, followed by Japan at around 20%. Government initiatives aimed at reducing carbon emissions and promoting green technologies are key growth drivers in this region. Countries like China, Japan, and India are witnessing a surge in demand for sustainable chemicals, with major companies such as Shell and Lanxess investing heavily in this sector. The competitive landscape is evolving, with both multinational corporations and local firms striving to innovate and meet the growing demand for eco-friendly products. This dynamic environment is expected to foster significant growth in the coming years.

    Middle East and Africa : Resource-Rich Frontier

    The Middle East and Africa region is gradually developing its sustainable chemicals market, driven by a growing awareness of environmental issues and the need for diversification from traditional oil-based products. The UAE and South Africa are the leading markets, holding approximately 30% and 20% of the market share, respectively. Government initiatives aimed at promoting sustainability are beginning to take shape, although the market is still in its nascent stages. Key players in this region include local firms and international companies looking to expand their footprint. The competitive landscape is characterized by a mix of established oil companies and emerging startups focused on sustainable solutions. As regulatory frameworks evolve, the potential for growth in sustainable chemicals is significant, paving the way for a more sustainable future in the region.

    Key Players and Competitive Insights

    Leading market participants are investing heavily in research and development to enhance their product lines, which will help the sustainable chemicals market expand even more. Market participants are also undertaking different strategic activities to extend their footprint, with significant market developments including new product establishment, mergers and acquisitions, contractual agreements, and collaboration with other organizations. The sustainable chemicals industry must deliver cost-effective items to extend and stay in a more competitive and growing market climate.

    Major players in the sustainable chemicals market are attempting to expand market demand by investing in research and development operations, including Cargill Inc., BASF SE, Bio-Kleen Products Inc., Balfour Beatty PLC, DuPont Industrial, Biosciences, Dryvit Systems Inc., Anderson Corporation, Palmer Industries Inc., Plycem USA Inc., Silver Line Building Products LLC, Thermafiber Inc., Huber Engineered Woods LLC, Bayer Material Science AG, Kingspan Group, USG Corporation, and Koninklijke DSM NV.

    Key Companies in the Netherlands Sustainable Chemicals Market market include

    Industry Developments

    December 2021: Nobian and Macquarie's Green Investment Group are concatenating forces to form a maximum industrial green hydrogen player, the Hydrogen Chemistry Company (HyCC). HyCC will deliver safe, dependable, and affordable green hydrogen solutions to assist in decarbonizing large industries such as aviation, steel, chemicals, and refineries.

    Future Outlook

    Netherlands Sustainable Chemicals Market Future Outlook

    <p>The Netherlands Sustainable Chemicals Market is projected to grow at a 4.33% CAGR from 2024 to 2035, driven by regulatory support, technological advancements, and increasing demand for eco-friendly products.</p>

    New opportunities lie in:

    • <p>Development of biobased feedstock supply chains</p>
    • <p>Investment in carbon capture and utilization technologies</p>
    • <p>Expansion of green chemistry educational programs for workforce development</p>

    <p>By 2035, the market is expected to be robust, driven by innovation and sustainability initiatives.</p>

    Market Segmentation

    Netherlands Sustainable Chemicals Market Product Outlook

    • Bio-Alcohols
    • Bio-Organic Acids
    • Bio-Solvents
    • Bio-Polymers
    • Others

    Netherlands Sustainable Chemicals Market Application Outlook

    • Food & Beverages
    • Agricultural
    • Personal Care
    • Packaging
    • Automotive
    • Others

    Report Scope

    MARKET SIZE 202416.35(USD Million)
    MARKET SIZE 202517.06(USD Million)
    MARKET SIZE 203526.07(USD Million)
    COMPOUND ANNUAL GROWTH RATE (CAGR)4.33% (2024 - 2035)
    REPORT COVERAGERevenue Forecast, Competitive Landscape, Growth Factors, and Trends
    BASE YEAR2024
    Market Forecast Period2025 - 2035
    Historical Data2019 - 2024
    Market Forecast UnitsUSD Million
    Key Companies ProfiledMarket analysis in progress
    Segments CoveredMarket segmentation analysis in progress
    Key Market OpportunitiesGrowing demand for bio-based chemicals driven by regulatory support and consumer sustainability preferences in the Netherlands Sustainable Chemicals Market.
    Key Market DynamicsRising regulatory pressures drive innovation and investment in sustainable chemical solutions within the Netherlands.
    Countries CoveredNorth America, Europe, APAC, South America, MEA

    FAQs

    What is the current valuation of the Netherlands Sustainable Chemicals Market?

    The market valuation was 16.35 USD Million in 2024.

    What is the projected market size for the Netherlands Sustainable Chemicals Market by 2035?

    The market is projected to reach 26.07 USD Million by 2035.

    What is the expected CAGR for the Netherlands Sustainable Chemicals Market during the forecast period 2025 - 2035?

    The expected CAGR is 4.33% during the forecast period 2025 - 2035.

    Which companies are considered key players in the Netherlands Sustainable Chemicals Market?

    Key players include BASF, DSM, AkzoNobel, Covestro, Clariant, Shell, Evonik, Fibrant, and Lanxess.

    What are the main product segments in the Netherlands Sustainable Chemicals Market?

    Main product segments include Bio-Alcohols, Bio-Organic Acids, Bio-Solvents, Bio-Polymers, and Others.

    1. SECTION I: EXECUTIVE SUMMARY AND KEY HIGHLIGHTS
      1. EXECUTIVE SUMMARY
        1. Market Overview
        2. Key Findings
        3. Market Segmentation
        4. Competitive Landscape
        5. Challenges and Opportunities
        6. Future Outlook
    2. SECTION II: SCOPING, METHODOLOGY AND MARKET STRUCTURE
      1. MARKET INTRODUCTION
        1. Definition
        2. Scope of the study
      2. RESEARCH METHODOLOGY
        1. Overview
        2. Data Mining
        3. Secondary Research
        4. Primary Research
        5. Forecasting Model
        6. Market Size Estimation
        7. Data Triangulation
        8. Validation
    3. SECTION III: QUALITATIVE ANALYSIS
      1. MARKET DYNAMICS
        1. Overview
        2. Drivers
        3. Restraints
        4. Opportunities
      2. MARKET FACTOR ANALYSIS
        1. Value chain Analysis
        2. Porter's Five Forces Analysis
        3. COVID-19 Impact Analysis
    4. SECTION IV: QUANTITATIVE ANALYSIS
      1. Chemicals and Materials, BY Product (USD Million)
        1. Bio-Alcohols
        2. Bio-Organic Acids
        3. Bio-Solvents
        4. Bio-Polymers
        5. Others
      2. Chemicals and Materials, BY Application (USD Million)
        1. Food & Beverages
        2. Agricultural
        3. Personal Care
        4. Packaging
        5. Automotive
        6. Others
      3. Chemicals and Materials, BY Region (USD Million)
        1. North America
        2. Europe
        3. APAC
        4. South America
        5. MEA
    5. SECTION V: COMPETITIVE ANALYSIS
      1. Competitive Landscape
        1. Overview
        2. Competitive Analysis
        3. Market share Analysis
        4. Major Growth Strategy in the Chemicals and Materials
        5. Competitive Benchmarking
        6. Leading Players in Terms of Number of Developments in the Chemicals and Materials
        7. Key developments and growth strategies
        8. Major Players Financial Matrix
      2. Company Profiles
        1. BASF (DE)
        2. DSM (NL)
        3. AkzoNobel (NL)
        4. Covestro (DE)
        5. Clariant (CH)
        6. Shell (GB)
        7. Evonik (DE)
        8. Fibrant (NL)
        9. Lanxess (DE)
      3. Appendix
        1. References
        2. Related Reports
    6. LIST OF FIGURES
      1. MARKET SYNOPSIS
      2. NORTH AMERICA MARKET ANALYSIS
      3. US MARKET ANALYSIS BY PRODUCT
      4. US MARKET ANALYSIS BY APPLICATION
      5. CANADA MARKET ANALYSIS BY PRODUCT
      6. CANADA MARKET ANALYSIS BY APPLICATION
      7. EUROPE MARKET ANALYSIS
      8. GERMANY MARKET ANALYSIS BY PRODUCT
      9. GERMANY MARKET ANALYSIS BY APPLICATION
      10. UK MARKET ANALYSIS BY PRODUCT
      11. UK MARKET ANALYSIS BY APPLICATION
      12. FRANCE MARKET ANALYSIS BY PRODUCT
      13. FRANCE MARKET ANALYSIS BY APPLICATION
      14. RUSSIA MARKET ANALYSIS BY PRODUCT
      15. RUSSIA MARKET ANALYSIS BY APPLICATION
      16. ITALY MARKET ANALYSIS BY PRODUCT
      17. ITALY MARKET ANALYSIS BY APPLICATION
      18. SPAIN MARKET ANALYSIS BY PRODUCT
      19. SPAIN MARKET ANALYSIS BY APPLICATION
      20. REST OF EUROPE MARKET ANALYSIS BY PRODUCT
      21. REST OF EUROPE MARKET ANALYSIS BY APPLICATION
      22. APAC MARKET ANALYSIS
      23. CHINA MARKET ANALYSIS BY PRODUCT
      24. CHINA MARKET ANALYSIS BY APPLICATION
      25. INDIA MARKET ANALYSIS BY PRODUCT
      26. INDIA MARKET ANALYSIS BY APPLICATION
      27. JAPAN MARKET ANALYSIS BY PRODUCT
      28. JAPAN MARKET ANALYSIS BY APPLICATION
      29. SOUTH KOREA MARKET ANALYSIS BY PRODUCT
      30. SOUTH KOREA MARKET ANALYSIS BY APPLICATION
      31. MALAYSIA MARKET ANALYSIS BY PRODUCT
      32. MALAYSIA MARKET ANALYSIS BY APPLICATION
      33. THAILAND MARKET ANALYSIS BY PRODUCT
      34. THAILAND MARKET ANALYSIS BY APPLICATION
      35. INDONESIA MARKET ANALYSIS BY PRODUCT
      36. INDONESIA MARKET ANALYSIS BY APPLICATION
      37. REST OF APAC MARKET ANALYSIS BY PRODUCT
      38. REST OF APAC MARKET ANALYSIS BY APPLICATION
      39. SOUTH AMERICA MARKET ANALYSIS
      40. BRAZIL MARKET ANALYSIS BY PRODUCT
      41. BRAZIL MARKET ANALYSIS BY APPLICATION
      42. MEXICO MARKET ANALYSIS BY PRODUCT
      43. MEXICO MARKET ANALYSIS BY APPLICATION
      44. ARGENTINA MARKET ANALYSIS BY PRODUCT
      45. ARGENTINA MARKET ANALYSIS BY APPLICATION
      46. REST OF SOUTH AMERICA MARKET ANALYSIS BY PRODUCT
      47. REST OF SOUTH AMERICA MARKET ANALYSIS BY APPLICATION
      48. MEA MARKET ANALYSIS
      49. GCC COUNTRIES MARKET ANALYSIS BY PRODUCT
      50. GCC COUNTRIES MARKET ANALYSIS BY APPLICATION
      51. SOUTH AFRICA MARKET ANALYSIS BY PRODUCT
      52. SOUTH AFRICA MARKET ANALYSIS BY APPLICATION
      53. REST OF MEA MARKET ANALYSIS BY PRODUCT
      54. REST OF MEA MARKET ANALYSIS BY APPLICATION
      55. KEY BUYING CRITERIA OF CHEMICALS AND MATERIALS
      56. RESEARCH PROCESS OF MRFR
      57. DRO ANALYSIS OF CHEMICALS AND MATERIALS
      58. DRIVERS IMPACT ANALYSIS: CHEMICALS AND MATERIALS
      59. RESTRAINTS IMPACT ANALYSIS: CHEMICALS AND MATERIALS
      60. SUPPLY / VALUE CHAIN: CHEMICALS AND MATERIALS
      61. CHEMICALS AND MATERIALS, BY PRODUCT, 2024 (% SHARE)
      62. CHEMICALS AND MATERIALS, BY PRODUCT, 2024 TO 2035 (USD Million)
      63. CHEMICALS AND MATERIALS, BY APPLICATION, 2024 (% SHARE)
      64. CHEMICALS AND MATERIALS, BY APPLICATION, 2024 TO 2035 (USD Million)
      65. BENCHMARKING OF MAJOR COMPETITORS
    7. LIST OF TABLES
      1. LIST OF ASSUMPTIONS
      2. 7.1.1
      3. North America MARKET SIZE ESTIMATES; FORECAST
        1. BY PRODUCT, 2025-2035 (USD Million)
        2. BY APPLICATION, 2025-2035 (USD Million)
      4. US MARKET SIZE ESTIMATES; FORECAST
        1. BY PRODUCT, 2025-2035 (USD Million)
        2. BY APPLICATION, 2025-2035 (USD Million)
      5. Canada MARKET SIZE ESTIMATES; FORECAST
        1. BY PRODUCT, 2025-2035 (USD Million)
        2. BY APPLICATION, 2025-2035 (USD Million)
      6. Europe MARKET SIZE ESTIMATES; FORECAST
        1. BY PRODUCT, 2025-2035 (USD Million)
        2. BY APPLICATION, 2025-2035 (USD Million)
      7. Germany MARKET SIZE ESTIMATES; FORECAST
        1. BY PRODUCT, 2025-2035 (USD Million)
        2. BY APPLICATION, 2025-2035 (USD Million)
      8. UK MARKET SIZE ESTIMATES; FORECAST
        1. BY PRODUCT, 2025-2035 (USD Million)
        2. BY APPLICATION, 2025-2035 (USD Million)
      9. France MARKET SIZE ESTIMATES; FORECAST
        1. BY PRODUCT, 2025-2035 (USD Million)
        2. BY APPLICATION, 2025-2035 (USD Million)
      10. Russia MARKET SIZE ESTIMATES; FORECAST
        1. BY PRODUCT, 2025-2035 (USD Million)
        2. BY APPLICATION, 2025-2035 (USD Million)
      11. Italy MARKET SIZE ESTIMATES; FORECAST
        1. BY PRODUCT, 2025-2035 (USD Million)
        2. BY APPLICATION, 2025-2035 (USD Million)
      12. Spain MARKET SIZE ESTIMATES; FORECAST
        1. BY PRODUCT, 2025-2035 (USD Million)
        2. BY APPLICATION, 2025-2035 (USD Million)
      13. Rest of Europe MARKET SIZE ESTIMATES; FORECAST
        1. BY PRODUCT, 2025-2035 (USD Million)
        2. BY APPLICATION, 2025-2035 (USD Million)
      14. APAC MARKET SIZE ESTIMATES; FORECAST
        1. BY PRODUCT, 2025-2035 (USD Million)
        2. BY APPLICATION, 2025-2035 (USD Million)
      15. China MARKET SIZE ESTIMATES; FORECAST
        1. BY PRODUCT, 2025-2035 (USD Million)
        2. BY APPLICATION, 2025-2035 (USD Million)
      16. India MARKET SIZE ESTIMATES; FORECAST
        1. BY PRODUCT, 2025-2035 (USD Million)
        2. BY APPLICATION, 2025-2035 (USD Million)
      17. Japan MARKET SIZE ESTIMATES; FORECAST
        1. BY PRODUCT, 2025-2035 (USD Million)
        2. BY APPLICATION, 2025-2035 (USD Million)
      18. South Korea MARKET SIZE ESTIMATES; FORECAST
        1. BY PRODUCT, 2025-2035 (USD Million)
        2. BY APPLICATION, 2025-2035 (USD Million)
      19. Malaysia MARKET SIZE ESTIMATES; FORECAST
        1. BY PRODUCT, 2025-2035 (USD Million)
        2. BY APPLICATION, 2025-2035 (USD Million)
      20. Thailand MARKET SIZE ESTIMATES; FORECAST
        1. BY PRODUCT, 2025-2035 (USD Million)
        2. BY APPLICATION, 2025-2035 (USD Million)
      21. Indonesia MARKET SIZE ESTIMATES; FORECAST
        1. BY PRODUCT, 2025-2035 (USD Million)
        2. BY APPLICATION, 2025-2035 (USD Million)
      22. Rest of APAC MARKET SIZE ESTIMATES; FORECAST
        1. BY PRODUCT, 2025-2035 (USD Million)
        2. BY APPLICATION, 2025-2035 (USD Million)
      23. South America MARKET SIZE ESTIMATES; FORECAST
        1. BY PRODUCT, 2025-2035 (USD Million)
        2. BY APPLICATION, 2025-2035 (USD Million)
      24. Brazil MARKET SIZE ESTIMATES; FORECAST
        1. BY PRODUCT, 2025-2035 (USD Million)
        2. BY APPLICATION, 2025-2035 (USD Million)
      25. Mexico MARKET SIZE ESTIMATES; FORECAST
        1. BY PRODUCT, 2025-2035 (USD Million)
        2. BY APPLICATION, 2025-2035 (USD Million)
      26. Argentina MARKET SIZE ESTIMATES; FORECAST
        1. BY PRODUCT, 2025-2035 (USD Million)
        2. BY APPLICATION, 2025-2035 (USD Million)
      27. Rest of South America MARKET SIZE ESTIMATES; FORECAST
        1. BY PRODUCT, 2025-2035 (USD Million)
        2. BY APPLICATION, 2025-2035 (USD Million)
      28. MEA MARKET SIZE ESTIMATES; FORECAST
        1. BY PRODUCT, 2025-2035 (USD Million)
        2. BY APPLICATION, 2025-2035 (USD Million)
      29. GCC Countries MARKET SIZE ESTIMATES; FORECAST
        1. BY PRODUCT, 2025-2035 (USD Million)
        2. BY APPLICATION, 2025-2035 (USD Million)
      30. South Africa MARKET SIZE ESTIMATES; FORECAST
        1. BY PRODUCT, 2025-2035 (USD Million)
        2. BY APPLICATION, 2025-2035 (USD Million)
      31. Rest of MEA MARKET SIZE ESTIMATES; FORECAST
        1. BY PRODUCT, 2025-2035 (USD Million)
        2. BY APPLICATION, 2025-2035 (USD Million)
      32. PRODUCT LAUNCH/PRODUCT DEVELOPMENT/APPROVAL
      33. 7.31.1
      34. ACQUISITION/PARTNERSHIP
      35. 7.32.1

    Netherlands Sustainable Chemicals Market Segmentation

    Market Segmentation Overview

    • Detailed segmentation data will be available in the full report
    • Comprehensive analysis by multiple parameters
    • Regional and country-level breakdowns
    • Market size forecasts by segment
    Infographic

    Free Sample Request

    Kindly complete the form below to receive a free sample of this Report

    Get Free Sample

    Customer Strories

    “I am very pleased with how market segments have been defined in a relevant way for my purposes (such as "Portable Freezers & refrigerators" and "last-mile"). In general the report is well structured. Thanks very much for your efforts.”

    Victoria Milne

    Founder

    Compare Licence

    ×
    Features License Type
    Single User Multiuser License Enterprise User
    Price $4,950 $5,950 $7,250
    Maximum User Access Limit 1 User Upto 10 Users Unrestricted Access Throughout the Organization
    Free Customization
    Direct Access to Analyst
    Deliverable Format
    Platform Access
    Discount on Next Purchase 10% 15% 15%
    Printable Versions