Non-Dairy Cheese Market (2026 - 2035)

Non-Dairy Cheese Market Size, Share, Industry Trend & Analysis Research Report By Source (Cashew, Almond, Soy, Coconut, Oat, Other (Pea, Potato, Fermented)), By Product Type (Mozzarella-Style, Cheddar-Style, Cream Cheese-Style, Parmesan-Style, Specialty and Cultured), By Distribution Channel (Supermarkets and Hypermarkets, Specialty and Health Retail, Online Retail, Foodservice and HoReCa), By End User (Retail Household, Foodservice Operators, Food Processing and Industrial), By Region (North America, Europe, Asia-Pacific, South America, Middle East & Africa) - Forecast to 2035

Forecast Period
2026-2035
CAGR
11.8%
2025 Market Size
USD 3.20 Billion
2035 Market Size
USD 9.77 Billion
Food, Beverages & Nutrition ● Updated August 26, 2026 Report ID: MRFR/FnB/2241-HCR | Pages: 200 | Author: Snehal Singh

Non-Dairy Cheese Market Summary

The Non-Dairy Cheese Market closed 2025 at roughly USD 3.20 billion and opens the forecast window at USD 3.58 billion in 2026, climbing to USD 9.77 billion by 2035 at an 11.8% CAGR. Two catalysts anchor that trajectory. The European Union's Farm to Fork strategy, which commits EUR 10 billion under Horizon Europe to food-system research including alternative proteins, has pulled reformulation budgets forward [1]. In parallel, the U.S. Department of Agriculture's 2023 fortification guidance for plant-based dairy analogues gave retailers a clearer nutrition framework to merchandise against [2].

The genuine transformation is occurring in the field of formulation science. Coconut oil and starch were the primary ingredients in the first-generation products, which were inexpensive, stable, and functionally inferior. Fermentation-assisted protein systems, cultured nut bases, and precision-fermented casein are replacing those recipes, which are now capable of delivering melt and stretch. Fermentation platforms accounted for nearly one-third of the USD 1.6 billion raised by global alternative-protein companies in 2024 [3]. The cost curve for the Non-Dairy Cheese Market is being rewritten by that capital.

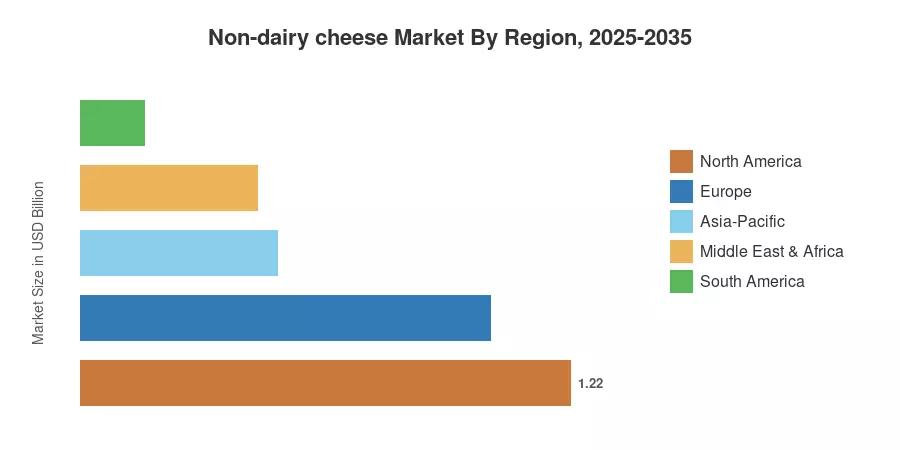
Constructed upon a mature private-label stratum and entrenched retail distribution, North America accounts for 38% of 2025 revenue as a region. Urban foodservice expansion and a high prevalence of lactose intolerance are the primary factors driving Asia-Pacific's rapid growth at a compound annual growth rate (CAGR) of 15.4% through 2035. Europe has the strictest labeling regime of any territory and holds a 32% market share. The next decade is reserved for the individual who successfully resolves taste at price points that are comparable to dairy.

Key Report Takeaways

• By Source

  • Cashew-based formats hold 26% of 2025 global revenue, the single largest source segment in the Non-Dairy Cheese Market.
  • Oat-based bases post the strongest source-level growth at a 16.2% CAGR through 2035
  • Soy-derived products generated USD 0.61 billion in 2025, concentrated in East Asia.

• By Product Type

  • Mozzarella-style analogues command 31% share, driven by pizza foodservice demand.
  • Cream-cheese-style spreads expand at a 12.9% CAGR, the fastest mainstream format.

• By Region

  • North America leads the Non-Dairy Cheese Market with 38% of 2025 revenue
  • Asia-Pacific records a 15.4% CAGR, the fastest of any region
  • Europe contributed USD 1.02 billion in 2025


Market Size and Forecast

Sizing for the Non-Dairy Cheese Market draws on retail scanner panels covering more than 40 markets, foodservice distributor shipment data, customs-level trade flows for nut and coconut inputs, and audited disclosures from twelve publicly listed participants. Foodservice volumes were triangulated against quick-service chain menu-item counts to correct for scanner blind spots.
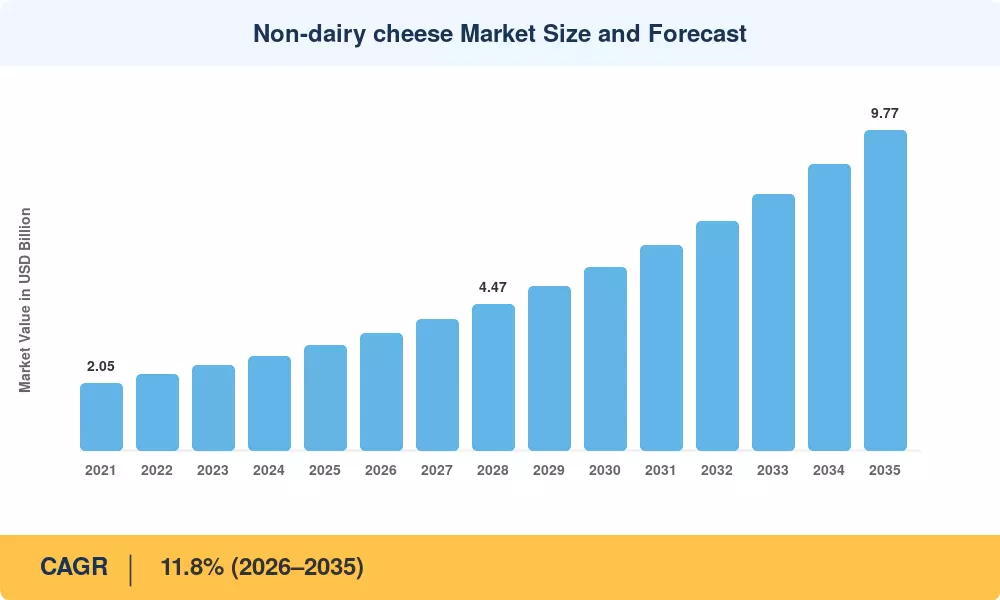
Non-dairy cheese Market Size and Forecast
Our Impact
Enabled $4.3B Revenue Impact for Fortune 500 and Leading Multinationals
Partnering with 2000+ Global Organizations Each Year
30K+ Citations by Top-Tier Firms in the Industry

Driver Impact Analysis

Driver ~% Impact on CAGR Geographic Relevance Impact Timeline
Retail assortment expansion and shelf-set upgrades +2.4 North America, Europe Short-term (≤2 yr)
Functional gains from fermentation-assisted proteins +2.1 Global Medium-term (2–4 yr)
Foodservice and pizza-chain adoption +1.9 NA, Europe, APAC Medium-term (2–4 yr)
Lactose intolerance prevalence and flexitarian diets +1.7 APAC, South America Long-term (≥4 yr)
Grocer carbon-footprint and ESG procurement targets +1.2 Europe Long-term (≥4 yr)
Price-parity progress from scaled input supply +1.0 Global Medium-term (2–4 yr)
Private-label entry at accessible price tiers +0.9 Europe, North America Short-term (≤2 yr)


Retail Assortment Expansion

Shelf space decides this category. Major grocers in North America and Western Europe lifted average non-dairy chilled assortment by 28% between 2022 and 2025, with several chains converting endcap space from specialty aisles into mainline dairy fixtures [7]. Placement adjacency matters more than promotion depth — products moved into the dairy cabinet turn roughly 2.3 times faster than the same SKU merchandised in a natural-foods set. That single merchandising change explains a meaningful slice of recent growth in the Non-Dairy Cheese Market.

Fermentation-Assisted Functionality

Melt has been the category's structural weakness for two decades. Precision fermentation now produces animal-identical casein at pilot scale, and the U.S. Food and Drug Administration issued a favourable no-questions letter for a fermentation-derived dairy protein in 2024, clearing a regulatory path [12]. Companies deploying these proteins report stretch and browning performance within 10–15% of conventional mozzarella, a threshold pizza operators have long cited as their buying trigger [8].

Foodservice Adoption

Restaurants convert trial into habit. Roughly 41% of the top 250 U.S. restaurant chains carried at least one non-dairy cheese application by mid-2025, up from 24% in 2022 [8]. Pizza is the beachhead — a single national chain adding a vegan option can move several thousand tonnes annually. European operators have moved faster still, aided by supplier contracts that lock ingredient pricing across 24-month horizons.

Health and Dietary Shifts

Roughly 65% of the global adult population shows some degree of reduced lactose digestion after infancy, with prevalence exceeding 85% across East Asia [9]. That biological baseline, combined with flexitarian purchasing among households that still buy conventional dairy, sustains demand independent of ethical motivation. Growth in lactose-free cheese products across pharmacy and modern-trade channels in Asia illustrates how medical framing outperforms lifestyle framing in these territories.


Restraints Impact Analysis

Restraint weightings follow the same directional methodology used for drivers. They represent estimated drag on the compound growth rate of the Non-Dairy Cheese Market and are not additive.

Restraint ~% Impact on CAGR Geographic Relevance Impact Timeline
Persistent taste and texture gap versus dairy −2.2 Global Medium-term (2–4 yr)
Price premium of 40–90% over conventional cheese −1.8 Global Short-term (≤2 yr)
Ultra-processed food scrutiny and clean-label pressure −1.4 Europe, North America Long-term (≥4 yr)
Dairy denomination and labelling restrictions −1.1 European Union Medium-term (2–4 yr)
Protein and calcium deficits requiring fortification −0.8 Global Long-term (≥4 yr)


The Price Premium

Shoppers repeat-purchase on value, not virtue. Average retail pricing sits 40–90% above comparable dairy cheese depending on format and territory, with cashew-based blocks carrying the widest gap [11]. Repeat-purchase rates fall sharply once the premium clears 55%. Input economics explain much of it — cashew kernel prices moved within a USD 6,800–8,400 per tonne band during 2024, and no producer has yet achieved the throughput scale that would compress conversion costs meaningfully.

Clean-Label Scrutiny

Ingredient decks are getting read. Products relying on modified starches, methylcellulose and refined coconut oil score poorly on NOVA-style classification systems now embedded in several European national dietary guidelines [13]. A 2024 consumer study across five European markets found 46% of lapsed buyers cited ingredient-list length as a reason for abandoning the category. Reformulation toward shorter decks costs margin, and smaller brands rarely have the R&D budget to absorb it.

Labelling Constraints

Naming rules bite hardest in Europe. Court of Justice precedent and subsequent national enforcement bar dairy denominations for plant-derived products, forcing descriptors such as "alternative to" or invented brand terminology [14]. That raises shopper search cost and dilutes the shelf communication that drives impulse trial — a measurable handicap in territories where the category is still building awareness.


Non-Dairy Cheese Market Opportunities

Foodservice Contract Manufacturing

Chain operators want private-brand supply, not branded product. Building dedicated foodservice lines with bulk shred and IQF formats opens volumes that retail cannot match, at lower marketing intensity. Suppliers entering this channel in the Non-Dairy Cheese Market typically trade five to eight points of gross margin for two to three times the volume commitment [8].

Precision Fermentation Licensing

Rather than build fermentation capacity, incumbents can license casein and whey analogue proteins from platform developers. This converts a capital problem into an ingredient procurement problem and shortens time to shelf by an estimated 18–24 months [12].

Emerging-Market Format Localisation

Paneer, halloumi and queso fresco analogues remain almost unaddressed. India, Brazil and the Gulf states together represent a shelf-space opportunity that Western format libraries do not serve. Localised production near cashew and coconut supply — Vietnam, India, Côte d'Ivoire — cuts landed cost materially [15].

Data-Led Category Management

Brands that supply retailers with basket-level analytics on incrementality earn shelf space that advertising cannot buy. Selling category-captain insight is a genuine business model, and several participants in the Non-Dairy Cheese Market now monetise loyalty-linked panels as a service to grocery partners [7].

Industrial Ingredient Supply

Frozen pizza, ready meals and bakery manufacturers need heat-stable analogues in bulk. This B2B channel carries longer contracts, lower promotional cost and stickier volumes than retail.


Non-Dairy Cheese Market Future Outlook

Functional Parity by 2030

Melt, stretch and browning converge on dairy benchmarks within the next five years as fermentation-derived proteins reach commercial volume. Once parity lands, the Non-Dairy Cheese Market stops competing on ethics and starts competing on price and flavour — a fundamentally larger addressable base [12].

Supply Chain Vertical Integration

Expect acquisitions of nut processing and fermentation capacity. Ingredient cost represents 48–56% of COGS in this category, far above branded packaged food norms, which makes upstream control the clearest margin lever available [11].

Sustainability Disclosure Becomes Procurement Criteria

The EU Corporate Sustainability Reporting Directive brings roughly 50,000 companies into scope, including most large grocery retailers [10]. Dairy production accounts for approximately 2.7% of global anthropogenic greenhouse gas emissions per FAO estimates, giving analogue suppliers a quantifiable Scope 3 argument in tenders [16].

Consolidation and Category Rationalisation

Weak brands exit. Top-five concentration in the Non-Dairy Cheese Market rises through the forecast period as retailers cut duplicative SKUs and multinationals absorb the strongest independents, echoing the plant-milk category's consolidation arc a decade earlier.


Non-Dairy Cheese Market Segmentation

By Source

Segment Metric (2025) Primary Demand Driver
Cashew 26% share Superior texture and cultured flavour
Almond 11.4% CAGR Established North American supply
Soy USD 0.61 Billion East Asian protein familiarity
Coconut 19% share Cost efficiency and melt behaviour
Oat 16.2% CAGR Allergen profile and clean label
Other (pea, potato, fermented) 7% share Protein fortification requirements


Cashew leads the Non-Dairy Cheese Market on source share because it cultures well — fermentation with dairy-style starter cultures produces genuine tang and a fat structure closest to conventional cheese. The trade-off is cost and allergen exposure. Oat grows fastest for the mirror-image reason: it is nut-free, inexpensive and carries clean-label credentials, though it demands more formulation work to deliver body without gumminess.

By Product Type

Segment Metric (2025) Primary Demand Driver
Mozzarella-style 31% share Pizza foodservice and frozen meals
Cheddar-style USD 0.74 Billion Slices, burgers, sandwich occasions
Cream cheese-style 12.9% CAGR Bagel, bakery and spread occasions
Parmesan-style 9% share Shaker formats and pasta pairing
Specialty and cultured 13.6% CAGR Premium retail and cheeseboards


Mozzarella-style analogues dominate the Non-Dairy Cheese Market for a mechanical reason: pizza hides imperfection. Melted, seasoned and combined with sauce, functional shortfalls that would be obvious in a sliced format become invisible. Cream-cheese formats grow fastest because they never needed to melt at all — texture parity was achievable with existing technology, so consumer disappointment rates stayed low from the outset.

By Distribution Channel

Segment Metric (2025) Primary Demand Driver
Supermarkets and hypermarkets 52% share Dairy-cabinet adjacency
Specialty and health retail USD 0.42 Billion Early-adopter loyalty
Online retail 15.7% CAGR Subscription and bulk formats
Foodservice and HoReCa 17% share Chain menu inclusion


Supermarkets and hypermarkets dominate the distribution landscape, capturing a 52% market share driven primarily by dairy-cabinet adjacency. Meanwhile, online retail emerges as the fastest-growing segment, expanding at a 15.7% CAGR fueled by subscription and bulk formats. Specialty retail accounts for USD 0.42 billion, and foodservice holds a 17% share through menu inclusions.

By End User

Segment Metric (2025) Primary Demand Driver
Retail household 63% share Everyday meal replacement
Foodservice operators 14.1% CAGR Menu diversification mandates
Food processing and industrial USD 0.29 Billion Frozen meals and bakery inclusion


Retail household is the dominating end-user segment, commanding a 63% market share driven by everyday meal replacements. Foodservice operators represent the fastest-growing segment, advancing at a 14.1% CAGR via menu diversification mandates. Additionally, the food processing and industrial segment accounts for USD 0.29 billion through frozen meal and bakery applications.


Regional Market Share Analysis

Regional structure in the Non-Dairy Cheese Market reflects three distinct maturity stages: consolidated in North America, regulated in Europe, and formative across Asia-Pacific.

Region Metric (2025) Primary Investment Themes
North America 38% share Private label, foodservice conversion
Europe USD 1.02 Billion Clean-label reformulation, ESG sourcing
Asia-Pacific 15.4% CAGR Localised formats, modern-trade rollout
South America 5% share Coconut-base production, urban retail
Middle East & Africa 13.9% CAGR Halal certification, hospitality supply
Total USD 3.20 Billion


North America

Country Metric Key Driver
United States 84% of region Mainline dairy-cabinet placement
Canada 11.2% CAGR Retail sustainability commitments
Mexico USD 0.07 Billion Urban foodservice expansion


The United States anchors the Non-Dairy Cheese Market through distribution depth rather than novelty. Federal fortification guidance for plant-based dairy analogues clarified nutrient-content expectations, allowing national brands to make comparative calcium and protein claims that previously drew challenge [2]. Canadian growth leans on retailer-set emissions targets that favour lower-footprint proteins.

Europe

Country Metric Key Driver
Germany 22% of region Discounter private label
United Kingdom 11.5% CAGR Foodservice and meal-deal inclusion
France USD 0.14 Billion Specialty artisanal positioning
Netherlands 9% of region Ingredient innovation clusters
Rest of Europe 13.2% CAGR Nordic and Iberian expansion


Germany's discounters did what brands could not: they made the category affordable. Own-label lines priced within 20% of dairy equivalents drove trial at a scale premium brands never reached. The EU's Farm to Fork commitments and national protein-transition strategies in the Netherlands and Denmark continue to channel public funding toward fermentation and legume processing [1] [10].

Asia-Pacific

Country Metric Key Driver
China 16.8% CAGR Urban modern trade, bakery demand
India 14% of region Paneer-analogue and QSR pizza
Japan USD 0.11 Billion Convenience-store ready meals
Australia 14.2% CAGR Retailer sustainability programmes
Rest of Asia-Pacific 12% of region Southeast Asian coconut supply


Asia-Pacific expands fastest in the Non-Dairy Cheese Market because the underlying dairy habit is newest and least entrenched. India's position is structurally distinctive — domestic cashew processing capacity, an enormous pizza chain footprint and widespread lactose malabsorption converge in one geography [9] [15]. Chinese growth runs through bakery and tea-shop applications rather than the retail block format.

South America

Country Metric Key Driver
Brazil 58% of region São Paulo retail and vegan foodservice
Argentina 13.1% CAGR Urban health-oriented retail
Rest of South America USD 0.05 Billion Andean specialty retail


Brazil combines a large flexitarian urban population with domestic cashew and coconut supply, making it the only regional market with a credible path to local manufacturing at scale. Import dependence still constrains pricing elsewhere on the continent.

Middle East & Africa

Country Metric Key Driver
United Arab Emirates USD 0.03 Billion Hospitality and expatriate demand
Saudi Arabia 15.0% CAGR Tourism-linked foodservice growth
South Africa 24% of region Established health-retail channel
Rest of MEA 12.6% CAGR Halal-certified import expansion


Gulf demand is hospitality-led. Hotel and airline catering procurement, combined with halal certification advantages that plant-derived rennet-free products inherently enjoy, gives suppliers a route that bypasses thin retail distribution entirely.


Non-dairy cheese Market By Region, 2025-2035

Competitive Benchmarking

Company Est. Revenue Share Range Key Offerings for Non-Dairy Cheese Market Strategic Positioning
Upfield (Violife) ~11–14% Blocks, slices, shreds, cream style Global scale leader; coconut-oil platform
Bel Group (Nurishh) ~7–10% Slices, spreads, portioned formats Leverages existing dairy distribution
Danone (Follow Your Heart) ~6–9% Shreds, slices, cultured styles Premium and mainstream dual-tier
Otsuka Holdings (Daiya) ~5–8% Shreds, blocks, frozen applications Foodservice and frozen-meal focus
Saputo (Vitalite, Dairy Free) ~4–7% Blocks, grated, foodservice bulk Manufacturing efficiency play
Miyoko's Creamery ~3–5% Cultured cashew wheels, butters Artisanal, clean-label premium
ADM (Bute Island Foods) ~2–4% Sheese range, ingredient supply B2B ingredient integration
Kite Hill ~2–4% Almond cultured spreads, ricotta Chilled specialty positioning
Tofutti Brands ~1–3% Soy-based slices and spreads Legacy brand, price-tier defence
Good Planet Foods ~1–3% Shreds, slices, plant-protein blends Nutrition-forward differentiation


Recent News & Developments

  • Bel Group (March 2023): Expanded the Nurishh range across 12 European markets and committed to a 25% plant-based revenue mix by 2030, signalling that dairy incumbents view analogues as core rather than experimental [18].
  • U.S. Food and Drug Administration (February 2024): Issued draft labelling guidance for plant-based dairy alternatives addressing nutrient comparison statements, reducing compliance ambiguity for national brands [2].
  • Miyoko's Creamery (June 2024): Completed a leadership transition and refocused on cultured cashew wheels, exiting lower-margin shred formats to protect gross margin [19].
  • Saputo (September 2024): Consolidated dairy-alternative production into a single UK facility, citing capacity utilisation below 60% across its prior network [20].
  • Upfield (January 2025): Launched a reformulated Violife block with shortened ingredient decks across Western Europe, responding directly to clean-label scrutiny [21].
  • Danone (April 2025): Announced a partnership with a precision-fermentation developer to evaluate casein analogues for chilled cheese applications in North America [22].
  • ADM / Bute Island Foods (July 2025): Opened expanded manufacturing capacity in Scotland targeting foodservice and industrial bulk supply contracts [23].
  • European Commission (October 2025): Published implementing detail on sustainability claim substantiation, tightening evidentiary standards for carbon-footprint marketing across food categories [10].


Non-Dairy Cheese Market Report Scope

Parameter Detail
Market Scope Global Non-Dairy Cheese Market across source, product type, distribution channel and end user
Study Period 2021–2035 (Historical 2021–2024; Base Year 2025; Forecast 2026–2035)
CAGR 11.8% (2026–2035)
Market Size Checkpoints USD 3.20 Billion (2025); USD 3.58 Billion (2026); USD 9.77 Billion (2035)
Fastest Growing Segments Oat-based source; online retail channel; foodservice end user
Companies Profiled Upfield, Bel Group, Danone, Otsuka Holdings, Saputo, Miyoko's Creamery, ADM, Kite Hill, Tofutti Brands, Good Planet Foods
Valuation Currency USD, constant 2025 terms

FAQs

What contract terms should procurement teams prioritise when sourcing for the Non-Dairy Cheese Market?
Lock coconut and cashew input pricing on 18-month collars rather than spot exposure. Kernel prices swung more than 20% within 2024 alone, and unhedged suppliers passed that volatility straight through to buyers [11].
How do co-manufacturing economics compare with owned production?
Co-manufacturing suits volumes below roughly 4,000 tonnes annually; above that, owned lines recover capital within four years. Tolling agreements typically add 12–18% to unit cost but eliminate utilisation risk [20].
Which certification barriers slow entry into the Non-Dairy Cheese Market?
Halal and kosher certification are straightforward given the absence of animal rennet. Allergen segregation audits for nut-based lines are the real bottleneck, often adding three to five months to facility qualification [15].
Does precision fermentation compete with or complement plant-protein formulation?
It complements. Fermented casein supplies stretch and browning, while plant bases supply bulk, fat structure and cost control. Most 2026-generation products blend both rather than choosing one [12].
What integration challenges do foodservice operators face entering the Non-Dairy Cheese Market?
Shared prep surfaces create cross-contact risk that undermines the vegan claim entirely. Operators need dedicated storage, separate utensils and staff training — costs that often exceed the ingredient premium itself [8].
How should investors read private-label growth in this category?
Private label signals category maturity, not brand failure. It expands total volume while compressing branded margin, so evaluate holdings on manufacturing cost position rather than shelf-facing brand equity [7].
Which emerging application deserves the most attention through 2030?
Industrial bakery and frozen ready meals. These buyers need heat-stable analogues in bulk, contract for multiple years, and spend nothing on consumer marketing — structurally better economics than retail [24].      
Author
Author
Author Profile
Snehal Singh LinkedIn
Manager - Research
High acumen in analyzing complex macro & micro markets with more than 6 years of work experience in the field of market research. By implementing her analytical skills in forecasting and estimation into market research reports, she has expertise in Packaging, Construction, and Equipment domains. She handles a team size of 20-25 resources and ensures smooth running of the projects, associated marketing activities, and client servicing.
Share::
Request Free Sample

Research Approach


Secondary Research

The secondary research process involved comprehensive analysis of regulatory frameworks, food science publications, agricultural databases, and authoritative food industry organizations. Key sources included the US Food & Drug Administration (FDA), European Food Safety Authority (EFSA), US Department of Agriculture (USDA) National Agricultural Statistics Service, Plant Based Foods Association (PBFA), Good Food Institute (GFI), International Food Information Council (IFIC), National Institutes of Health (NIH) nutritional databases, Food and Agriculture Organization (FAO) of the United Nations, European Commission Agriculture and Rural Development Directorate, national food safety agencies from key markets (Health Canada, Food Standards Australia New Zealand), and proprietary retail audit databases (Nielsen, SPINS, IRI). These sources were used to collect production volume statistics, ingredient pricing trends, regulatory labeling requirements, nutritional research studies, retail scanner data, and competitive landscape analysis for almond-based, soy-based, cashew-based, coconut-based, and emerging protein fermentation technologies.


Primary Research

To gather both qualitative and quantitative information, the primary research process involved interviewing players from both the supply and demand sides. Executives from companies that make plant-based cheese, dairy alternative co-packers, and ingredient suppliers (emulsifiers, cultures, and flavor houses) were among the supply-side sources. They included chief innovation officers, heads of product development, regulatory compliance managers, and commercial directors. Executive chefs from fast-service and fast-casual restaurant chains, buyers from deli and prepared foods departments, category managers from natural/specialty stores and mass merchandisers, and procurement directors from foodservice distributors made up the demand-side sources. Data on pricing elasticity, shelf positioning tactics, and customer migration patterns from dairy to plant-based alternatives were acquired through primary research, which also corroborated timescales for capacity development and validated product formulation trends.

Primary Respondent Breakdown:

• By Designation: C-level Primaries (40%), Director Level (35%), Others (25%)

• By Region: North America (32%), Europe (30%), Asia-Pacific (28%), Rest of World (10%)


Market Size Estimation

Global market valuation was derived through production volume tracking and revenue aggregation analysis. The methodology included:

• Identification of 60+ key manufacturers and private label suppliers across North America, Europe, Asia-Pacific, and Latin America

• Product mapping across almond, soy, cashew, coconut, oat, and fermentation-derived protein categories (blocks, slices, shreds, spreads, and cream cheese formats)

• Analysis of reported revenues and estimated wholesale/retail markups specific to plant-based cheese portfolios

• Coverage of manufacturers and private labels representing 75-80% of global market share in 2024

• Extrapolation using bottom-up (retail scan data × velocity metrics by channel) and top-down (ingredient supply chain validation) approaches to derive segment-specific valuations, adjusted for foodservice and direct-to-consumer subscription channels

Share::
Request Free Sample
Download Free Sample

Kindly complete the form below to receive a free sample of this Report

* Please use a valid business email

Share::
Request Free Sample
Download PDF ×

We do not share your information with anyone. However, we may send you emails based on your report interest from time to time. You may contact us at any time to opt-out.
















