×
Hero Background
English
Chinese
French
Japanese
Korean
German
Spanish

Non Fuel Grade Alcohol Market Size

ID: MRFR/CnM/6290-CR
128 Pages
Chitranshi Jaiswal
February 2024

Non-Fuel Grade Alcohol Market Research Report Information By Type (Food Grade, Pharmaceutical Grade, Lab Grade, Industrial Grade and Others), By Application (Food & Beverages , Pharmaceuticals, Cosmetics & Personal Care, Chemical Solvent and Others) and By Region -Global Forecast to 2035

Share:
Download PDF ×

We do not share your information with anyone. However, we may send you emails based on your report interest from time to time. You may contact us at any time to opt-out.

Non Fuel Grade Alcohol Market Infographic
Purchase Options

Non Fuel Grade Alcohol Size

Non Fuel Grade Alcohol Market Growth Projections and Opportunities

The global market for non-fuel grade alcohol, valued at USD 18,470.0 million in 2021, is anticipated to reach USD 29,114.2 million by 2030, reflecting a Compound Annual Growth Rate (CAGR) of 5.50% throughout the forecast period. In terms of volume, the market stood at 16,341.5 kilotons in 2021, with projections indicating an increase to 24,338.2 kilotons by 2030.

The primary driver behind the expansion of the global non-fuel grade alcohol market is the escalating demand for this alcohol type in the food and beverages industry. This demand surge is attributed to the growing awareness of the adverse environmental effects and increasing knowledge regarding the depletion of fossil fuels among the populace. Additionally, the market benefits from favorable growth opportunities driven by changing lifestyles in various developing economies and an expanding economy across different regions.

The global non-fuel grade alcohol market is categorized based on type, application, and region. The increasing awareness of environmental issues and fossil fuel depletion has led to a rise in demand for non-fuel grade alcohol, contributing to the market's growth. The market is segmented into types such as food grade, pharmaceutical grade, lab grade, industrial grade, and others. Among these, the food grade segment dominated the market in 2021, holding a 48.02% share and is projected to maintain this lead with a CAGR of 5.91% during the forecast period.

In terms of application, the market is segmented into food and beverages, pharmaceuticals, cosmetics and personal care, chemical solvent, and others. The food and beverages segment claimed the largest share at 37.12% in 2021. This prominence is attributed to the exceptional properties of non-fuel grade alcohol as an additive in the food and beverages industry. The segment, valued at USD 6,855.4 million in 2021, is expected to grow at a CAGR of 6.07% to reach USD 11,349.7 million by 2030.
Non Fuel Grade Alcohol Market Size Graph
Author
Chitranshi Jaiswal
Research Analyst Level I

In her 3 years of experience in the market research field, she has handled critical cross-domain projects. She has an in-depth knowledge of market estimation & analysis, problem-solving, primary as well as secondary research, and team management.She holds an engineering degree and is an MBA professional from a well-known university, capable of evaluating the market and competitive conditions. An exceptional strategist with excellent communication skills and a passion for delivering cutting-edge & practical insights for the market. Proficient in multi-tasking, and can successfully deal with competing demands, while maintaining complete confidentiality. Generated business through active client and project development, networking, and high-quality responses. Her knowledge and skills have helped in making solid business decisions, securing funding from investors, and avoiding business failures.

Leave a Comment

FAQs

How much is the Non-Fuel Grade Alcohol Market?

US$ 19747.03 Mn

What is the growth rate of the Non-Fuel Grade Alcohol Market?

5.50%

Which region held the largest market share in the Non-Fuel Grade Alcohol Market?

Europe

Who are the key players in the Non-Fuel Grade Alcohol Market?

Archer-Daniels-Midland Company (US), Cargill Incorporated (US), Sasol (South Africa), Merck KGaA (Germany), CropEnergies AG (Germany), LyondellBasell Industries NV (Netherlands), Pannonia Bio (Hungary), Wilmar Sugar Pty Ltd. (Singapore), Godavari Biorefineries Ltd (India), Solvay (Belgium)

Which Type had the largest market share in the Non-Fuel Grade Alcohol Market?

Food Grade

Which Application had the largest market share in the Non-Fuel Grade Alcohol Market?

Food & Beverages

Market Summary

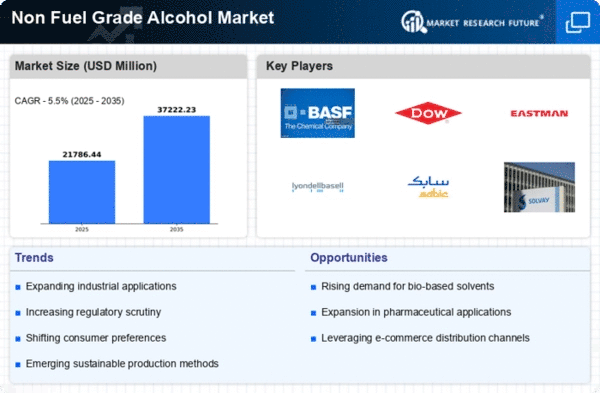
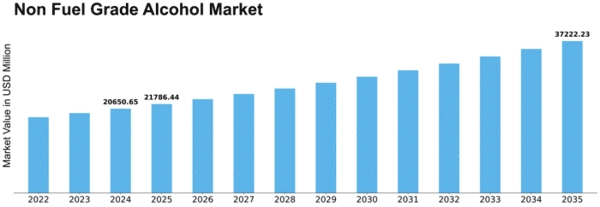
The Global Non-Fuel Grade Alcohol Market is projected to grow from 20650.65 USD Billion in 2024 to 37222.23 USD Billion by 2035.

Key Market Trends & Highlights

Non-Fuel Grade Alcohol Key Trends and Highlights

  • The market is expected to experience a compound annual growth rate (CAGR) of 5.32 percent from 2025 to 2035.
  • By 2035, the market valuation is anticipated to reach 36.5 USD Billion, indicating robust growth potential.
  • in 2024, the market is valued at 20650.65 USD Billion, reflecting a solid foundation for future expansion.
  • Growing adoption of non-fuel grade alcohol in various industrial applications due to increasing demand for sustainable alternatives is a major market driver.

Market Size & Forecast

2024 Market Size 20650.65 (USD Million)
2035 Market Size 37222.23 (USD Million)
CAGR (2025-2035) 5.50%
Largest Regional Market Share in 2024 latin_america)

Major Players

Archer-Daniels-Midland Company, Cargill Incorporated, Sasol, Merck KGaA, CropEnergies AG, LyondellBasell Industries NV, Pannonia Bio, Wilmar Sugar Pty Ltd., Godavari Biorefineries Ltd, Solvay

Market Trends

Increasing use of non-fuel grade alcohol in food & beverages industry will fuel the growth of Non-Fuel Grade Alcohol market.

Food additives frequently contain ethanol which is non-fuel grade alcohol as it can improve colour constancy, it is a component of various food colourings. Moreover, it is utilised to enhance flavour in several food extracts, including vanilla extract. For instance, ethanol is added to port, sherry, and other southern wines, a procedure known as fortification, to bring the fermentation process to a desirable conclusion at the appropriate time. With some exceptions, these liqueurs and wines have a high residual sugar content because the fermentation was stopped too soon, making them very sweet.

As ethanol can be used to preserve other foods, it has been widely employed for both food preservation and hygiene control in food manufacturers.

Grain alcohol, also known as non-fuel grade alcohol, is produced from a variety of plants, including wheat, barley, sugarcane, and corn. It is frequently utilised as a foundation in the creation of artisanal drinks and beer. Because beer is less expensive than other alcoholic beverages and is more readily available in a variety of retail outlets, beer consumption has surged during the past several years. Moreover, beer has less ABV (alcohol by volume) than other alcoholic beverages. As a result, a growing number of sober-conscious people prefer beer to other alcoholic beverages including spirits.

As a result, the market for grain alcohol is expanding due to the growing demand for beer.

Therefore, increasing use of non-fuel grade alcohol in food preservatives and beverages production is likely to drive the global market in the forecast period.

Non Fuel Grade Alcohol Market Market Drivers

Market Growth Projections

The Global Non-Fuel Grade Alcohol Market Industry is poised for substantial growth, with projections indicating a market value of 20.6 USD Billion in 2024 and an anticipated increase to 36.5 USD Billion by 2035. This growth trajectory suggests a compound annual growth rate of 5.32% from 2025 to 2035, driven by various factors including rising consumer demand, technological advancements, and regulatory support. The market's expansion reflects broader trends in sustainability and health consciousness, positioning non-fuel grade alcohol as a vital component in multiple industries.

Regulatory Support for Biofuels

The Global Non-Fuel Grade Alcohol Market Industry benefits from favorable regulatory frameworks that promote the use of biofuels and renewable resources. Governments worldwide are implementing policies that encourage the production and consumption of bio-based alcohols, which are often derived from agricultural feedstocks. This regulatory support not only enhances the market's sustainability profile but also drives innovation in production technologies. As countries aim to reduce carbon emissions, the shift towards bio-based non-fuel grade alcohol could lead to increased investments and market expansion, aligning with global sustainability goals.

Growth in Food and Beverage Sector

The Global Non-Fuel Grade Alcohol Market Industry is significantly influenced by the expansion of the food and beverage sector. Non-fuel grade alcohol is widely used as a preservative and flavoring agent in various food products, including sauces, dressings, and alcoholic beverages. The increasing trend of craft brewing and distilling has further propelled the demand for high-quality ethanol. As the food and beverage industry continues to grow, projected to reach 36.5 USD Billion by 2035, the reliance on non-fuel grade alcohol is likely to increase, thereby enhancing the market's overall growth prospects.

Increased Awareness of Health Benefits

The Global Non-Fuel Grade Alcohol Market Industry is witnessing a surge in consumer awareness regarding the health benefits associated with certain types of alcohol, particularly in the context of low-alcohol and non-alcoholic beverages. This trend is driven by a growing emphasis on health and wellness, with consumers seeking alternatives that offer enjoyment without compromising their health. As the market for low-alcohol beverages expands, the demand for non-fuel grade alcohol is likely to rise, reflecting a shift in consumer preferences towards healthier lifestyle choices.

Rising Demand for Personal Care Products

The Global Non-Fuel Grade Alcohol Market Industry experiences a notable increase in demand for personal care products, which often utilize non-fuel grade alcohol as a key ingredient. This trend is driven by consumer preferences for natural and organic formulations, leading to a surge in the use of ethanol in cosmetics and skincare. For instance, the global market for personal care products is projected to reach approximately 20.6 USD Billion in 2024, with non-fuel grade alcohol playing a pivotal role in formulations. This shift towards cleaner beauty products suggests a sustained growth trajectory for the industry, as consumers increasingly prioritize health and wellness.

Technological Advancements in Production

Technological innovations in the production of non-fuel grade alcohol are reshaping the Global Non-Fuel Grade Alcohol Market Industry. Advances in fermentation processes and distillation techniques have improved efficiency and reduced costs, making it more feasible for manufacturers to produce high-quality alcohol at scale. These innovations are particularly relevant as the market anticipates a compound annual growth rate of 5.32% from 2025 to 2035. Enhanced production capabilities not only meet rising consumer demand but also contribute to the overall competitiveness of the industry in the global marketplace.

Market Segment Insights

Non-Fuel Grade Alcohol by Type Insights

The Non-Fuel Grade Alcohol Market segmentation, based on Type has been segmented as Food Grade, Pharmaceutical Grade, Lab Grade, Industrial Grade and Others. Among these, the Food Grade type is projected to dominate the Non-Fuel Grade Alcohol Market revenue through the projected period.  Over the projection period, the Food Grade segment will contribute the biggest market share. Food-grade alcohol is the ultra-pure grade of ethyl alcohol having a purity of 99–100% (absolute ethanol) and is used for portable applications, such as alcoholic beverages, aromas, and flavors.

Since food-grade ethyl alcohol is intended for human consumption, chemicals are permitted to be mixed with this alcohol to maintain the highest possible level of purity.

Non-Fuel Grade Alcohol by Application Insights

Based on Application, the Non-Fuel Grade Alcohol Market is segmented as Food & Beverages , Pharmaceuticals, Cosmetics & Personal Care, Chemical Solvent and Others. Out of which the Food & Beverages segment dominated the base year market and is also projected to be holding a dominating share in the forecasted period as well. The segment growth is anticipated to be boosted in the upcoming years as the food and beverage industry has traditionally been the largest consumer of non-fuel-grade alcohol market products. Alcohol of a non-fuel grade is utilised in portable applications such as alcoholic beverages, fragrances, and tastes.

Because food-grade ethyl alcohol is designed for human consumption, chemicals may be blended with it to preserve the highest level of purity feasible. Several spirit drinks are prepared with alcohol (flavourless, odourless, and colourless) derived from cereals, grapes, molasses, potatoes, and other agricultural sources.

Get more detailed insights about Non-Fuel Grade Alcohol Market Research Report — Global Forecast till 2035

Regional Insights

Key Players and Competitive Insights

Key market players are emphasizing significantly on R&D for increasing their product offerings, which will further help the Non-Fuel Grade Alcohol Market to grow considerably. Market players are adopting several business development strategies such as acquisitions, mergers, collaborations, and partnerships to enhance their market presence and acquire larger customer base. To survive in the competitive market, industry players must provide cost effective products.

The Non-Fuel Grade Alcohol market is very competitive with market players trying to develop unique and innovative products and solutions, which could render the competitors’ offerings obsolete. The competitive environment is likely to grow further owing to rising technological advancements. Some of the key players operating in the Non-Fuel Grade Alcohol Market are Archer-Daniels-Midland Company, Cargill Incorporated, Sasol, Merck KGaA, CropEnergies AG, LyondellBasell Industries NV, Pannonia Bio, Wilmar Sugar Pty Ltd., Godavari Biorefineries Ltd, and Solvay.To increase their global reach and client base, key firms are concentrating on acquisitions and product innovation.

Archer-Daniels-Midland Company: also known as ADM, is a multinational American corporation that was established in 1902 and has its corporate headquarters in Chicago, Illinois. Cereal grains and oilseeds are processed at the company's more than 270 plants and 420 crop procurement sites across the world into goods that are used in the global food, beverage, nutraceutical, industrial, and animal feed sectors. The company Archer-Daniels-Midland purchases, transports, stores, and merchandises agricultural goods. The business refines oilseeds, corn, milo, oats, wheat, oat bran, and peanuts.

In addition, Archer-Daniels-Midland processes and produces goods that are generally used as ingredients for food or animal feed. Ethanol is produced under the fuel segment. Ethanol produced from corn fibers produces a large amount of animal feed as a co-product. It is involved in a partnership with other leading companies and research firms to come up with innovative solutions and next-generation biofuels made from cellulose sources The goal of ADM is to turn natural resources such cereal grains and oilseeds into a variety of goods, including supplements, food and beverage components and flavourings, and nutritional goods for animals and pets.

ADM has also been named by Fortune as one of the most admired food manufacturing corporations in the world, including in 2021.

Cargill Incorporated: is an agribusiness corporation that offers food, financial products, agricultural, industrial, and risk management services. It markets, processes, and distributes grains, oilseeds, sugar, meat, and other food goods, as well as cotton. Natural ingredients are also produced for the personal care business, pet food, animal feed, and bio-industrial products. Technical assistance, data asset solutions, transportation and logistics services, risk management services, and marketing services are all offered by the organisation. Furthermore, the company manufactures and distributes starch and starch sweeteners, as well as fuel ethanol and biodiesel.

The company sells feed and pet food under several names, including Nutrena, Provimi, Cargill, EWOS, Diamond V, and Purina. The company operates across 70 countries in the Americas, Europe, the Middle East, and Africa, as well as Asia Pacific. Cargill's headquarters are in Minneapolis, Minnesota, in the United States.

Key Companies in the Non Fuel Grade Alcohol Market market include

Industry Developments

January 2023: Cargill has been named the winner in the 2023 BIG Innovation Awards presented by the Business Intelligence Group.

September 2022: CropEnergies acquires stake in Dutch biobased chemicals start-up Syclus: CropEnergies AG, Mannheim, Germany, has acquired a stake in the Dutch. start-up for biobased chemicals Syclus BV, Maastricht. CropEnergies purchases 50 percent of the company's share capital. The investment volume amounts to EUR 1.8 million.

October 2021: Pannonia Bio Wins Icheme Global Energy Award 2021: team of Pannonia Bio engineers and experts were named winners of the IChemE Energy Award 2021 for their success with the project “Decarbonizing biorefineries to produce greener bioethanol”. These awards are organized by the Institution of Chemical Engineers, a group that exists to advance chemical engineering’s contribution for the benefit of society.

Future Outlook

Non Fuel Grade Alcohol Market Future Outlook

The Global Non-Fuel Grade Alcohol Market is projected to grow at a 5.50% CAGR from 2025 to 2035, driven by increasing demand in pharmaceuticals, cosmetics, and food industries.

New opportunities lie in:

  • Develop eco-friendly production methods to capture environmentally conscious consumers.
  • Expand distribution channels in emerging markets to increase market penetration.
  • Invest in R&D for innovative applications in bioplastics and solvents.

By 2035, the market is expected to exhibit robust growth, reflecting evolving consumer preferences and technological advancements.

Market Segmentation

Non-Fuel Grade Alcohol Type Outlook

  • Food Grade
  • Pharmaceutical Grade
  • Lab Grade
  • Industrial Grade
  • Others

Non-Fuel Grade Alcohol Application Outlook

  • Food & Beverages
  • Pharmaceuticals
  • Cosmetics & Personal Care
  • Chemical Solvent
  • Others

Report Scope

Report Attribute/Metric Details
Market Size 2024 USD 20650.65 million
Market Size 2035 37222.23
Compound Annual Growth Rate (CAGR) 5.50% (2025 - 2035)
Base Year 2024
Forecast Period 2025 - 2035
Historical Data 2019 & 2021
Forecast Units Value (USD Million)
Report Coverage Revenue Forecast, Competitive Landscape, Growth Factors, and Trends
Segments Covered Type, Application and Region
Geographies Covered North America, Europe, Asia Pacific, Middle East & Africa and Latin America
Countries Covered US, Canada, Germany, France, Italy, Spain and Portugal, UK and Ireland, Austria and Switzerland, Benelux, Nordics (Sweden, Norway, Denmark),, China , India , Japan, South Korea, Brazil, Mexico, Argentina, GCC Countries, South Africa
Key Companies Profiled Archer-Daniels-Midland Company (US), Cargill Incorporated (US), Sasol (South Africa), Merck KGaA (Germany), CropEnergies AG (Germany), LyondellBasell Industries NV (Netherlands), Pannonia Bio (Hungary), Wilmar Sugar Pty Ltd.   (Singapore), Godavari Biorefineries Ltd (India), Solvay (Belgium)
Key Market Opportunities ·       Rising demand in the pharmaceuticals and personal care industries
Key Market Dynamics ·       Increasing use of non-fuel grade alcohol in food & beverages industry
Market Size 2025 21786.85

FAQs

How much is the Non-Fuel Grade Alcohol Market?

US$ 19747.03 Mn

What is the growth rate of the Non-Fuel Grade Alcohol Market?

5.50%

Which region held the largest market share in the Non-Fuel Grade Alcohol Market?

Europe

Who are the key players in the Non-Fuel Grade Alcohol Market?

Archer-Daniels-Midland Company (US), Cargill Incorporated (US), Sasol (South Africa), Merck KGaA (Germany), CropEnergies AG (Germany), LyondellBasell Industries NV (Netherlands), Pannonia Bio (Hungary), Wilmar Sugar Pty Ltd. (Singapore), Godavari Biorefineries Ltd (India), Solvay (Belgium)

Which Type had the largest market share in the Non-Fuel Grade Alcohol Market?

Food Grade

Which Application had the largest market share in the Non-Fuel Grade Alcohol Market?

Food & Beverages

  1. EXECUTIVE SUMMARY
  2. GLOBAL NON-FUEL
  3. GRADE ALCOHOL MARKET, BY type
  4. GLOBAL NON-FUEL GRADE ALCOHOL MARKET, BY Application
  5. GLOBAL NON-FUEL
  6. GRADE ALCOHOL MARKET analysis, BY Region
  7. MARKET INTRODUCTION
    1. DEFINITION
    2. Scope of the Study
    3. MARKET STRUCTURE
  8. RESEARCH METHODOLOGY
    1. RESEARCH PROCESS
    2. PRIMARY RESEARCH
    3. SECONDARY RESEARCH
    4. MARKET SIZE ESTIMATION
    5. FORECAST MODEL
    6. List of Assumptions
  9. market dynamics
    1. introduction
    2. Drivers
      1. Increasing use of Non-Fuel Grade Alcohol in
    3. food & beverages industry
    4. restraints
      1. raw material prices hampering the market growth
    5. opportunities
      1. Rising Demand in the Pharmaceuticals
    6. and Personal Care Industries
    7. cHALLENGES
      1. adverse effects of non-fuel grade alcohol
  10. MARKET FACTOR ANALYSIS
    1. SUPPLY CHAIN ANALYSIS
      1. Raw Materials Suppliers
      2. NON-FUEL GRADE ALCOHOL Manufacturers
      3. Distribution Channels
      4. Application
    2. PORTER’S FIVE
      1. Threat of Substitutes
      2. Bargaining Power of Buyers
      3. Intensity of Rivalry
    3. FORCES MODEL
    4. Threat of New Entrants
    5. Bargaining Power of Suppliers
    6. Pricing analysis by Region, USD/Ton, 2019-2021
    7. Impact of Covid-19
      1. Impact on Supply Chain on Global Non-Fuel Grade
    8. on the global market for Non-Fuel Grade Alcohol
    9. Alcohol Market
  11. GLOBAL NON-FUEL GRADE ALCOHOL MARKET, BY TYPE
    1. OVERVIEW
      1. NON-FUEL GRADE ALCOHOL: MARKET ESTIMATES &
      2. NON-FUEL GRADE ALCOHOL: MARKET ESTIMATES & FORECAST BY TYPE,
    2. FORECAST BY TYPE, 2019–2030
    3. Food Grade
    4. FOOD GRADE: MARKET ESTIMATES & FORECAST BY region,2019–2030
    5. Pharmaceutical Grade
      1. PHARMACEUTICAL
    6. GRADE: MARKET ESTIMATES & FORECAST BY region,2019–2030
    7. Lab Grade
      1. LAB GRADE: MARKET ESTIMATES
    8. & FORECAST BY region,2019–2030
    9. Industrial Grade
      1. Industrial Grade: MARKET ESTIMATES & FORECAST
    10. BY region,2019–2030
    11. OTHERS
      1. OTHERS: MARKET ESTIMATES & FORECAST BY region,2019–2030
  12. GLOBAL NON-FUEL GRADE
  13. ALCOHOL MARKET, BY APPLICATION
    1. OVERVIEW
      1. NON-FUEL GRADE ALCOHOL: MARKET ESTIMATES & FORECAST BY APPLICATION,
    2. NON-FUEL GRADE ALCOHOL: MARKET ESTIMATES & FORECAST BY APPLICATION, 2019–2030
    3. FOOD & BEVERAGES
    4. PHARMACEUTICALS
      1. PHARMACEUTICALS:
    5. MARKET ESTIMATES & FORECAST BY region,2019–2030
    6. COSMETICS & PERSONAL CARE
    7. CHEMICAL SOLVENT
    8. others
  14. global NON-FUEL GRADE
    1. ALCOHOL MARKET by type in application
    2. OVERVIEW
      1. NON-FUEL GRADE ALCOHOL: MARKET ESTIMATES & FORECAST
      2. NON-FUEL GRADE ALCOHOL: MARKET ESTIMATES & FORECAST BY type
    3. BY type in APPLICATION, 2019-2030
    4. in APPLICATION, 2019–2030
  15. GLOBAL NON-FUEL GRADE ALCOHOL MARKET, BY REGION
    1. OVERVIEW
    2. NORTH AMERICA
      1. US
      2. canada
    3. europe
      1. germany
      2. france
      3. Italy
      4. Spain and Portugal
      5. UK and Ireland
      6. Austria and Switzerland
      7. Benelux
      8. Nordics (Sweden, Norway, Denmark)
      9. central and eastern
      10. GCC Countries
      11. South Africa
      12. Rest of Middle East & Africa
    4. europe
    5. southern Europe
    6. asia-pacific
    7. China
    8. India
    9. Japan
    10. South Korea
    11. Rest of Asia-Pacific
    12. Latin America
    13. Brazil
    14. Mexico
    15. Argentina
    16. Rest of Latin America
    17. Middle East & Africa
  16. COMPETITIVE LANDSCAPE
    1. introduction
    2. Global Market Strategy Analysis
    3. COMPETITIVE BENCHMARKING
    4. KEY DEVELOPMENTS
      1. COMPANY OVERVIEW
      2. FINANCIAL OVERVIEW
      3. PRODUCTS OFFERed
      4. KEY DEVELOPMENTS
      5. SWOT ANALYSIS
      6. KEY STRATEGIES
    5. and GROWTH STRATEGIES
    6. RECOGNITION
    7. Acquisition
    8. COMPANY PROFILES
    9. Archer Daniels Midland Company
    10. Cargill, Incorporated
      1. COMPANY OVERVIEW
      2. FINANCIAL OVERVIEW
      3. PRODUCTS OFFERed
      4. KEY DEVELOPMENTS
      5. SWOT ANALYSIS
      6. KEY STRATEGIES
    11. Sasol
      1. COMPANY OVERVIEW
      2. FINANCIAL OVERVIEW
      3. PRODUCTS OFFERed
      4. KEY DEVELOPMENTS
      5. SWOT ANALYSIS
      6. KEY STRATEGIES
    12. Merck KGaA
      1. COMPANY OVERVIEW
      2. FINANCIAL OVERVIEW
      3. PRODUCTS OFFERed
      4. KEY DEVELOPMENTS
      5. SWOT ANALYSIS
      6. KEY STRATEGIES
    13. CropEnergies AG
      1. COMPANY OVERVIEW
      2. FINANCIAL OVERVIEW
      3. PRODUCTS OFFERed
      4. KEY DEVELOPMENTS
      5. SWOT ANALYSIS
      6. KEY STRATEGIES
    14. LyondellBasell Industries Holdings BV
      1. COMPANY OVERVIEW
      2. FINANCIAL OVERVIEW
      3. PRODUCTS OFFERed
      4. KEY DEVELOPMENTS
      5. SWOT ANALYSIS
      6. KEY STRATEGIES
    15. Pannonia Bio
      1. COMPANY OVERVIEW
      2. FINANCIAL OVERVIEW
      3. PRODUCTS OFFERed
      4. KEY DEVELOPMENTS
      5. SWOT ANALYSIS
      6. KEY STRATEGIES
    16. Wilmar Sugar Pty
    17. Ltd.
    18. COMPANY OVERVIEW
    19. FINANCIAL OVERVIEW
    20. PRODUCTS OFFERed
    21. KEY DEVELOPMENTS
  17. SWOT ANALYSIS
    1. KEY STRATEGIES
    2. Godavari Biorefineries Ltd
  18. COMPANY OVERVIEW
  19. FINANCIAL OVERVIEW
  20. PRODUCTS OFFERed
  21. KEY DEVELOPMENTS
  22. SWOT ANALYSIS
  23. KEY STRATEGIES
    1. Solvay
      1. COMPANY OVERVIEW
      2. FINANCIAL OVERVIEW
      3. PRODUCTS OFFERed
      4. KEY DEVELOPMENTS
      5. SWOT ANALYSIS
      6. KEY STRATEGIES
  24. APPENDIX
    1. REFERENCES
    2. RELATED REPORTS
  25. LIST OF TABLES
  26. LIST OF ASSUMPTIONS
  27. NON-FUEL GRADE ALCOHOL MARKET ESTIMATES &
    1. FORECAST, BY TYPE, 2019–2030 (USD MILLION)
  28. NON-FUEL GRADE ALCOHOL MARKET ESTIMATES &
    1. FORECAST, BY TYPE, 2019–2030 (KILOTONS)
  29. FOOD GRADE MARKET ESTIMATES & FORECAST,
    1. BY REGION, 2019–2030 (USD MILLION)
  30. FOOD GRADE MARKET ESTIMATES & FORECAST, BY REGION,
  31. PHARMACEUTICAL GRADE MARKET ESTIMATES & FORECAST, BY REGION,
  32. PHARMACEUTICAL GRADE MARKET ESTIMATES & FORECAST, BY REGION,
  33. LAB GRADE MARKET ESTIMATES & FORECAST, BY REGION, 2019–2030
    1. (USD MILLION)
    2. TABLE
  34. LAB GRADE MARKET ESTIMATES & FORECAST, BY REGION, 2019–2030 (KILOTONS)
  35. INDUSTRIAL GRADE
  36. MARKET ESTIMATES & FORECAST, BY REGION, 2019–2030 (USD MILLION)
  37. INDUSTRIAL GRADE
  38. MARKET ESTIMATES & FORECAST, BY REGION, 2019–2030 (KILOTONS)
  39. OTHERS MARKET
    1. ESTIMATES & FORECAST, BY REGION, 2019–2030 (USD MILLION)
  40. OTHERS MARKET ESTIMATES
    1. & FORECAST, BY REGION, 2019–2030 (KILOTONS)
  41. NON-FUEL GRADE ALCOHOL MARKET ESTIMATES
    1. & FORECAST, BY APPLICATION, 2019–2030 (USD MILLION)
  42. NON-FUEL GRADE ALCOHOL
  43. MARKET ESTIMATES & FORECAST, BY APPLICATION, 2019–2030 (KILOTONS)
  44. FOOD & BEVERAGES
  45. MARKET ESTIMATES & FORECAST, BY REGION, 2019–2030 (USD MILLION)
  46. FOOD & BEVERAGES
  47. MARKET ESTIMATES & FORECAST, BY REGION, 2019–2030 (KILOTONS)
  48. PHARMACEUTICALS
  49. MARKET ESTIMATES & FORECAST, BY REGION, 2019–2030 (USD MILLION)
  50. PHARMACEUTICALS
  51. MARKET ESTIMATES & FORECAST, BY REGION, 2019–2030 (KILOTONS)
  52. COSMETICS &
  53. PERSONAL CARE MARKET ESTIMATES & FORECAST, BY REGION, 2019–2030 (USD MILLION)
  54. COSMETICS &
  55. PERSONAL CARE MARKET ESTIMATES & FORECAST, BY REGION, 2019–2030 (KILOTONS)
  56. CHEMICAL SOLVENT
  57. MARKET ESTIMATES & FORECAST, BY REGION, 2019–2030 (USD MILLION)
  58. CHEMICAL SOLVENT
  59. MARKET ESTIMATES & FORECAST, BY REGION, 2019–2030 (KILOTONS)
  60. OTHERS MARKET
    1. ESTIMATES & FORECAST, BY REGION, 2019–2030 (USD MILLION)
  61. OTHERS MARKET ESTIMATES
    1. & FORECAST, BY REGION, 2019–2030 (KILOTONS)
  62. NON-FUEL GRADE ALCOHOL MARKET ESTIMATES
    1. & FORECAST, BY TYPE IN APPLICATION, 2019–2030 (USD MILLION)
  63. NON-FUEL GRADE
  64. ALCOHOL MARKET ESTIMATES & FORECAST, BY TYPE IN APPLICATION, 2019–2030
    1. (KILOTONS)
    2. TABLE
  65. GLOBAL NON-FUEL GRADE ALCOHOL MARKET, BY REGION, 2019–2030 (USD MILLION)
  66. GLOBAL NON-FUEL
  67. GRADE ALCOHOL MARKET, BY REGION, 2019–2030 (KILOTONS)
  68. NORTH AMERICA: NON-FUEL GRADE ALCOHOL MARKET,
    1. BY COUNTRY, 2019–2030 (USD MILLION)
  69. NORTH AMERICA: NON-FUEL GRADE ALCOHOL MARKET,
    1. BY COUNTRY, 2019–2030 (KILOTONS)
  70. NORTH AMERICA: NON-FUEL GRADE ALCOHOL MARKET, BY
    1. TYPE, 2019–2030 (USD MILLION)
  71. NORTH AMERICA: NON-FUEL GRADE ALCOHOL MARKET, BY
    1. TYPE, 2019–2030 (KILOTONS)
  72. NORTH AMERICA: NON-FUEL GRADE ALCOHOL MARKET, BY APPLICATION,
  73. NORTH AMERICA: NON-FUEL GRADE ALCOHOL MARKET, BY APPLICATION,
  74. NORTH AMERICA: NON-FUEL GRADE ALCOHOL MARKET, BY TYPE IN APPLICATION,
  75. NORTH AMERICA: NON-FUEL GRADE ALCOHOL MARKET, BY TYPE IN APPLICATION,
  76. US: NON-FUEL GRADE ALCOHOL MARKET, BY TYPE, 2019–2030
    1. (USD MILLION)
    2. TABLE
  77. US: NON-FUEL GRADE ALCOHOL MARKET, BY TYPE, 2019–2030 (KILOTONS)
  78. US: NON-FUEL
  79. GRADE ALCOHOL MARKET, BY APPLICATION, 2019–2030 (USD MILLION)
  80. US: NON-FUEL GRADE ALCOHOL
  81. MARKET, BY APPLICATION, 2019–2030 (KILOTONS)
  82. US: NON-FUEL GRADE ALCOHOL MARKET, BY TYPE
    1. IN APPLICATION, 2019–2030 (USD MILLION)
  83. US: NON-FUEL GRADE ALCOHOL MARKET, BY TYPE
    1. IN APPLICATION, 2019–2030 (KILOTONS
  84. CANADA: NON-FUEL GRADE ALCOHOL MARKET, BY
    1. TYPE, 2019–2030 (USD MILLION)
  85. CANADA: NON-FUEL GRADE ALCOHOL MARKET, BY TYPE,
  86. CANADA:: NON-FUEL GRADE ALCOHOL MARKET, BY APPLICATION, 2019–2030
    1. (USD MILLION)
    2. TABLE
  87. CANADA: NON-FUEL GRADE ALCOHOL MARKET, BY APPLICATION, 2019–2030 (KILOTONS)
  88. CANADA: NON-FUEL
  89. GRADE ALCOHOL MARKET, BY TYPE IN APPLICATION, 2019–2030 (USD MILLION)
  90. CANADA: NON-FUEL
  91. GRADE ALCOHOL MARKET, BY TYPE IN APPLICATION, 2019–2030 (KILOTONS
  92. EUROPE: NON-FUEL
  93. GRADE ALCOHOL MARKET, BY COUNTRY, 2019–2030 (USD MILLION)
  94. EUROPE: NON-FUEL GRADE
  95. ALCOHOL MARKET, BY COUNTRY, 2019–2030 (KILOTONS)
  96. EUROPE: NON-FUEL GRADE ALCOHOL MARKET, BY
    1. TYPE, 2019–2030 (USD MILLION)
  97. EUROPE: NON-FUEL GRADE ALCOHOL MARKET, BY TYPE,
  98. EUROPE: NON-FUEL GRADE ALCOHOL MARKET, BY APPLICATION, 2019–2030
    1. (USD MILLION)
    2. TABLE
  99. EUROPE: NON-FUEL GRADE ALCOHOL MARKET, BY APPLICATION, 2019–2030 (KILOTONS)
  100. EUROPE: NON-FUEL
  101. GRADE ALCOHOL MARKET, BY TYPE IN APPLICATION, 2019–2030 (USD MILLION)
  102. EUROPE: NON-FUEL
  103. GRADE ALCOHOL MARKET, BY TYPE IN APPLICATION, 2019–2030 (KILOTONS
  104. GERMANY: NON-FUEL
  105. GRADE ALCOHOL MARKET, BY TYPE, 2019–2030 (USD MILLION)
  106. GERMANY: NON-FUEL GRADE ALCOHOL MARKET,
    1. BY TYPE, 2019–2030 (KILOTONS)
  107. GERMANY: NON-FUEL GRADE ALCOHOL MARKET, BY APPLICATION,
  108. GERMANY: NON-FUEL GRADE ALCOHOL MARKET, BY APPLICATION, 2019–2030
    1. (KILOTONS)
    2. TABLE
  109. GERMANY: NON-FUEL GRADE ALCOHOL MARKET, BY TYPE IN APPLICATION, 2019–2030
    1. (USD MILLION)
    2. TABLE
  110. GERMANY: NON-FUEL GRADE ALCOHOL MARKET, BY TYPE IN APPLICATION, 2019–2030
    1. (KILOTONS
    2. TABLE
  111. FRANCE: NON-FUEL GRADE ALCOHOL MARKET, BY TYPE, 2019–2030 (USD MILLION)
  112. FRANCE: NON-FUEL
  113. GRADE ALCOHOL MARKET, BY TYPE, 2019–2030 (KILOTONS)
  114. FRANCE: NON-FUEL GRADE ALCOHOL MARKET, BY
    1. APPLICATION, 2019–2030 (USD MILLION)
  115. FRANCE: NON-FUEL GRADE ALCOHOL MARKET, BY
    1. APPLICATION, 2019–2030 (KILOTONS)
  116. FRANCE: NON-FUEL GRADE ALCOHOL MARKET, BY TYPE
    1. IN APPLICATION, 2019–2030 (USD MILLION)
  117. FRANCE: NON-FUEL GRADE ALCOHOL MARKET, BY
    1. TYPE IN APPLICATION, 2019–2030 (KILOTONS
  118. ITALY: NON-FUEL GRADE ALCOHOL MARKET, BY
    1. TYPE, 2019–2030 (USD MILLION)
  119. ITALY: NON-FUEL GRADE ALCOHOL MARKET, BY TYPE,
  120. ITALY: NON-FUEL GRADE ALCOHOL MARKET, BY APPLICATION, 2019–2030
    1. (USD MILLION)
    2. TABLE
  121. ITALY: NON-FUEL GRADE ALCOHOL MARKET, BY APPLICATION, 2019–2030 (KILOTONS)
  122. ITALY: NON-FUEL
  123. GRADE ALCOHOL MARKET, BY TYPE IN APPLICATION, 2019–2030 (USD MILLION)
  124. ITALY: NON-FUEL
  125. GRADE ALCOHOL MARKET, BY TYPE IN APPLICATION, 2019–2030 (KILOTONS
  126. SPAIN AND PORTUGAL:
  127. NON-FUEL GRADE ALCOHOL MARKET, BY TYPE, 2019–2030 (USD MILLION)
  128. SPAIN AND PORTUGAL:
  129. NON-FUEL GRADE ALCOHOL MARKET, BY TYPE, 2019–2030 (KILOTONS)
  130. SPAIN AND PORTUGAL:
  131. NON-FUEL GRADE ALCOHOL MARKET, BY APPLICATION, 2019–2030 (USD MILLION)
  132. SPAIN AND PORTUGAL:
  133. NON-FUEL GRADE ALCOHOL MARKET, BY APPLICATION, 2019–2030 (KILOTONS)
  134. SPAIN AND PORTUGAL:
  135. NON-FUEL GRADE ALCOHOL MARKET, BY TYPE IN APPLICATION, 2019–2030 (USD MILLION)
  136. SPAIN AND PORTUGAL:
  137. NON-FUEL GRADE ALCOHOL MARKET, BY TYPE IN APPLICATION, 2019–2030 (KILOTONS
  138. UK AND IRELAND:
  139. NON-FUEL GRADE ALCOHOL MARKET, BY TYPE, 2019–2030 (USD MILLION)
  140. UK AND IRELAND:
  141. NON-FUEL GRADE ALCOHOL MARKET, BY TYPE, 2019–2030 (KILOTONS)
  142. UK AND IRELAND: NON-FUEL
  143. GRADE ALCOHOL MARKET, BY APPLICATION, 2019–2030 (USD MILLION)
  144. UK AND IRELAND: NON-FUEL
  145. GRADE ALCOHOL MARKET, BY APPLICATION, 2019–2030 (KILOTONS)
  146. UK AND IRELAND: NON-FUEL
  147. GRADE ALCOHOL MARKET, BY TYPE IN APPLICATION, 2019–2030 (USD MILLION)
  148. UK AND IRELAND:
  149. NON-FUEL GRADE ALCOHOL MARKET, BY TYPE IN APPLICATION, 2019–2030 (KILOTONS
  150. AUSTRIA AND
  151. SWITZERLAND: NON-FUEL GRADE ALCOHOL MARKET, BY TYPE, 2019–2030 (USD MILLION)
  152. AUSTRIA AND
  153. SWITZERLAND: NON-FUEL GRADE ALCOHOL MARKET, BY TYPE, 2019–2030 (KILOTONS)
  154. AUSTRIA AND
    1. SWITZERLANDNON-FUEL GRADE ALCOHOL MARKET, BY

Non-Fuel Grade Alcohol Market Segmentation

Market Segmentation Overview

  • Detailed segmentation data will be available in the full report
  • Comprehensive analysis by multiple parameters
  • Regional and country-level breakdowns
  • Market size forecasts by segment
Infographic

Free Sample Request

Kindly complete the form below to receive a free sample of this Report

Get Free Sample

Customer Strories

“I am very pleased with how market segments have been defined in a relevant way for my purposes (such as "Portable Freezers & refrigerators" and "last-mile"). In general the report is well structured. Thanks very much for your efforts.”

Victoria Milne

Founder

Compare Licence

×
Features License Type
Single User Multiuser License Enterprise User
Price $4,950 $5,950 $7,250
Maximum User Access Limit 1 User Upto 10 Users Unrestricted Access Throughout the Organization
Free Customization
Direct Access to Analyst
Deliverable Format
Platform Access
Discount on Next Purchase 10% 15% 15%
Printable Versions