×
Hero Background
English
Chinese
French
Japanese
Korean
German
Spanish

Non-Ionic Surfactants Market Trends

ID: MRFR/CnM/2549-HCR
145 Pages
Priya Nagrale
October 2025

Non-Ionic Surfactants Market Research Report Information by Type (Alcohol Ethoxylates, Fatty Alkanolamides, Amine Derivatives, Glycerol Derivatives, Alkoxylates, and Others), Application (Cleaners, Emulsifiers, Foaming Agents, Wetting Agents, Additives, and Others), End-Use Industry (Paints & Coatings, Personal Care & Cosmetics, Textiles, Agrochemicals, Household Cleaners, Food & Beverage, Oil & Gas, and Others), and Region (North America, Europe, Asia-Pacific, and Rest Of The World) – Market Forecast Till 2035

Share:
Download PDF ×

We do not share your information with anyone. However, we may send you emails based on your report interest from time to time. You may contact us at any time to opt-out.

Non-Ionic Surfactants Market Infographic
Purchase Options

Market Trends

Key Emerging Trends in the Non-Ionic Surfactants Market

The market trends of non-ionic surfactants depict a dynamic landscape influenced by various factors shaping their demand and supply dynamics. Non-ionic surfactants, widely used in industries such as personal care, household cleaning, agriculture, and pharmaceuticals, play a crucial role in enhancing the performance of various products. One notable trend in this market is the increasing consumer demand for environmentally friendly and biodegradable surfactants. With growing concerns about environmental sustainability, consumers are seeking products that minimize harm to the environment while maintaining efficacy. This trend is driving the demand for non-ionic surfactants derived from renewable sources or those with low environmental impact, prompting manufacturers to innovate and develop eco-friendly alternatives.

Moreover, the personal care industry represents a significant segment for non-ionic surfactants, particularly in products such as shampoos, body washes, and facial cleansers. As consumer awareness regarding the use of harsh chemicals in personal care products increases, there is a growing preference for mild and gentle formulations. Non-ionic surfactants, known for their mildness and compatibility with sensitive skin, are witnessing heightened demand in this sector. Additionally, the household cleaning segment relies heavily on non-ionic surfactants for their ability to effectively remove dirt, grease, and stains from various surfaces. With the increasing emphasis on cleanliness and hygiene, driven by factors such as urbanization and health consciousness, the demand for non-ionic surfactants in household cleaning products is on the rise.

Furthermore, agricultural applications present another lucrative market opportunity for non-ionic surfactants. These surfactants are commonly used in agricultural formulations such as herbicides, insecticides, and fungicides to enhance their spreadability and effectiveness. As the agricultural sector seeks to improve crop yields and reduce environmental impact, the demand for high-performance surfactants is increasing. Non-ionic surfactants play a vital role in optimizing the performance of agrochemicals while minimizing their ecological footprint, making them indispensable in modern agricultural practices.

Additionally, regulatory initiatives aimed at promoting safety and sustainability are influencing the market dynamics of non-ionic surfactants. Governments worldwide are implementing regulations to restrict the use of certain surfactants deemed harmful to human health or the environment. This regulatory environment is driving the adoption of safer and more sustainable alternatives, thereby shaping the market landscape. Manufacturers of non-ionic surfactants are investing in research and development to develop innovative formulations that meet regulatory requirements while maintaining performance.

On the supply side, the availability of raw materials for non-ionic surfactant production is a critical factor influencing market dynamics. Raw materials such as fatty alcohols and ethylene oxide are essential components in the synthesis of non-ionic surfactants. Fluctuations in the prices of these raw materials can impact the overall production costs of non-ionic surfactants, thereby affecting their market dynamics. Additionally, factors such as production capacity, technological advancements, and geographical distribution of manufacturing facilities influence the supply chain dynamics of non-ionic surfactants.

Author
Priya Nagrale
Senior Research Analyst

With an experience of over five years in market research industry (Chemicals & Materials domain), I gather and analyze market data from diverse sources to produce results, which are then presented back to a client. Also, provide recommendations based on the findings. As a Senior Research Analyst, I perform quality checks (QC) for market estimations, QC for reports, and handle queries and work extensively on client customizations. Also, handle the responsibilities of client proposals, report planning, report finalization, and execution

Leave a Comment

FAQs

In 2018, what was the valuation of the Non-Ionic Surfactants Market?

USD 24300 million was the Non-ionic surfactants market value.

What might be the CAGR of the non-ionic surfactants market during the figure time frame (2024-2035)?

Non-ionic surfactants market CAGR would be 4.50% during the estimated time frame.

What locale would rule the worldwide non-ionic surfactants market result?

The Asia Pacific district would rule the non-ionic surfactants market.

What are end-clients referenced in the non-ionic surfactants market report?

The end-clients remembered for the non-ionic surfactants market report are paints and coatings, individual consideration and beauty care products, materials, agrochemicals, family cleaners, food and drink, oil and gas, and others.

What are the applications referenced in the non-ionic surfactants market report?

The non-ionic surfactants market applications are cleaners, emulsifiers, frothing specialists, wetting specialists, added substances, and others.

Market Summary

As per Market Research Future Analysis, the non-ionic surfactants market was valued at USD 24,300 million in 2030 and is projected to grow at a CAGR of 4.50% during the forecast period. Non-ionic surfactants are preferred for their lower froth profile and strong emulsifying potential, making them suitable for various applications in industries such as food and beverage, paints and coatings, and personal care. Their effectiveness in hard water and lower skin irritation properties further enhance their appeal. The market is driven by the growth of end-use industries and the increasing demand for bio-based surfactants, despite challenges such as raw material price fluctuations and stringent environmental regulations.

Key Market Trends & Highlights

The non-ionic surfactants market is witnessing significant growth driven by various factors.

  • Market valued at USD 24,300 million in 2030; projected CAGR of 4.50%.
  • Increasing demand in personal care products like shampoos and fragrances.
  • Rising urbanization and growth in the home care sector are key growth drivers.
  • Expansion in end-use industries such as paints and coatings and agrochemicals.

Market Size & Forecast

Market Size in 2030 USD 24,300 million
Projected CAGR 4.50%
Largest Regional Market Share in 2024 Asia-Pacific
Key Growth Drivers Urbanization and end-use industry expansion.

Major Players

Key players include 3M (USA), SABIC (Saudi Arabia), Akzo Nobel NV (Netherlands), Arkema (France), BASF SE (Germany), Clariant (Switzerland), Dow (USA), Elementis plc (Great Britain), Evonik Industries AG (Germany), Huntsman International LLC (USA), Kao Corporation (Japan), and Stepan Company (USA).

Market Trends

Non-Ionic Surfactants Market Market Drivers

Market Growth Projections

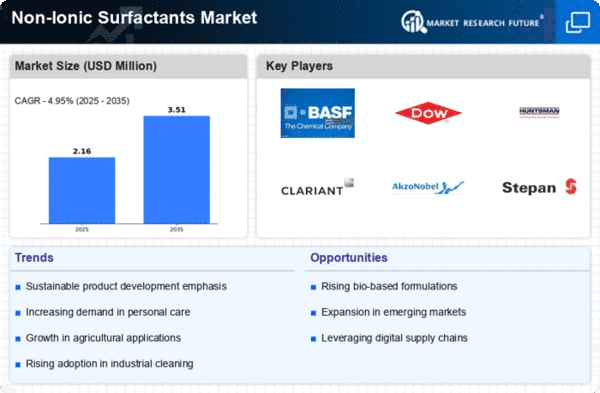
The Global Non-Ionic Surfactants Market Industry is projected to experience substantial growth over the coming years. With an expected market value of 19.6 USD Billion in 2024, the industry is on a trajectory to reach 30.3 USD Billion by 2035. This growth reflects a compound annual growth rate of 4.05% from 2025 to 2035, driven by various factors including increased demand in personal care, household products, and industrial applications. The market's expansion is indicative of the broader trends towards sustainability and innovation, as manufacturers seek to meet evolving consumer expectations and regulatory standards.

Growth in Personal Care Sector

The Global Non-Ionic Surfactants Market Industry is significantly influenced by the expanding personal care sector. Non-ionic surfactants are integral in formulating shampoos, conditioners, and skin care products due to their ability to enhance texture and stability. As the global population becomes increasingly aware of personal grooming and hygiene, the demand for high-quality personal care products rises. This trend is likely to propel the market forward, with projections suggesting that the industry could reach 30.3 USD Billion by 2035. The continuous innovation in product formulations further supports this growth, as brands seek to differentiate themselves in a competitive landscape.

Rising Demand in Household Products

The Global Non-Ionic Surfactants Market Industry experiences a notable surge in demand driven by the increasing use of non-ionic surfactants in household cleaning products. These surfactants are favored for their mildness and effectiveness in removing dirt and grease without harsh effects on surfaces or skin. As consumers become more environmentally conscious, manufacturers are reformulating products to include biodegradable non-ionic surfactants, aligning with sustainability trends. This shift is projected to contribute to the market's growth, with the industry expected to reach 19.6 USD Billion in 2024, indicating a robust consumer preference for safer cleaning solutions.

Emerging Markets and Economic Growth

The Global Non-Ionic Surfactants Market Industry is poised for expansion in emerging markets, where economic growth and urbanization drive increased consumption of consumer goods. As disposable incomes rise, consumers in these regions are more inclined to purchase personal care and household products that contain non-ionic surfactants. This trend is particularly evident in Asia-Pacific and Latin America, where the demand for quality products is escalating. The growing middle class in these regions indicates a potential for market growth, as the industry adapts to local preferences and needs, further solidifying its global presence.

Industrial Applications and Versatility

The versatility of non-ionic surfactants in various industrial applications contributes to the growth of the Global Non-Ionic Surfactants Market Industry. These surfactants are utilized in sectors such as textiles, agriculture, and oil recovery, where their emulsifying and wetting properties are essential. For instance, in the textile industry, non-ionic surfactants facilitate dyeing processes, improving color uptake and consistency. As industries seek to enhance efficiency and product quality, the demand for non-ionic surfactants is likely to increase. This trend suggests a steady growth trajectory, with a projected CAGR of 4.05% from 2025 to 2035, reflecting the ongoing reliance on these surfactants across diverse applications.

Regulatory Support for Eco-Friendly Products

The Global Non-Ionic Surfactants Market Industry benefits from increasing regulatory support aimed at promoting eco-friendly and sustainable products. Governments worldwide are implementing stringent regulations to limit the use of harmful chemicals in consumer products, thereby encouraging manufacturers to adopt non-ionic surfactants that are less toxic and more biodegradable. This regulatory landscape fosters innovation and investment in the development of sustainable surfactant alternatives. As a result, the market is likely to witness accelerated growth, as companies align their product offerings with regulatory expectations and consumer preferences for environmentally responsible solutions.

Market Segment Insights

Regional Insights

Key Companies in the Non-Ionic Surfactants Market market include

Industry Developments

    • A biosurfactant named Rhamnolipid which is renewable and biodegradable by nature was launched as a result of a partnership between Unilever and Evonik in December 2019. The distinctive quality of Rhamnolipid is that it is ultra soft for the skin. The dishwasher brand of Unilever in Chile named Quix used this surfactant initially.
    • July 2021 – a technology-driven firm manufacturing next-generation biopolymers, Integrity BioChem (IBC), disclosed the launch of a renewable line of water-based bio-based surfactants, TegraSurf. TegraSurf is developed for water treatment, agricultural, mining, energy, and other industrial applications. Developed using sustainable vegetative materials, TegraSurf enhances the carbon footprint of manufacturing, devoid of compromising product performance. The latest product works as efficiently as a synthetic surfactant and is easy to manufacture and cost-effective if produced at large scales. TegraSurf is used in the operations to decrease or substitute prominent non-ionic surfactants, such as alcohol ethoxylates and nonylphenols. The product marks a Renewable Carbon Index (RCI) of more than 90% and is licensed as a Readily Biodegradable by OECD 301B protocol. It does not remain in the atmosphere after 90 days, enabling healthier and safer conditions for nearby communities and allowing formulators to meet industry sustainability standards.The Director of Supply Chain at Liberty Oilfield Services said that TegaSurf is a product that tests a lot of boxes for the company’s sustainability efforts. They are happy to partner with IBC.
    • Logos Technologies LLC’s business Natsurfact was acquired by Stephan in March 2020, which gave birth to many Rhamnolipid-based surfactants that were derived from renewable sources.
    • Solvay introduced two new products without nonylphenol ethoxylate in its Rhodapex BR APE surfactants category in October 2019. This helped the company meet and compete in the demand for water-based emulsion & polymerized paints, textiles, and adhesives in South America, Brazil, and many other countries.
    • In October 2019, BASF SE chose to twofold the limit of alkyl polyglucoside (APG), a surfactant utilized in the individual consideration section, at Jinshan, China.

Future Outlook

Non-Ionic Surfactants Market Future Outlook

The Global Non-Ionic Surfactants Market is projected to grow at a 4.05% CAGR from 2024 to 2035, driven by increasing demand in personal care, agriculture, and industrial applications.

New opportunities lie in:

  • Develop eco-friendly non-ionic surfactants to meet sustainability demands.
  • Expand product lines for specialized applications in pharmaceuticals and agrochemicals.
  • Leverage digital marketing strategies to enhance brand visibility and customer engagement.

By 2035, the Non-Ionic Surfactants Market is expected to achieve robust growth, reflecting evolving consumer preferences and technological advancements.

Market Segmentation

Report Overview

Market Segmentation

Intended Audience
  • Non-ionic surfactants manufacturers
  • Traders and distributors of non-ionic surfactants
  • Research and development institutes
  • Potential investors
  • Raw material suppliers
  • Nationalized laboratories
Recent Developments
  • {"A biosurfactant"=>[]}
  • {"July 2021"=>[]}
  • {"Logos Technologies"=>[]}
  • {"Solvay introduced"=>[]}
  • {"In October 2019"=>[]}
Considering usages, the Non-Ionic Surfactants market from 2020 to 2025 covers:
  • Cleaners
  • Emulsion
  • Added substances
  • Others
Considering TYPE, the Non-Ionic Surfactants market from 2020 to 2025 is mainly separated into:
  • Ethoxylates
  • Oily Alkanolamides
  • Amine Derivatives
  • Glycerol Derivatives
  • Others

Report Scope

Attribute/Metric Details
  Market Size   2030: USD 24300 million
  CAGR   4.50%
  Base Year   2021
  Forecast Period   2022 to 2030
  Historical Data   2019 & 2020
  Forecast Units   Value (USD Million)
  Report Coverage   Revenue Forecast, Competitive Landscape, Growth Factors, and Trends
  Segments Covered   Type, Application and End-Use
  Geographies Covered   North America, Europe, Asia-Pacific, and Rest of the World (RoW)
  Key Vendors   3M (US), SABIC (Saudi Arabia), Akzo Nobel N.V. (Netherlands), Arkema (France), BASF SE (Germany), Clariant (Switzerland), Dow (US), Elementis plc (UK), Evonik Industries AG (Germany), Huntsman International LLC (US), Kao Corporation (Japan), and Stepan Company (US)
  Key Market Opportunities   Increasing preference towards the bio-based surfactants is expected to create lucrative opportunities
  Key Market Drivers   The extensive use of non-ionic surfactants as a wetting and dispersing agent in the manufacturing paints, inks, and varnishes is a key driver

FAQs

In 2018, what was the valuation of the Non-Ionic Surfactants Market?

USD 24300 million was the Non-ionic surfactants market value.

What might be the CAGR of the non-ionic surfactants market during the figure time frame (2024-2035)?

Non-ionic surfactants market CAGR would be 4.50% during the estimated time frame.

What locale would rule the worldwide non-ionic surfactants market result?

The Asia Pacific district would rule the non-ionic surfactants market.

What are end-clients referenced in the non-ionic surfactants market report?

The end-clients remembered for the non-ionic surfactants market report are paints and coatings, individual consideration and beauty care products, materials, agrochemicals, family cleaners, food and drink, oil and gas, and others.

What are the applications referenced in the non-ionic surfactants market report?

The non-ionic surfactants market applications are cleaners, emulsifiers, frothing specialists, wetting specialists, added substances, and others.

  1. Executive Summary
  2. Scope of the Report
    1. Market Definition
    2. Scope of the Study
      1. Research Objectives
      2. Assumptions & Limitations
    3. Market Structure
  3. Market Research
    1. Methodology
    2. Research Process
    3. Secondary Research
    4. Primary
    5. Research
    6. Forecast Model
  4. Market Landscape
    1. Supply Chain Analysis
      1. Raw Material Suppliers
      2. Manufacturers/Producers
      3. Distributors/Retailers/Wholesalers/E-Commerce
      4. End Users
    2. Porter’s Five Forces Analysis
      1. Threat
      2. Bargaining Power of Buyers
      3. Bargaining Power
      4. Threat of Substitutes
      5. Intensity of Competitive
    3. of New Entrants
    4. of Suppliers
    5. Rivalry
  5. Market Dynamics of the Global Non-Ionic Surfactants Market
    1. Introduction
    2. Drivers
    3. Restraints
    4. Opportunities
    5. Challenges
    6. Trends/Strategies
  6. Global Non-Ionic Surfactants Market,
    1. by Type
    2. Introduction
    3. Alcohol Ethoxylates
      1. Market Estimates
      2. Market Estimates & Forecast, by Region,
    4. & Forecast, 2022–2030
    5. Fatty Alkanolamides
      1. Market Estimates & Forecast,
      2. Market Estimates & Forecast, by Region, 2022–2030
    6. Amine Derivatives
      1. Market Estimates & Forecast, 2022–2030
      2. Market Estimates & Forecast, by Region, 2022–2030
    7. Glycerol
      1. Market Estimates & Forecast, 2022–2030
    8. Derivatives
  7. Market Estimates & Forecast, by Region, 2022–2030
    1. Alkoxylates
      1. Market Estimates & Forecast, 2022–2030
      2. Market Estimates
    2. & Forecast, by Region, 2022–2030
    3. Others
      1. Market Estimates
      2. Market Estimates & Forecast, by Region,
    4. & Forecast, 2022–2030
  8. Global Non-Ionic Surfactants Market, by Application
    1. Introduction
    2. Cleaners
      1. Market Estimates & Forecast, 2022–2030
      2. Market Estimates & Forecast, by Region, 2022–2030
    3. Emulsifiers
      1. Market Estimates & Forecast, 2022–2030
      2. Market Estimates
    4. & Forecast, by Region, 2022–2030
    5. Foaming Agents
      1. Market
      2. Market Estimates & Forecast,
    6. Estimates & Forecast, 2022–2030
    7. by Region, 2022–2030
    8. Wetting Agents
      1. Market Estimates &
      2. Market Estimates & Forecast, by Region,
    9. Forecast, 2022–2030
    10. Additives
      1. Market Estimates & Forecast, 2022–2030
      2. Market Estimates & Forecast, by Region, 2022–2030
    11. Others
      1. Market Estimates & Forecast, 2022–2030
      2. Market Estimates
    12. & Forecast, by Region, 2022–2030
  9. Global Non-Ionic Surfactants
  10. Market, by End-Use Industry
    1. Introduction
    2. Paints & Coatings
      1. Market Estimates & Forecast, 2022–2030
      2. Market Estimates
    3. & Forecast, by Region, 2022–2030
    4. Personal Care & Cosmetics
      1. Market Estimates & Forecast, 2022–2030
      2. Market Estimates
    5. & Forecast, by Region, 2022–2030
    6. Textiles
      1. Market Estimates
      2. Market Estimates & Forecast, by Region,
    7. & Forecast, 2022–2030
    8. Agrochemicals
      1. Market Estimates & Forecast,
      2. Market Estimates & Forecast, by Region, 2022–2030
    9. Household Cleaners
      1. Market Estimates & Forecast, 2022–2030
      2. Market Estimates & Forecast, by Region, 2022–2030
    10. Food
      1. Market Estimates & Forecast, 2022–2030
    11. & Beverage
  11. Market Estimates & Forecast, by Region, 2022–2030
    1. Oil & Gas
      1. Market Estimates & Forecast, 2022–2030
      2. Market Estimates
    2. & Forecast, by Region, 2022–2030
    3. Others
      1. Market Estimates
      2. Market Estimates & Forecast, by Region,
    4. & Forecast, 2022–2030
  12. Global Non-Ionic Surfactants Market, by Region
    1. Introduction
    2. North America
      1. Market Estimates & Forecast,
      2. Market Estimates & Forecast, by Type, 2022–2030
      3. Market Estimates & Forecast, by Application, 2022–2030
  13. Market Estimates & Forecast, by End-Use Industry, 2022–2030
    1. US
    2. Estimates & Forecast, by Type, 2022–2030
    3. & Forecast, by Application, 2022–2030
    4. Forecast, by End-Use Industry, 2022–2030
    5. Estimates & Forecast, 2022–2030
    6. by Type, 2022–2030
    7. Estimates & Forecast, by Application, 2022–2030
    8. & Forecast, by End-Use Industry, 2022–2030
    9. Market Estimates & Forecast, 2022–2030
    10. Forecast, by Type, 2022–2030
    11. by Application, 2022–2030
    12. End-Use Industry, 2022–2030
    13. & Forecast, 2022–2030
    14. Type, 2022–2030
  14. Market Estimates & Forecast, 2022–2030
  15. Market
  16. Market Estimates
  17. Market Estimates &
  18. Canada
  19. Market
  20. Market Estimates & Forecast,
  21. Market Estimates & Forecast, by Application,
  22. Market Estimates & Forecast, by End-Use Industry,
    1. Europe
      1. Market Estimates & Forecast, 2022–2030
      2. Market Estimates & Forecast, by Type, 2022–2030
      3. Market
      4. Market Estimates
      5. Germany
      6. France
      7. Italy
  23. Market Estimates & Forecast, by Application, 2022–2030
    1. Estimates & Forecast, by End-Use Industry, 2022–2030
    2. & Forecast, by Type, 2022–2030
    3. by Application, 2022–2030
    4. End-Use Industry, 2022–2030
    5. Forecast, 2022–2030
  24. Market
  25. Spain
  26. Market Estimates & Forecast, 2022–2030
  27. Market Estimates
  28. Market Estimates & Forecast,
  29. Market Estimates & Forecast, by
  30. UK
  31. Market Estimates &
  32. Market Estimates & Forecast, by Type,
  33. Market Estimates & Forecast, by Application, 2022–2030
  34. Market Estimates & Forecast, by End-Use Industry, 2022–2030
  35. Russia
  36. Market Estimates & Forecast, 2022–2030
  37. Market Estimates & Forecast, by Type, 2022–2030
  38. Market Estimates & Forecast, by Application, 2022–2030
    1. Estimates & Forecast, by End-Use Industry, 2022–2030
    2. Estimates & Forecast, by Type, 2022–2030
    3. & Forecast, by Application, 2022–2030
    4. Forecast, by End-Use Industry, 2022–2030
    5. Market Estimates & Forecast, 2022–2030
    6. & Forecast, by Type, 2022–2030
    7. by Application, 2022–2030
    8. End-Use Industry, 2022–2030
    9. & Forecast, 2022–2030
  39. Market
  40. Poland
  41. Market Estimates & Forecast, 2022–2030
  42. Market
  43. Market Estimates
  44. Market Estimates &
  45. Rest of Europe
  46. Market Estimates
  47. Market Estimates & Forecast,
  48. Market Estimates & Forecast, by
    1. Asia-Pacific
      1. Market Estimates
      2. Market Estimates & Forecast, by Type,
      3. Market Estimates & Forecast, by Application, 2022–2030
      4. Market Estimates & Forecast, by End-Use Industry, 2022–2030
      5. China
  49. Market Estimates & Forecast, by Type, 2022–2030
    1. & Forecast, by Application, 2022–2030
    2. Forecast, by End-Use Industry, 2022–2030
    3. Estimates & Forecast, 2022–2030
    4. by Type, 2022–2030
  50. Market Estimates
  51. Market Estimates &
  52. India
  53. Market
  54. Market Estimates & Forecast,
  55. Market Estimates & Forecast, by Application,
  56. Market Estimates & Forecast, by End-Use Industry,
  57. Japan
  58. Market Estimates & Forecast, 2022–2030
  59. Market Estimates & Forecast, by Type, 2022–2030
  60. Market Estimates & Forecast, by Application, 2022–2030
    1. Estimates & Forecast, by End-Use Industry, 2022–2030
    2. & New Zealand
  61. Market
  62. Australia
  63. Market Estimates & Forecast, 2022–2030
  64. Market Estimates & Forecast, by Type, 2022–2030
  65. Market Estimates & Forecast, by Application, 2022–2030
    1. Estimates & Forecast, by End-Use Industry, 2022–2030
    2. & South Korea
  66. Market
  67. Indonesia
  68. Market Estimates & Forecast, 2022–2030
  69. Market Estimates & Forecast, by Type, 2022–2030
  70. Market Estimates & Forecast, by Application, 2022–2030
    1. Estimates & Forecast, by End-Use Industry, 2022–2030
    2. of Asia-Pacific
  71. Market
  72. Rest
  73. Market Estimates & Forecast, 2022–2030
  74. Market Estimates & Forecast, by Type, 2022–2030
  75. Market Estimates & Forecast, by Application, 2022–2030
    1. Estimates & Forecast, by End-Use Industry, 2022–2030
    2. & Africa
  76. Market
    1. Middle East
      1. Market Estimates & Forecast, 2022–2030
  77. Market Estimates & Forecast, by Type, 2022–2030
    1. & Forecast, by Application, 2022–2030
    2. Forecast, by End-Use Industry, 2022–2030
    3. Estimates & Forecast, 2022–2030
    4. by Type, 2022–2030
  78. Market Estimates
  79. Market Estimates &
  80. GCC
  81. Market
  82. Market Estimates & Forecast,
  83. Market Estimates & Forecast, by Application,
  84. Market Estimates & Forecast, by End-Use Industry,
  85. Israel
  86. Market Estimates & Forecast,
  87. Market Estimates & Forecast, by Type, 2022–2030
  88. Market Estimates & Forecast, by Application, 2022–2030
  89. Market Estimates & Forecast, by End-Use Industry, 2022–2030
    1. North Africa
  90. Market Estimates & Forecast, 2022–2030
  91. Market Estimates & Forecast, by Type, 2022–2030
    1. & Forecast, by Application, 2022–2030
    2. Forecast, by End-Use Industry, 2022–2030
    3. Estimates & Forecast, 2022–2030
    4. by Type, 2022–2030
    5. Estimates & Forecast, 2022–2030
    6. by Type, 2022–2030
  92. Market Estimates
  93. Market Estimates &
  94. Turkey
  95. Market
  96. Market Estimates & Forecast,
  97. Market Estimates & Forecast, by Application,
  98. Market Estimates & Forecast, by End-Use Industry,
  99. Rest of Middle East & Africa
  100. Market
  101. Market Estimates & Forecast,
  102. Market Estimates & Forecast, by Application,
  103. Market Estimates & Forecast, by End-Use Industry,
    1. Latin America
      1. Market Estimates & Forecast,
      2. Market Estimates & Forecast, by Type, 2022–2030
      3. Market Estimates & Forecast, by Application, 2022–2030
  104. Market Estimates & Forecast, by End-Use Industry, 2022–2030
    1. Brazil
  105. Market Estimates & Forecast, 2022–2030
  106. Market Estimates & Forecast, by Type, 2022–2030
    1. & Forecast, by Application, 2022–2030
    2. Forecast, by End-Use Industry, 2022–2030
    3. Estimates & Forecast, 2022–2030
    4. by Type, 2022–2030
  107. Market Estimates
  108. Market Estimates &
  109. Mexico
  110. Market
  111. Market Estimates & Forecast,
  112. Market Estimates & Forecast, by Application,
  113. Market Estimates & Forecast, by End-Use Industry,
  114. Argentina
  115. Market Estimates & Forecast,
  116. Market Estimates & Forecast, by Type, 2022–2030
  117. Market Estimates & Forecast, by Application, 2022–2030
  118. Market Estimates & Forecast, by End-Use Industry, 2022–2030
    1. Rest of Latin America
  119. Market Estimates & Forecast, 2022–2030
  120. Market Estimates & Forecast, by Type, 2022–2030
  121. Market Estimates & Forecast, by Application, 2022–2030
    1. Estimates & Forecast, by End-Use Industry, 2022–2030
  122. Market
  123. Company
    1. Landscape
    2. Introduction
    3. Market Key Strategies
    4. Key Development
    5. Analysis
    6. (Expansions/Mergers & Acquisitions/Joint Ventures/New Application
    7. Developments/Agreements/Investments)
  124. Company Profiles
    1. 3M
      1. Financial Updates
      2. Application/Business
      3. Key Strategies
      4. Key Developments
    2. Company Overview
    3. Segment Overview
    4. SWOT Analysis
    5. SABIC
      1. Company Overview
      2. Financial
      3. Application/Business Segment Overview
      4. Key Strategies
      5. Key Developments
      6. SWOT Analysis
    6. Updates
    7. Akzo Nobel N.V.
      1. Company Overview
      2. Financial Updates
      3. Application/Business
      4. Key Strategies
      5. Key Developments
    8. Segment Overview
    9. SWOT Analysis
    10. Arkema
      1. Company Overview
      2. Financial
      3. Application/Business Segment Overview
      4. Key Strategies
      5. Key Developments
      6. SWOT Analysis
    11. Updates
    12. BASF SE
      1. Financial Updates
      2. Application/Business
      3. Key Strategies
      4. Key Developments
    13. Company Overview
    14. Segment Overview
    15. SWOT Analysis
    16. Clariant
      1. Company Overview
      2. Financial
      3. Application/Business Segment Overview
      4. Key Strategies
      5. Key Developments
      6. SWOT Analysis
    17. Updates
    18. Dow
      1. Company
      2. Financial Updates
      3. Application/Business Segment
      4. Key Strategies
      5. Key Developments
      6. SWOT
    19. Overview
    20. Overview
    21. Analysis
    22. Elementis plc
      1. Company Overview
      2. Financial
      3. Application/Business Segment Overview
      4. Key Strategies
      5. Key Developments
      6. SWOT Analysis
    23. Updates
    24. Evonik Industries
      1. Company Overview
      2. Financial Updates
      3. Application/Business
      4. Key Strategies
      5. Key Developments
    25. AG
    26. Segment Overview
    27. SWOT Analysis
    28. Huntsman International LLC
      1. Company Overview
      2. Financial Updates
      3. Application/Business Segment Overview
      4. Key Strategies
      5. Key Developments
      6. SWOT Analysis
    29. Kao Corporation
      1. Company Overview
      2. Financial Updates
      3. Application/Business Segment Overview
      4. Key Strategies
      5. SWOT Analysis
    30. Key Developments
    31. Stepan Company
      1. Financial Updates
      2. Application/Business
      3. Key Strategies
      4. Key Developments
    32. Company Overview
    33. Segment Overview
    34. SWOT Analysis
  125. Conclusion
  126. LIST OF TABLES
  127. Global
  128. Non-Ionic Surfactants Market, by Region, 2022–2030
  129. North America:
  130. Non-Ionic Surfactants Market, by Country, 2022–2030
  131. Europe: Non-Ionic
  132. Surfactants Market, by Country, 2022–2030
  133. Asia-Pacific: Non-Ionic
  134. Surfactants Market, by Country, 2022–2030
  135. Middle East & Africa:
  136. Non-Ionic Surfactants Market, by Country, 2022–2030
  137. Latin America:
  138. Non-Ionic Surfactants Market, by Country, 2022–2030
  139. Global Non-Ionic
  140. Surfactants Type Market, by Region, 2022–2030
  141. North America:
  142. Non-Ionic Surfactants Type Market, by Country, 2022–2030
  143. Europe:
  144. Non-Ionic Surfactants Type Market, by Country, 2022–2030
    1. Table10 Asia-Pacific:
  145. Non-Ionic Surfactants Type Market, by Country, 2022–2030
    1. Table11 Middle
  146. East & Africa: Non-Ionic Surfactants Type Market, by Country, 2022–2030
  147. Table13 Latin America: Non-Ionic Surfactants Type Market, by Country, 2022–2030
  148. Table13 Global Non-Ionic Surfactants Application Market, by Region, 2022–2030
  149. Table14 North America: Non-Ionic Surfactants Application Market, by Country, 2022–2030
  150. Table15 Europe: Non-Ionic Surfactants Application Market, by Country, 2022–2030
  151. Table16 Asia-Pacific: Non-Ionic Surfactants Application Market, by Country, 2022–2030
    1. Table17 Middle East & Africa: Non-Ionic Surfactants Application Market, by
    2. Country, 2022–2030
    3. Table18 Latin America: Non-Ionic Surfactants Application
  152. Market, by Country, 2022–2030
    1. Table19 Global Non-Ionic Surfactants End-Use
  153. Industry Market, by Region, 2022–2030
    1. Table20 North America: Non-Ionic
  154. Surfactants End-Use Industry Market, by Country, 2022–2030
    1. Table21 Europe:
  155. Non-Ionic Surfactants End-Use Industry Market, by Country, 2022–2030
    1. Table22
  156. Asia-Pacific: Non-Ionic Surfactants End-Use Industry Market, by Country, 2022–2030
    1. Table23 Middle East & Africa: Non-Ionic Surfactants End-Use Industry Market,
    2. by Country, 2022–2030
    3. Table24 Latin America: Non-Ionic Surfactants End-Use
  157. Industry Market, by Country, 2022–2030
    1. Table25 Global Type Market, by
    2. Region, 2022–2030
  158. Table26 Global Application Market, by Region, 2022–2030
  159. Table27 Global End-Use Industry Market, by Region, 2022–2030
    1. Table28
  160. North America: Non-Ionic Surfactants Market, by Country
    1. Table29 North America:
  161. Non-Ionic Surfactants Market, by Type
    1. Table30 North America: Non-Ionic Surfactants
  162. Market, by Application
    1. Table31 North America: Non-Ionic Surfactants Market,
    2. by End-Use Industry
  163. Table32 Europe: Non-Ionic Surfactants Market, by Country
  164. Table33 Europe: Non-Ionic Surfactants Market, by Type
    1. Table34 Europe: Non-Ionic
  165. Surfactants Market, by Application
    1. Table35 Europe: Non-Ionic Surfactants Market,
    2. by End-Use Industry
    3. Table36 Asia-Pacific: Non-Ionic Surfactants Market, by
    4. Country
  166. Table37 Asia-Pacific: Non-Ionic Surfactants Market, by Type
    1. Table38
  167. Asia-Pacific: Non-Ionic Surfactants Market, by Application
    1. Table39 Asia-Pacific:
  168. Non-Ionic Surfactants Market, by End-Use Industry
    1. Table40 Middle East &
  169. Africa: Non-Ionic Surfactants Market, by Country
    1. Table41 Middle East &
  170. Africa Non-Ionic Surfactants Market, by Type
    1. Table42 Middle East & Africa
  171. Non-Ionic Surfactants Market, by Application
    1. Table43 Middle East & Africa:
  172. Non-Ionic Surfactants Market, by End-Use Industry
    1. Table44 Latin America: Non-Ionic
  173. Surfactants Market, by Country
    1. Table45 Latin America Non-Ionic Surfactants
  174. Market, by Type
  175. Table46 Latin America Non-Ionic Surfactants Market, by Application
  176. Table47 Latin America: Non-Ionic Surfactants Market, by End-Use Industry
    1. LIST
  177. OF FIGURES
  178. Global Non-Ionic Surfactants Market Segmentation
    1. FIGURE
  179. Forecast Research Methodology
  180. Porter’s Five Forces Analysis
    1. of the Global Non-Ionic Surfactants Market
  181. Value Chain of the Global
    1. Non-Ionic Surfactants Market
  182. Share of the Global Non-Ionic Surfactants
  183. Market in 2022, by Country (%)
  184. Global Non-Ionic Surfactants Market,
  185. Global Non-Ionic Surfactants Market Size by Types,
  186. Share of the Global Non-Ionic Surfactants Market, by Type, 2022–2030
  187. Global Non-Ionic Surfactants Market Size, by Application, 2022
    1. FIGURE
  188. Share of the Global Non-Ionic Surfactants Market, by Application, 2022–2030
  189. Global Non-Ionic Surfactants Market Size, by End-Use Industry, 2022
  190. Share of the Global Non-Ionic Surfactants Market, by End-Use Industry,

Non-Ionic Surfactants Market Segmentation

Market Segmentation Overview

  • Detailed segmentation data will be available in the full report
  • Comprehensive analysis by multiple parameters
  • Regional and country-level breakdowns
  • Market size forecasts by segment
Infographic

Free Sample Request

Kindly complete the form below to receive a free sample of this Report

Get Free Sample

Customer Strories

“I am very pleased with how market segments have been defined in a relevant way for my purposes (such as "Portable Freezers & refrigerators" and "last-mile"). In general the report is well structured. Thanks very much for your efforts.”

Victoria Milne

Founder

Compare Licence

×
Features License Type
Single User Multiuser License Enterprise User
Price $4,950 $5,950 $7,250
Maximum User Access Limit 1 User Upto 10 Users Unrestricted Access Throughout the Organization
Free Customization
Direct Access to Analyst
Deliverable Format
Platform Access
Discount on Next Purchase 10% 15% 15%
Printable Versions