×
Hero Background
English
Chinese
French
Japanese
Korean
German
Spanish

Oil Shale Market Analysis

ID: MRFR/CnM/9976-HCR
128 Pages
Garvit Vyas
October 2025

Oil Shale Market Research Report Information By Process (Extraction (mining), Retorting, and Refining), By Method (In-Situ and Ex-Situ), By Product (Diesel Fuel, Gasoline Fuel, Liquid Petroleum Gas, Kerosene and Others), By End Users (Automobile Fuel, Chemical Industry, Cement Industry and Others), And By Region (North America, Europe, Asia-Pacific, Latin America and Middle East & Africa) - Forecast Till 2035

Share:
Download PDF ×

We do not share your information with anyone. However, we may send you emails based on your report interest from time to time. You may contact us at any time to opt-out.

Oil Shale Market Infographic
Purchase Options

Market Analysis

In-depth Analysis of Oil Shale Market Industry Landscape

The market dynamics of the oil shale industry are fluctuating due to the collection of interlinked economic, ecological and politic factors. Owing to their wealth in kerogen, oil shale has emerged as an important player in the world energy scenario. As an unconventional oil source is on the rise these days. Oil shale market is affected by the dynamics of the fluctuating conventional crude prices that see it as an alternative to traditional oil. During times high oil prices, it becomes more affordable for oil shale to be extracted, which in turn promotes investment and greater output. Contrarily, reduced oil prices may influence oil shale projects just as much as when they are high, resulting in yet a different market behavior.

Ecological factors are also quite deterministic when it comes to creating the petroleum shale market. The exploitation of shale oil contains uncommon techniques like fracking, that can become the source of environmental worries as a result of higher water utilization, water contamination, and seismic activity. Thus, regulatory regulations as well as sentiment of the public that is environmentally related cause currency and scale to be in need of market dynamics in the development of oil shale. It has been a challenging task for the government and the stakeholder organizations on the matter of the energy security and environmental sustainability due to the special nature of their relationships.

The new political realities not only govern the oil shale industry but also affect it in several ways. Those countries, which have plenty of oil shale in their territory, including the U.S., China and Estonia, will determine the elegance of the supply pattern that will rule across the globe. Political order, a stimulating regulatory system and involvement in international affairs influence how well oil shale projects perform and whether they will be successful ones. Besides, events on the geopolitical stage, be it the conflicts in oil-rich areas, takeovers of the international oil monopoly, or changes in an international alliance, may result in oil price changes, which don’t fail to affect the competitiveness of oil shale in the energy market.

Technologic developments as well significantly infuence the way oiskale market is doing well. Research efforts and the development of processes are continuous so that they can be environment friendly and offer better oil shale same time. Cutting edge of technologies in the field of direct extraction comprises of in-situ retorting and upgrading techniques, which may lead to the higher economic impact on oil shale projects. The pace of introduction and the extent of their usage in industry determine whether or not oil shale is competitive and attractive to investors.

Author
Garvit Vyas
Analyst

Explore the profile of Garvit Vyas, one of our esteemed authors at Market Research Future, and access their expert research contributions in the field of market research and industry analysis

Leave a Comment

FAQs

What is the projected market valuation of The Global Oil Shale by 2035?

The projected market valuation for The Global Oil Shale is 7.872 USD Billion by 2035.

What was the market valuation of The Global Oil Shale in 2024?

The overall market valuation of The Global Oil Shale was 3.675 USD Billion in 2024.

What is the expected CAGR for The Global Oil Shale during the forecast period 2025 - 2035?

The expected CAGR for The Global Oil Shale during the forecast period 2025 - 2035 is 7.17%.

Which companies are considered key players in The Global Oil Shale?

Key players in The Global Oil Shale include ExxonMobil, Royal Dutch Shell, Chevron, TotalEnergies, ConocoPhillips, BHP, EOG Resources, Pioneer Natural Resources, and Suncor Energy.

What are the main segments of The Global Oil Shale?

The main segments of The Global Oil Shale include Process, Method, Product, and End User.

What was the valuation for the Extraction segment in The Global Oil Shale in 2024?

The valuation for the Extraction segment in The Global Oil Shale was 1.5 USD Billion in 2024.

Market Summary

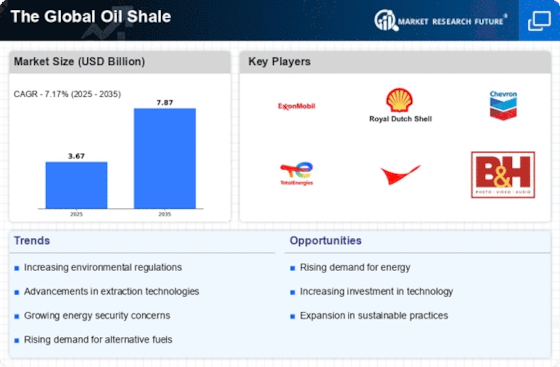
As per MRFR analysis, The Global Oil Shale Market Size was estimated at 3.675 USD Billion in 2024. The oil shale industry is projected to grow from 3.939 USD Billion in 2025 to 7.872 USD Billion by 2035, exhibiting a compound annual growth rate (CAGR) of 7.17 during the forecast period 2025 - 2035.

Key Market Trends & Highlights

The Global Oil Shale Market is poised for growth driven by technological advancements and increasing energy demands.

  • Technological advancements in extraction methods are enhancing efficiency and reducing costs in the North American market.
  • The Asia-Pacific region is experiencing rapid growth, driven by rising energy demands and a focus on energy security.
  • The extraction segment remains the largest, while the retorting segment is emerging as the fastest-growing due to innovative processing techniques.
  • Rising energy demand and supportive government policies are key drivers propelling the market forward.

Market Size & Forecast

2024 Market Size 3.675 (USD Billion)
2035 Market Size 7.872 (USD Billion)
CAGR (2025 - 2035) 7.17%
Largest Regional Market Share in 2024 North America

Major Players

<p>ExxonMobil (US), Royal Dutch Shell (GB), Chevron (US), TotalEnergies (FR), ConocoPhillips (US), BHP (AU), EOG Resources (US), Pioneer Natural Resources (US), Suncor Energy (CA)</p>

Market Trends

The Global Oil Shale Market is currently experiencing a period of transformation, driven by advancements in extraction technologies and a growing emphasis on energy security. As nations seek to diversify their energy portfolios, oil shale presents a viable alternative to conventional fossil fuels. This market appears to be gaining traction, particularly in regions rich in oil shale deposits, where governments are incentivizing exploration and production. The interplay between environmental concerns and the need for energy independence is shaping the landscape, leading to increased investment in sustainable extraction methods. Moreover, The Global Oil Shale Market is likely to witness a shift in consumer preferences, as stakeholders become more aware of the environmental implications of fossil fuel consumption. This awareness may drive innovation in cleaner extraction techniques and promote the development of oil shale as a more sustainable energy source. The market's future seems to hinge on balancing economic viability with ecological responsibility, suggesting that companies operating within this sector must adapt to evolving regulatory frameworks and public sentiment. As the world transitions towards a more sustainable energy future, the role of oil shale could become increasingly pivotal, potentially reshaping energy dynamics on a global scale.

Technological Advancements in Extraction Methods

Recent innovations in extraction technologies are enhancing the efficiency and sustainability of oil shale production. These advancements may lead to reduced environmental impacts and lower operational costs, making oil shale a more attractive option for energy generation.

Increased Focus on Energy Security

As geopolitical tensions and supply chain vulnerabilities persist, nations are prioritizing energy security. This trend is likely to drive investments in domestic oil shale resources, allowing countries to reduce dependence on foreign energy supplies.

Growing Environmental Awareness

The rising consciousness regarding climate change and environmental degradation is influencing the oil shale sector. Stakeholders are increasingly advocating for cleaner extraction practices, which could reshape industry standards and consumer expectations.

Oil Shale Market Market Drivers

Rising Energy Demand

The increasing The Global Oil Shale Industry. As populations grow and economies expand, the need for energy sources intensifies. According to recent estimates, energy consumption is projected to rise by approximately 30% by 2040. This surge in demand compels nations to explore alternative energy sources, including oil shale, which is abundant in various regions. The Oil Shale Market is likely to benefit from this trend, as countries seek to diversify their energy portfolios and reduce reliance on conventional fossil fuels. Furthermore, the strategic importance of oil shale resources may lead to increased investments in extraction technologies, thereby enhancing production capabilities and market growth.

Government Policies and Incentives

Government policies and incentives play a crucial role in shaping the Oil Shale Market. Many countries are implementing favorable regulations to promote the development of unconventional oil resources, including oil shale. For instance, tax incentives, subsidies, and research grants are being offered to companies engaged in oil shale exploration and production. These initiatives aim to stimulate investment and innovation in extraction technologies, which could lead to more efficient and environmentally friendly methods. As a result, the Oil Shale Market is likely to experience growth driven by supportive governmental frameworks that encourage sustainable energy practices and enhance energy independence.

Investment in Research and Development

Investment in research and development is a key driver for the Oil Shale Market. As the demand for cleaner and more efficient energy sources grows, companies and governments are allocating resources to innovate and improve oil shale extraction and processing methods. This focus on R&D is likely to yield breakthroughs that enhance the economic feasibility of oil shale projects. For instance, advancements in carbon capture and storage technologies could mitigate environmental concerns associated with oil shale production. Consequently, the Oil Shale Market stands to benefit from increased investment in R&D, which may lead to more sustainable practices and greater market acceptance.

Technological Innovations in Processing

Technological innovations in processing techniques are transforming the Oil Shale Market. Advances in extraction and processing technologies, such as in-situ retorting and solvent extraction, are enhancing the efficiency and economic viability of oil shale production. These innovations not only reduce operational costs but also minimize environmental impacts associated with traditional extraction methods. The market is witnessing a shift towards more sustainable practices, which could attract investment and foster growth. As companies adopt these cutting-edge technologies, the Oil Shale Market is expected to expand, providing a reliable source of energy while addressing environmental concerns.

Geopolitical Factors and Resource Accessibility

Geopolitical factors significantly influence the Oil Shale Market, particularly in regions rich in oil shale deposits. The accessibility of these resources is often affected by political stability, trade relations, and regulatory environments. Countries with abundant oil shale reserves may leverage these resources to enhance their energy security and reduce dependence on imported oil. This strategic positioning can lead to increased exploration and production activities, thereby driving market growth. Additionally, geopolitical tensions may prompt nations to invest in domestic oil shale development as a means of ensuring energy independence, further bolstering the Oil Shale Market.

Market Segment Insights

By Process: Extraction (Largest) vs. Retorting (Fastest-Growing)

<p>In The Global Oil Shale Market, the extraction segment (mining) has established itself as the largest contributor. This segment accounts for significant share due to the ongoing demand for oil production and the need for raw materials derived from oil shale. Retorting follows as the fastest-growing segment, driven by advancements in technology and increasing investments in the enhancement of retorting processes, which facilitate the transformation of oil shale into usable oil.</p>

<p>Extraction (Dominant) vs. Retorting (Emerging)</p>

<p>The extraction segment is characterized by established mining practices and techniques, leading to large-scale production capabilities. Its dominance in the market stems from the necessity of acquiring raw oil shale, which serves as the basis for oil production. On the other hand, retorting is emerging as a critical process fueled by technological enhancements and innovations. As methods improve and become more efficient, retorting is expected to capture a larger market share, reflecting the industry's pivot towards cleaner and more efficient conversion techniques, ultimately widening its application in the oil shale sector.</p>

By Method: In-Situ (Largest) vs. Ex-Situ (Fastest-Growing)

<p>In The Global Oil Shale Market, the distribution of market share between the In-Situ and Ex-Situ methods reveals a clear dominance of In-Situ techniques. In-Situ processes, characterized by their ability to minimize environmental disruption and lower operational costs, continue to hold the largest share in the market. Meanwhile, the Ex-Situ method is increasingly gaining traction, driven by advancements in processing technologies that enhance its efficiency and yield. As oil demand fluctuates, these methods present varying advantages that cater to diverse operational needs in oil shale extraction, positioning them distinctly within the market landscape.</p>

<p>Method: In-Situ (Dominant) vs. Ex-Situ (Emerging)</p>

<p>In-Situ extraction is marked by its favored efficiency and reduced environmental footprints, permitting oil recovery directly from the ground without extensive surface disturbance. This method leverages thermal processes to convert kerogen within the shale into crude oil, thus capitalizing on existing geological formations. Conversely, the Ex-Situ method is beginning to emerge rapidly, operating by mining the oil shale and processing it above ground. This method, while traditionally less popular, has seen substantial innovations that promise improved recovery rates and operational viability. The ongoing advancements suggest that Ex-Situ could complement or compete with In-Situ techniques amidst shifting market conditions.</p>

By Product: Gasoline (Largest) vs. Diesel (Fastest-Growing)

<p>In The Global Oil Shale Market, the product segmentation reveals that gasoline dominates market share, accounting for a substantial portion of oil shale production. This dominance is primarily due to the high demand for gasoline in transportation and personal vehicles across the globe. Diesel follows, representing a significant but smaller share, primarily driven by its utilities in commercial transport and logistics sectors. Kerosene and other products contribute to the market but hold lesser shares compared to gasoline and diesel. Looking into growth trends, diesel is currently the fastest-growing segment in the oil shale market, attributed to the increased usage of diesel engines in transportation and industrial activities. Factors such as environmental regulations promoting cleaner fuels and the push for energy efficiency are also propelling diesel's demand. On the other hand, gasoline remains steadfast as the market leader, although its growth is more stable compared to the rapidly expanding diesel segment.</p>

<p>Gasoline (Dominant) vs. Kerosene (Emerging)</p>

<p>Gasoline remains the dominant product in The Global Oil Shale Market due to its extensive applications and high consumer demand. It is preferred for its efficiency and availability, making it the go-to fuel for personal and commercial vehicles. As an established player, gasoline benefits from widespread infrastructure and distribution networks. On the other hand, kerosene is emerging as a relevant segment, particularly in developing regions where it is often used for heating and cooking. Its growth is supported by the increasing need for accessible energy sources in rural areas. While gasoline enjoys the status of a market leader, kerosene's market position is evolving, influenced by trends in energy consumption and environmental sustainability.</p>

By End User: Automobile Fuel (Largest) vs. Chemical Industry (Fastest-Growing)

<p>In The Global Oil Shale Market, the end user segment shows diverse applications, with automobile fuel leading as the dominant application. This segment significantly captures the market share as the demand for alternative fuels rises amidst stringent environmental regulations and the transition to cleaner energy sources. The chemical industry follows suit, leveraging oil shale for various chemical feedstocks, thereby presenting a substantial portion of the market.</p>

<p>Automobile Fuel (Dominant) vs. Chemical Industry (Emerging)</p>

<p>The automobile fuel segment remains the cornerstone of The Global Oil Shale Market, driven by an increasing preference for energy independence and sustainable fuel alternatives. This segment is characterized by its robust infrastructure for extraction and processing, gaining traction due to advances in technology enhancing oil yield from shale deposits. Conversely, the chemical industry presents an emerging opportunity, utilizing oil shale to produce essential chemicals while adapting to evolving regulations. As innovation in shale extraction and processing techniques continues to evolve, the chemical industry is expected to grow rapidly, reflecting a strategic shift towards utilizing unconventional resources.</p>

Get more detailed insights about Oil Shale Market Research Report—Global Forecast till 2035

Regional Insights

By Region, the study segments the market into North America, Europe, Asia-Pacific and Latin America and Middle East & Africa.

North America dominates the world market where the United States has significant oil shale resources, primarily within the Green River Formation in Wyoming, Utah and Colorado. According to EIA, oil shale resources underlie a total area of 16,000 square miles and represent the largest known concentration of oil shale in the world and have become the largest exporter of oil shale.

In Europe countries like Russia have a wide range of oil shale resources and are also big exporters of oil shale. According to the EIA report, Russia has a 75 billion barrels share of oil resources and is also a major exporter of oil shale after the USA.

Further, the major countries studied are The USA, Canada, Germany, France, UK, Italy, Spain, China, Japan, India, Australia, Argentina, Brazil, Mexico, South Africa and GCC countries.

Key Players and Competitive Insights

Major market players are focusing on the R&D of the oil shale to refine it so to make it more efficient fuel to use. Majorly companies are also been focused on the extraction of the oil shale from the rocks as it is not an easy process to extract and a lot of water is been polluted in the extraction. New technology in In-Situ like fracturing in which oil is converted into the ground itself and then pumped out, in this process there is no need to extract rock and crush them.

New advance technologies fracturing of rocks is done so to extract the oil more efficiently.

ExxonMobil Corporation (ExxonMobil) is an American multinational oil & gas corporation. It performs crude oil refinement, makes lube base stocks and finished lubricants, transports, trades, and sells petroleum products. Additionally, the business produces and sells a wide range of specialty goods in addition to commodity petrochemicals such olefins, aromatics, polyethylene, and polypropylene plastics. High-performance fuels and lubricant products made by ExxonMobil power global transportation, increase efficiency, and lower the entire life-cycle emissions of our clients. It runs through a network of production facilities, transit hubs, and distribution facilities.

North America, Latin America, Asia Pacific, Europe, the Middle East, and Africa are all operational regions for the company.

Chevron Corporation (Chevron) is an integrated oil & gas company. It operates along the whole value chain of the oil & gas industry, from exploration and production to storage and pipeline transportation to refining, marketing, and distribution of oil and gas products. With quality base oils as their foundation, Chevron lubricants has more than 30 years of experience producing finished lubricants. Customers on five continents rely on Chevron lubricants to deliver great, dependable performance in a variety of operating circumstances, whether they need motor oil for the family car or lubricants for heavy industrial equipment.

The company also sells petrochemicals and additives. The company searches for, produces, and transports crude oil and natural gas. It also refines, markets, and distributes transportation fuels and lubricants. In the areas where it operates, Chevron has stakes in gas-to-liquid facilities. North America, South America, Europe, Asia, the Middle East, and Africa are all operational hubs for the organization.

Key Companies in the Oil Shale Market market include

Industry Developments

  • Q3 2025: Milbank LLP is advising YPF S.A. in connection with its definitive agreement with Total Austral S.A., an affiliate of TotalEnergies, to acquire a 45% interest in Rincón La Ceniza and La Escalonada, two unconventional oil and gas blocks located in Argentina, for $500 million. YPF S.A. signed a definitive agreement to acquire a 45% stake in two unconventional oil and gas blocks in Argentina from Total Austral S.A., for $500 million, expanding its presence in the oil shale sector.
  • Q3 2025: EOG Resources today announced a definitive agreement to acquire Encino Acquisition Partners (EAP) for $5.6 billion. EOG Resources agreed to acquire Encino Acquisition Partners for $5.6 billion, adding 675,000 net acres in the Utica shale play and significantly increasing its undeveloped resource base.
  • Q3 2025: Occidental has raised $950 million through recent Permian asset sales and repaid $7.5 billion in debt since July 2024, continuing its post-CrownRock strategy to streamline operations and strengthen its balance sheet. Occidental Petroleum completed $950 million in Permian asset sales and repaid $7.5 billion in debt, as part of its ongoing strategy to optimize its shale portfolio and improve financial stability.
  • Q3 2025: Civitas Resources has sold $435 million in non-core DJ Basin assets and named Wouter van Kempen as interim CEO, aligning its portfolio strategy with leadership changes and a focus on debt reduction and shareholder value. Civitas Resources divested $435 million in non-core DJ Basin assets and appointed Wouter van Kempen as interim CEO, reflecting a strategic shift in its shale operations and leadership.
  • Q4 2024: Matterhorn Express Pipeline, which began transporting natural gas in October 2024, is expected to alleviate some bottlenecks. The Matterhorn Express Pipeline commenced operations in October 2024, increasing takeaway capacity for natural gas from the Permian Basin and addressing infrastructure bottlenecks in shale production.

Future Outlook

Oil Shale Market Future Outlook

<p>The Global Oil Shale Market is projected to grow at a 7.17% CAGR from 2024 to 2035, driven by technological advancements, increasing energy demand, and environmental considerations.</p>

New opportunities lie in:

  • <p>Investment in advanced extraction technologies to enhance yield efficiency.</p>
  • <p>Development of sustainable oil shale processing methods to reduce environmental impact.</p>
  • <p>Expansion into emerging markets with untapped oil shale reserves.</p>

<p>By 2035, the market is expected to solidify its position as a key energy source.</p>

Market Segmentation

Oil Shale Market Method Outlook

  • In-Situ
  • Ex-Situ

Oil Shale Market Process Outlook

  • Extraction (mining)
  • Retorting
  • Refining

Oil Shale Market Product Outlook

  • Gasoline
  • Diesel
  • Kerosene
  • Others

Oil Shale Market End User Outlook

  • Automobile Fuel
  • Chemical Industry
  • Cement Industry
  • Others

Report Scope

MARKET SIZE 20243.675(USD Billion)
MARKET SIZE 20253.939(USD Billion)
MARKET SIZE 20357.872(USD Billion)
COMPOUND ANNUAL GROWTH RATE (CAGR)7.17% (2024 - 2035)
REPORT COVERAGERevenue Forecast, Competitive Landscape, Growth Factors, and Trends
BASE YEAR2024
Market Forecast Period2025 - 2035
Historical Data2019 - 2024
Market Forecast UnitsUSD Billion
Key Companies ProfiledMarket analysis in progress
Segments CoveredMarket segmentation analysis in progress
Key Market OpportunitiesAdvancements in extraction technologies enhance efficiency in The Global Oil Shale.
Key Market DynamicsTechnological advancements in extraction methods are reshaping competitive dynamics within the oil shale market.
Countries CoveredNorth America, Europe, APAC, South America, MEA

FAQs

What is the projected market valuation of The Global Oil Shale by 2035?

The projected market valuation for The Global Oil Shale is 7.872 USD Billion by 2035.

What was the market valuation of The Global Oil Shale in 2024?

The overall market valuation of The Global Oil Shale was 3.675 USD Billion in 2024.

What is the expected CAGR for The Global Oil Shale during the forecast period 2025 - 2035?

The expected CAGR for The Global Oil Shale during the forecast period 2025 - 2035 is 7.17%.

Which companies are considered key players in The Global Oil Shale?

Key players in The Global Oil Shale include ExxonMobil, Royal Dutch Shell, Chevron, TotalEnergies, ConocoPhillips, BHP, EOG Resources, Pioneer Natural Resources, and Suncor Energy.

What are the main segments of The Global Oil Shale?

The main segments of The Global Oil Shale include Process, Method, Product, and End User.

What was the valuation for the Extraction segment in The Global Oil Shale in 2024?

The valuation for the Extraction segment in The Global Oil Shale was 1.5 USD Billion in 2024.

  1. SECTION I: EXECUTIVE SUMMARY AND KEY HIGHLIGHTS
    1. EXECUTIVE’S HANDBOOK
    2. The Top Performing Segments
    3. Key Trends Summarized
    4. Strategic Insights
    5. Who are the
    6. Key Players in the Market?
  2. SECTION II: SCOPING, METHODOLOGY AND MARKET
    1. STRUCTURE
  3. MARKET INTRODUCTION
    1. Definition
    2. Report Segmentation & Scope
    3. Regional & Country Level Coverage
    4. Why you need this report?
  4. RESEARCH METHODOLOGY
    1. Research
    2. Process
    3. Secondary Research
      1. Data Mining & Condensation
      2. Sample Size (Demand-Supply, Company Type, Designations,
      3. Sources
    4. Sources (Associations, Organizations, Magazines, Paid Databases)
    5. Primary Research
    6. Region)
    7. Factorial Analysis & Approach
    8. Setting
    9. Estimation & Forecast Models
    10. Pricing Baskets
    11. Analyst Hours & Team
  5. SECTION III: QUALITATIVE ANALYSIS
  6. MARKET DYNAMICS
    1. Introduction
    2. Growth Parameters Mapped
      1. Increasing energy demand from various end use industries
      2. High production
    3. - Drivers
    4. Rising technological advancements in shale oil extraction and processing
    5. What are the challenges faced by Industry Participants?
    6. cost
    7. Opportunities
      1. Vast availability of oil shale
    8. reserves
    9. Impact Analysis of COVID-19
      1. Impact on Supply
      2. Impact on Market Demand of Oil Shale
    10. Chain of Oil Shale
  7. MARKET FACTOR ANALYSIS
    1. Supply/Value Chain Analysis
      1. Value Percolation Across the Chain
      2. Key Issues Addressed
    2. Participants
    3. Integration Levels
    4. Porter’s
      1. Bargaining Power of Suppliers
      2. Threat of New Entrants
      3. Intensity of Rivalry
    5. Five Forces Model
    6. Bargaining Power of Buyers
    7. Threat of Substitutes
    8. Pricing
    9. Analysis, by region (2019-2030)
    10. Regulatory Framework
    11. Technological Advancements
  8. SECTION IV: QUANTITATIVE ANALYSIS
  9. GLOBAL OIL SHALE MARKET, BY PROCESS (USD MILLION & MILLION BARRELS)
    1. Introduction
    2. Extraction (Mining)
      1. Global Oil Shale
  10. Market Size: Market Estimates & Forecast, By Extraction (Mining), 2019-2030
    1. Retorting
    2. Forecast, By Retorting, 2019-2030
  11. Global Oil Shale Market Size: Market Estimates &
    1. Refining
      1. Global
  12. Oil Shale Market Size: Market Estimates & Forecast, By Refining, 2019-2030
  13. GLOBAL OIL SHALE MARKET, BY METHOD (USD MILLION & MILLION BARRELS)
    1. Introduction
    2. In-Situ
      1. Global Oil Shale Market Size:
  14. Market Estimates & Forecast, By In-Situ, 2019-2030
    1. Ex-Situ
  15. Global Oil Shale Market Size: Market Estimates & Forecast, By Ex-Situ, 2019-2030
  16. GLOBAL OIL SHALE MARKET, BY PRODUCT (USD MILLION & MILLION BARRELS)
    1. Introduction
    2. Diesel Fuel
      1. Global Oil Shale Market
  17. Size: Market Estimates & Forecast, By Diesel Fuel, 2019-2030
    1. Gasoline Fuel
    2. Forecast, By Gasoline Fuel, 2019-2030
  18. Global Oil Shale Market Size: Market Estimates &
    1. Liquid Petroleum Gas
  19. Global Oil Shale Market Size: Market Estimates & Forecast, By Liquid Petroleum
    1. Gas, 2019-2030
    2. Kerosene
      1. Global Oil Shale Market
  20. Size: Market Estimates & Forecast, By Kerosene, 2019-2030
    1. Others
  21. Global Oil Shale Market Size: Market Estimates & Forecast, By Others, 2019-2030
  22. GLOBAL OIL SHALE MARKET, BY END USER (USD MILLION & MILLION BARRELS)
    1. Introduction
    2. Automobile Fuel
      1. Global Oil Shale Market
  23. Size: Market Estimates & Forecast, By Automobile Fuel, 2019-2030
    1. Chemical Industry
    2. & Forecast, By Chemical Industry, 2019-2030
  24. Global Oil Shale Market Size: Market Estimates
    1. Cement Industry
  25. Global Oil Shale Market Size: Market Estimates & Forecast, By Cement Industry,
    1. Others
      1. Global Oil Shale Market Size: Market
    2. Estimates & Forecast, By Others, 2019-2030
  26. GLOBAL OIL SHALE MARKET,
    1. BY REGION (USD MILLION & MILLION BARRELS)
    2. Introduction
      1. North America Oil Shale Market Size: Market Estimates
      2. North America Oil Shale
    3. North America
    4. & Forecast, By Country, 2019-2030
  27. Market Size: Market Estimates & Forecast, By Process, 2019-2030
  28. North America Oil Shale Market Size: Market Estimates & Forecast, By Method,
    1. & Forecast, By Product, 2019-2030
  29. North America Oil Shale Market Size: Market Estimates
  30. North America Oil Shale
  31. Market Size: Market Estimates & Forecast, By End Users, 2019-2030
    1. US
    2. By Process, 2019-2030
    3. & Forecast, By Method, 2019-2030
  32. US Oil Shale Market Size: Market Estimates & Forecast,
  33. US Oil Shale Market Size: Market Estimates
  34. US Oil Shale Market Size:
  35. Market Estimates & Forecast, By Product, 2019-2030
  36. US Oil
  37. Shale Market Size: Market Estimates & Forecast, By End Users, 2019-2030
    1. Canada
    2. Forecast, By Process, 2019-2030
  38. Canada Oil Shale Market Size: Market Estimates &
  39. Canada Oil Shale Market Size:
  40. Market Estimates & Forecast, By Method, 2019-2030
  41. Canada
  42. Oil Shale Market Size: Market Estimates & Forecast, By Product, 2019-2030
  43. Canada Oil Shale Market Size: Market Estimates & Forecast, By End Users, 2019-2030
    1. Mexico
    2. Forecast, By Process, 2019-2030
  44. Mexico Oil Shale Market Size: Market Estimates &
  45. Mexico Oil Shale Market Size:
  46. Market Estimates & Forecast, By Method, 2019-2030
  47. Mexico
  48. Oil Shale Market Size: Market Estimates & Forecast, By Product, 2019-2030
  49. Mexico Oil Shale Market Size: Market Estimates & Forecast, By End Users, 2019-2030
    1. Europe
    2. By Country, 2019-2030
    3. & Forecast, By Process, 2019-2030
  50. Europe Oil Shale Market Size: Market Estimates & Forecast,
  51. Europe Oil Shale Market Size: Market Estimates
  52. Europe Oil Shale Market
  53. Size: Market Estimates & Forecast, By Method, 2019-2030
  54. Europe
  55. Oil Shale Market Size: Market Estimates & Forecast, By Product, 2019-2030
  56. Europe Oil Shale Market Size: Market Estimates & Forecast, By End Users, 2019-2030
    1. Germany
    2. Forecast, By Process, 2019-2030
  57. Germany Oil Shale Market Size: Market Estimates &
  58. Germany Oil Shale Market Size:
  59. Market Estimates & Forecast, By Method, 2019-2030
  60. Germany
  61. Oil Shale Market Size: Market Estimates & Forecast, By Product, 2019-2030
  62. Germany Oil Shale Market Size: Market Estimates & Forecast, By End Users, 2019-2030
    1. France
    2. Forecast, By Process, 2019-2030
  63. France Oil Shale Market Size: Market Estimates &
  64. France Oil Shale Market Size:
  65. Market Estimates & Forecast, By Method, 2019-2030
  66. France
  67. Oil Shale Market Size: Market Estimates & Forecast, By Product, 2019-2030
  68. France Oil Shale Market Size: Market Estimates & Forecast, By End Users, 2019-2030
    1. UK
    2. By Process, 2019-2030
    3. & Forecast, By Method, 2019-2030
  69. UK Oil Shale Market Size: Market Estimates & Forecast,
  70. UK Oil Shale Market Size: Market Estimates
  71. UK Oil Shale Market Size:
  72. Market Estimates & Forecast, By Product, 2019-2030
  73. UK Oil
  74. Shale Market Size: Market Estimates & Forecast, By End Users, 2019-2030
    1. Italy
    2. By Process, 2019-2030
    3. & Forecast, By Method, 2019-2030
  75. Italy Oil Shale Market Size: Market Estimates & Forecast,
  76. Italy Oil Shale Market Size: Market Estimates
  77. Italy Oil Shale Market
  78. Size: Market Estimates & Forecast, By Product, 2019-2030
  79. Italy Oil Shale Market Size: Market Estimates & Forecast, By End Users, 2019-2030
    1. Spain
    2. By Process, 2019-2030
    3. & Forecast, By Method, 2019-2030
  80. Spain Oil Shale Market Size: Market Estimates & Forecast,
  81. Spain Oil Shale Market Size: Market Estimates
  82. Spain Oil Shale Market
  83. Size: Market Estimates & Forecast, By Product, 2019-2030
  84. Spain Oil Shale Market Size: Market Estimates & Forecast, By End Users, 2019-2030
    1. Rest of Europe
    2. Estimates & Forecast, By Process, 2019-2030
  85. Rest of Europe Oil Shale Market Size: Market
  86. Rest of Europe
  87. Oil Shale Market Size: Market Estimates & Forecast, By Method, 2019-2030
  88. Rest of Europe Oil Shale Market Size: Market Estimates & Forecast, By Product,
    1. & Forecast, By End Users, 2019-2030
  89. Rest of Europe Oil Shale Market Size: Market Estimates
    1. Asia-Pacific
  90. Asia-Pacific Oil Shale Market Size: Market Estimates & Forecast, By Country,
    1. & Forecast, By Process, 2019-2030
  91. Asia-Pacific Oil Shale Market Size: Market Estimates
  92. Asia-Pacific Oil Shale Market
  93. Size: Market Estimates & Forecast, By Method, 2019-2030
  94. Asia-Pacific
  95. Oil Shale Market Size: Market Estimates & Forecast, By Product, 2019-2030
  96. Asia-Pacific Oil Shale Market Size: Market Estimates & Forecast, By End Users,
  97. China
  98. China Oil Shale Market Size:
  99. Market Estimates & Forecast, By Process, 2019-2030
  100. China
  101. Oil Shale Market Size: Market Estimates & Forecast, By Method, 2019-2030
  102. China Oil Shale Market Size: Market Estimates & Forecast, By Product, 2019-2030
  103. China Oil Shale Market Size: Market Estimates & Forecast, By End Users, 2019-2030
    1. India
    2. By Process, 2019-2030
    3. & Forecast, By Method, 2019-2030
  104. India Oil Shale Market Size: Market Estimates & Forecast,
  105. India Oil Shale Market Size: Market Estimates
  106. India Oil Shale Market
  107. Size: Market Estimates & Forecast, By Product, 2019-2030
  108. India Oil Shale Market Size: Market Estimates & Forecast, By End Users, 2019-2030
    1. Japan
    2. By Process, 2019-2030
    3. & Forecast, By Method, 2019-2030
  109. Japan Oil Shale Market Size: Market Estimates & Forecast,
  110. Japan Oil Shale Market Size: Market Estimates
  111. Japan Oil Shale Market
  112. Size: Market Estimates & Forecast, By Product, 2019-2030
  113. Japan Oil Shale Market Size: Market Estimates & Forecast, By End Users, 2019-2030
    1. South Korea
    2. & Forecast, By Process, 2019-2030
  114. South Korea Oil Shale Market Size: Market Estimates
  115. South Korea Oil Shale
  116. Market Size: Market Estimates & Forecast, By Method, 2019-2030
  117. South Korea Oil Shale Market Size: Market Estimates & Forecast, By Product,
    1. & Forecast, By End Users, 2019-2030
    2. Rest of Asia-Pacific Oil Shale Market Size: Market Estimates & Forecast, By
    3. Process, 2019-2030
  118. South Korea Oil Shale Market Size: Market Estimates
  119. Rest of Asia-Pacific
  120. Rest of Asia-Pacific Oil Shale Market Size:
  121. Market Estimates & Forecast, By Method, 2019-2030
  122. Rest
  123. of Asia-Pacific Oil Shale Market Size: Market Estimates & Forecast, By Product,
    1. Estimates & Forecast, By End Users, 2019-2030
    2. Latin America Automotive Glass Market Size: Market Estimates & Forecast, By
    3. Country, 2019-2030
    4. Estimates & Forecast, By Process, 2019-2030
  124. Rest of Asia-Pacific Oil Shale Market Size: Market
    1. Latin America
      1. Latin America Oil Shale Market Size: Market
      2. Latin America
  125. Oil Shale Market Size: Market Estimates & Forecast, By Method, 2019-2030
  126. Latin America Oil Shale Market Size: Market Estimates & Forecast, By Product,
    1. & Forecast, By End Users, 2019-2030
  127. Latin America Oil Shale Market Size: Market Estimates
  128. Argentina
  129. Argentina Oil Shale Market Size: Market Estimates & Forecast, By Process, 2019-2030
  130. Argentina Oil Shale Market Size: Market Estimates & Forecast, By Method, 2019-2030
  131. Argentina Oil Shale Market Size: Market Estimates & Forecast, By Product, 2019-2030
  132. Argentina Oil Shale Market Size: Market Estimates & Forecast, By End Users,
  133. Brazil
  134. Brazil Oil Shale Market Size:
  135. Market Estimates & Forecast, By Process, 2019-2030
  136. Brazil
  137. Oil Shale Market Size: Market Estimates & Forecast, By Method, 2019-2030
  138. Brazil Oil Shale Market Size: Market Estimates & Forecast, By Product, 2019-2030
  139. Brazil Oil Shale Market Size: Market Estimates & Forecast, By End Users, 2019-2030
    1. Rest of Latin America
  140. Rest of Latin America Oil Shale Market
  141. Size: Market Estimates & Forecast, By Process, 2019-2030
    1. Rest of Latin America Oil Shale Market Size: Market Estimates & Forecast, By
    2. Method, 2019-2030
  142. Rest of Latin America Oil Shale Market Size:
  143. Market Estimates & Forecast, By Product, 2019-2030
  144. Rest
  145. of Latin America Oil Shale Market Size: Market Estimates & Forecast, By End
    1. Users, 2019-2030
    2. Middle East & Africa
      1. Middle
      2. Middle East & Africa Oil Shale Market
    3. East & Africa Automotive Glass Market Size: Market Estimates & Forecast,
    4. By Country, 2019-2030
  146. Size: Market Estimates & Forecast, By Process, 2019-2030
  147. Middle
  148. East & Africa Oil Shale Market Size: Market Estimates & Forecast, By Method,
    1. Estimates & Forecast, By Product, 2019-2030
  149. Middle East & Africa Oil Shale Market Size: Market
  150. Middle East &
  151. Africa Oil Shale Market Size: Market Estimates & Forecast, By End Users, 2019-2030
    1. South Africa
    2. & Forecast, By Process, 2019-2030
  152. South Africa Oil Shale Market Size: Market Estimates
  153. South Africa Oil Shale
  154. Market Size: Market Estimates & Forecast, By Method, 2019-2030
  155. South Africa Oil Shale Market Size: Market Estimates & Forecast, By Product,
    1. & Forecast, By End Users, 2019-2030
  156. South Africa Oil Shale Market Size: Market Estimates
  157. GCC Countries
  158. GCC Countries Oil Shale Market Size: Market Estimates & Forecast, By Process,
    1. & Forecast, By Method, 2019-2030
  159. GCC Countries Oil Shale Market Size: Market Estimates
  160. GCC Countries Oil Shale
  161. Market Size: Market Estimates & Forecast, By Product, 2019-2030
  162. GCC Countries Oil Shale Market Size: Market Estimates & Forecast, By End Users,
    1. Rest of Middle East & Africa Oil Shale Market Size: Market Estimates & Forecast,
    2. By Process, 2019-2030
  163. Rest of Middle East & Africa
  164. Rest of Middle East & Africa Oil Shale
  165. Market Size: Market Estimates & Forecast, By Method, 2019-2030
    1. Rest of Middle East & Africa Oil Shale Market Size: Market Estimates & Forecast,
    2. By Product, 2019-2030
  166. Rest of Middle East & Africa Oil Shale
  167. Market Size: Market Estimates & Forecast, By End Users, 2019-2030
    1. SECTION
    2. V: COMPETITIVE ANALYSIS
  168. COMPETITIVE LANDSCAPE
    1. Introduction
    2. Competition Dashboard
    3. Company Market Share Analysis, 2022 (%)
    4. Competitive Benchmarking
    5. The Leading Player in terms of Number of
    6. Developments in the Global Oil Shale Market
    7. List of Key Players,
    8. By Region
    9. Comparative Analysis: Key Players Financial
      1. New Product Launch/Service
      2. Merger & Acquisition
      3. Joint Ventures
    10. Key Developments & Growth Strategies
    11. Deployment
    12. COMPANY PROFILES
    13. American Shale Oil
      1. Company Overview
      2. Product Offered
      3. Key Developments
      4. Key Strategies
    14. Financial Overview
    15. SWOT Analysis
    16. Aura Source Inc.
    17. Blue Ensign Technologies Ltd
    18. Chevron Corporation
    19. Electro-Petroleum Inc.
    20. Exxon Mobil Corporation
    21. Occidental
    22. Petroleum Corporation
    23. Chesapeake
    24. MARATHON OIL COMPANY
    25. CotCabot Oil & Gas Corporation
    26. Halliburton Energy Services
    27. RECOMMENDATIONS & EXPERT INSIGHTS
    28. What is the short-term vs
    29. long-term outlook for Oil Shale Market?
    30. Who are the players to look
    31. out for?
    32. What will the product mix look in coming years?
    33. MRFR OFFERINGS & TEAM
    34. Citations & Media
    35. Our Regional Representatives
    36. Related Reports
    37. Our
    38. Domain Coverage
  169. LIST OF TABLES
  170. LIST
  171. OF ASSUMPTIONS
  172. OIL SHALE MARKET ESTIMATES & FORECAST, BY
    1. PROCESS, 2019-2030 (USD MILLION)
  173. OIL SHALE MARKET ESTIMATES &
    1. FORECAST, BY PROCESS, 2019-2030 (MILLION BARRELS)
  174. OIL SHALE MARKET
    1. ESTIMATES & FORECAST, BY METHOD, 2019-2030 (USD MILLION)
    2. TABLE 5.
  175. OIL SHALE MARKET ESTIMATES & FORECAST, BY METHOD, 2019-2030 (MILLION BARRELS)
    1. TABLE
  176. OIL SHALE MARKET ESTIMATES & FORECAST, BY PRODUCT, 2019-2030 (USD MILLION)
    1. TABLE
  177. OIL SHALE MARKET ESTIMATES & FORECAST, BY PRODUCT, 2019-2030 (MILLION BARRELS)
    1. TABLE
  178. OIL SHALE MARKET ESTIMATES & FORECAST, BY END USERS, 2019-2030 (USD MILLION)
    1. TABLE
  179. OIL SHALE MARKET ESTIMATES & FORECAST, BY END USERS, 2019-2030 (MILLION BARRELS)
    1. TABLE
  180. GLOBAL OIL SHALE MARKET, BY REGION, 2019-2030 (USD MILLION)
    1. TABLE
  181. NORTH AMERICA: OIL SHALE MARKET, BY COUNTRY, 2019-2030 (USD MILLION)
    1. TABLE
  182. NORTH AMERICA: OIL SHALE MARKET, BY COUNTRY, 2019-2030 (MILLION BARRELS)
    1. TABLE
  183. NORTH AMERICA: OIL SHALE MARKET, BY PROCESS, 2019-2030 (USD MILLION)
    1. TABLE
  184. NORTH AMERICA: OIL SHALE MARKET, BY PROCESS, 2019-2030 (MILLION BARRELS)
    1. TABLE
  185. NORTH AMERICA: OIL SHALE MARKET, BY METHOD, 2019-2030 (USD MILLION)
    1. TABLE
  186. NORTH AMERICA: OIL SHALE MARKET, BY METHOD, 2019-2030 (MILLION BARRELS)
    1. TABLE
  187. NORTH AMERICA: OIL SHALE MARKET, BY PRODUCT, 2019-2030 (USD MILLION)
    1. TABLE
  188. NORTH AMERICA: OIL SHALE MARKET, BY PRODUCT, 2019-2030 (MILLION BARRELS)
    1. TABLE
  189. NORTH AMERICA: OIL SHALE MARKET, BY END USER, 2019-2030 (USD MILLION)
    1. TABLE
  190. NORTH AMERICA: OIL SHALE MARKET, BY END USER, 2019-2030 (MILLION BARRELS)
    1. TABLE
  191. US: OIL SHALE MARKET, BY PROCESS, 2019-2030 (USD MILLION)
    1. TABLE 22.
  192. US: OIL SHALE MARKET, BY PROCESS, 2019-2030 (MILLION BARRELS)
    1. TABLE 23.
  193. US: OIL SHALE MARKET, BY METHOD, 2019-2030 (USD MILLION)
  194. US:
  195. OIL SHALE MARKET, BY METHOD, 2019-2030 (MILLION BARRELS)
  196. US:
  197. OIL SHALE MARKET, BY PRODUCT, 2019-2030 (USD MILLION)
  198. US: OIL
  199. SHALE MARKET, BY PRODUCT, 2019-2030 (MILLION BARRELS)
  200. US: OIL
  201. SHALE MARKET, BY END USER, 2019-2030 (USD MILLION)
  202. US: OIL SHALE
  203. MARKET, BY END USER, 2019-2030 (MILLION BARRELS)
  204. CANADA: OIL
  205. SHALE MARKET, BY PROCESS, 2019-2030 (USD MILLION)
  206. CANADA: OIL
  207. SHALE MARKET, BY PROCESS, 2019-2030 (MILLION BARRELS)
  208. CANADA:
  209. OIL SHALE MARKET, BY METHOD, 2019-2030 (USD MILLION)
  210. CANADA:
  211. OIL SHALE MARKET, BY METHOD, 2019-2030 (MILLION BARRELS)
  212. CANADA:
  213. OIL SHALE MARKET, BY PRODUCT, 2019-2030 (USD MILLION)
  214. CANADA:
  215. OIL SHALE MARKET, BY PRODUCT, 2019-2030 (MILLION BARRELS)
  216. CANADA:
  217. OIL SHALE MARKET, BY END USER, 2019-2030 (USD MILLION)
  218. CANADA:
  219. OIL SHALE MARKET, BY END USER, 2019-2030 (MILLION BARRELS)
  220. MEXICO:
  221. OIL SHALE MARKET, BY PROCESS, 2019-2030 (USD MILLION)
  222. MEXICO:
  223. OIL SHALE MARKET, BY PROCESS, 2019-2030 (MILLION BARRELS)
  224. MEXICO:
  225. OIL SHALE MARKET, BY METHOD, 2019-2030 (USD MILLION)
  226. MEXICO:
  227. OIL SHALE MARKET, BY METHOD, 2019-2030 (MILLION BARRELS)
  228. MEXICO:
  229. OIL SHALE MARKET, BY PRODUCT, 2019-2030 (USD MILLION)
  230. MEXICO:
  231. OIL SHALE MARKET, BY PRODUCT, 2019-2030 (MILLION BARRELS)
  232. MEXICO:
  233. OIL SHALE MARKET, BY END USER, 2019-2030 (USD MILLION)
  234. MEXICO:
  235. OIL SHALE MARKET, BY END USER, 2019-2030 (MILLION BARRELS)
  236. EUROPE:
  237. OIL SHALE MARKET, BY COUNTRY, 2019-2030 (USD MILLION)
  238. EUROPE:
  239. OIL SHALE MARKET, BY COUNTRY, 2019-2030 (MILLION BARRELS)
  240. EUROPE:
  241. OIL SHALE MARKET, BY PROCESS, 2019-2030 (USD MILLION)
  242. EUROPE:
  243. OIL SHALE MARKET, BY PROCESS, 2019-2030 (MILLION BARRELS)
  244. EUROPE:
  245. OIL SHALE MARKET, BY METHOD, 2019-2030 (USD MILLION)
  246. EUROPE:
  247. OIL SHALE MARKET, BY METHOD, 2019-2030 (MILLION BARRELS)
  248. EUROPE:
  249. OIL SHALE MARKET, BY PRODUCT, 2019-2030 (USD MILLION)
  250. EUROPE:
  251. OIL SHALE MARKET, BY PRODUCT, 2019-2030 (MILLION BARRELS)
  252. EUROPE:
  253. OIL SHALE MARKET, BY END USER, 2019-2030 (USD MILLION)
  254. EUROPE:
  255. OIL SHALE MARKET, BY END USER, 2019-2030 (MILLION BARRELS)
  256. GERMANY:
  257. OIL SHALE MARKET, BY PROCESS, 2019-2030 (USD MILLION)
  258. GERMANY:
  259. OIL SHALE MARKET, BY PROCESS, 2019-2030 (MILLION BARRELS)
  260. GERMANY:
  261. OIL SHALE MARKET, BY METHOD, 2019-2030 (USD MILLION)
  262. GERMANY:
  263. OIL SHALE MARKET, BY METHOD, 2019-2030 (MILLION BARRELS)
  264. GERMANY:
  265. OIL SHALE MARKET, BY PRODUCT, 2019-2030 (USD MILLION)
  266. GERMANY:
  267. OIL SHALE MARKET, BY PRODUCT, 2019-2030 (MILLION BARRELS)
  268. GERMANY:
  269. OIL SHALE MARKET, BY END USER, 2019-2030 (USD MILLION)
  270. GERMANY:
  271. OIL SHALE MARKET, BY END USER, 2019-2030 (MILLION BARRELS)
  272. FRANCE:
  273. OIL SHALE MARKET, BY PROCESS, 2019-2030 (USD MILLION)
  274. FRANCE:
  275. OIL SHALE MARKET, BY PROCESS, 2019-2030 (MILLION BARRELS)
  276. FRANCE:
  277. OIL SHALE MARKET, BY METHOD, 2019-2030 (USD MILLION)
  278. FRANCE:
  279. OIL SHALE MARKET, BY METHOD, 2019-2030 (MILLION BARRELS)
  280. FRANCE:
  281. OIL SHALE MARKET, BY PRODUCT, 2019-2030 (USD MILLION)
  282. FRANCE:
  283. OIL SHALE MARKET, BY PRODUCT, 2019-2030 (MILLION BARRELS)
  284. FRANCE:
  285. OIL SHALE MARKET, BY END USER, 2019-2030 (USD MILLION)
  286. FRANCE:
  287. OIL SHALE MARKET, BY END USER, 2019-2030 (MILLION BARRELS)
  288. UK:
  289. OIL SHALE MARKET, BY PROCESS, 2019-2030 (USD MILLION)
  290. UK: OIL
  291. SHALE MARKET, BY PROCESS, 2019-2030 (MILLION BARRELS)
  292. UK: OIL
  293. SHALE MARKET, BY METHOD, 2019-2030 (USD MILLION)
  294. UK: OIL SHALE
  295. MARKET, BY METHOD, 2019-2030 (MILLION BARRELS)
  296. UK: OIL SHALE
  297. MARKET, BY PRODUCT, 2019-2030 (USD MILLION)
  298. UK: OIL SHALE MARKET,
    1. BY PRODUCT, 2019-2030 (MILLION BARRELS)
  299. UK: OIL SHALE MARKET,
    1. BY END USER, 2019-2030 (USD MILLION)
  300. UK: OIL SHALE MARKET, BY
    1. END USER, 2019-2030 (MILLION BARRELS)
  301. ITALY: OIL SHALE MARKET,
    1. BY PROCESS, 2019-2030 (USD MILLION)
  302. ITALY: OIL SHALE MARKET,
    1. BY PROCESS, 2019-2030 (MILLION BARRELS)
  303. ITALY: OIL SHALE MARKET,
    1. BY METHOD, 2019-2030 (USD MILLION)
  304. ITALY: OIL SHALE MARKET,
    1. BY METHOD, 2019-2030 (MILLION BARRELS)
  305. ITALY: OIL SHALE MARKET,
    1. BY PRODUCT, 2019-2030 (USD MILLION)
  306. ITALY: OIL SHALE MARKET,
    1. BY PRODUCT, 2019-2030 (MILLION BARRELS)
  307. ITALY: OIL SHALE MARKET,
    1. BY END USER, 2019-2030 (USD MILLION)
  308. ITALY: OIL SHALE MARKET,
    1. BY END USER, 2019-2030 (MILLION BARRELS)
  309. SPAIN: OIL SHALE MARKET,
    1. BY PROCESS, 2019-2030 (USD MILLION)
  310. SPAIN: OIL SHALE MARKET,
    1. BY PROCESS, 2019-2030 (MILLION BARRELS)
  311. SPAIN: OIL SHALE MARKET,
    1. BY METHOD, 2019-2030 (USD MILLION)
  312. SPAIN: OIL SHALE MARKET,
    1. BY METHOD, 2019-2030 (MILLION BARRELS)
  313. SPAIN: OIL SHALE MARKET,
    1. BY PRODUCT, 2019-2030 (USD MILLION)
  314. SPAIN: OIL SHALE MARKET,
    1. BY PRODUCT, 2019-2030 (MILLION BARRELS)
  315. SPAIN: OIL SHALE MARKET,
    1. BY END USER, 2019-2030 (USD MILLION)
  316. SPAIN: OIL SHALE MARKET,
    1. BY END USER, 2019-2030 (MILLION BARRELS)
  317. REST OF EUROPE: OIL
  318. SHALE MARKET, BY PROCESS, 2019-2030 (USD MILLION)
  319. REST OF EUROPE:
  320. OIL SHALE MARKET, BY PROCESS, 2019-2030 (MILLION BARRELS)
  321. REST
  322. OF EUROPE: OIL SHALE MARKET, BY METHOD, 2019-2030 (USD MILLION)
    1. TABLE
  323. REST OF EUROPE: OIL SHALE MARKET, BY METHOD, 2019-2030 (MILLION BARRELS)
    1. TABLE
  324. REST OF EUROPE: OIL SHALE MARKET, BY PRODUCT, 2019-2030 (USD MILLION)
    1. TABLE
  325. REST OF EUROPE: OIL SHALE MARKET, BY PRODUCT, 2019-2030 (MILLION BARRELS)
    1. TABLE
  326. REST OF EUROPE: OIL SHALE MARKET, BY END USER, 2019-2030 (USD MILLION)
    1. TABLE
  327. REST OF EUROPE: OIL SHALE MARKET, BY END USER, 2019-2030 (MILLION BARRELS)
    1. TABLE
  328. ASIA PACIFIC: OIL SHALE MARKET, BY COUNTRY, 2019-2030 (USD MILLION)
    1. TABLE
  329. ASIA PACIFIC: OIL SHALE MARKET, BY COUNTRY, 2019-2030 (MILLION BARRELS)
    1. TABLE
  330. ASIA PACIFIC: OIL SHALE MARKET, BY PROCESS, 2019-2030 (USD MILLION)
    1. TABLE
  331. ASIA PACIFIC: OIL SHALE MARKET, BY PROCESS, 2019-2030 (MILLION BARRELS)
    1. TABLE
  332. ASIA PACIFIC: OIL SHALE MARKET, BY METHOD, 2019-2030 (USD MILLION)
    1. TABLE
  333. ASIA PACIFIC: OIL SHALE MARKET, BY METHOD, 2019-2030 (MILLION BARRELS)
    1. TABLE
  334. ASIA PACIFIC: OIL SHALE MARKET, BY PRODUCT, 2019-2030 (USD MILLION)
    1. TABLE
  335. ASIA PACIFIC: OIL SHALE MARKET, BY PRODUCT, 2019-2030 (MILLION BARRELS)
    1. TABLE
  336. ASIA PACIFIC: OIL SHALE MARKET, BY END USER, 2019-2030 (USD MILLION)
    1. TABLE
  337. ASIA PACIFIC: OIL SHALE MARKET, BY END USER, 2019-2030 (MILLION BARRELS)
    1. TABLE
  338. CHINA: OIL SHALE MARKET, BY PROCESS, 2019-2030 (USD MILLION)
    1. TABLE
  339. CHINA: OIL SHALE MARKET, BY PROCESS, 2019-2030 (MILLION BARRELS)
    1. TABLE
  340. CHINA: OIL SHALE MARKET, BY METHOD, 2019-2030 (USD MILLION)
    1. TABLE
  341. CHINA: OIL SHALE MARKET, BY METHOD, 2019-2030 (MILLION BARRELS)
    1. TABLE
  342. CHINA: OIL SHALE MARKET, BY PRODUCT, 2019-2030 (USD MILLION)
    1. TABLE
  343. CHINA: OIL SHALE MARKET, BY PRODUCT, 2019-2030 (MILLION BARRELS)
    1. TABLE
  344. CHINA: OIL SHALE MARKET, BY END USER, 2019-2030 (USD MILLION)
    1. TABLE
  345. CHINA: OIL SHALE MARKET, BY END USER, 2019-2030 (MILLION BARRELS)
    1. TABLE
  346. JAPAN: OIL SHALE MARKET, BY PROCESS, 2019-2030 (USD MILLION)
    1. TABLE
  347. JAPAN: OIL SHALE MARKET, BY PROCESS, 2019-2030 (MILLION BARRELS)
    1. TABLE
  348. JAPAN: OIL SHALE MARKET, BY METHOD, 2019-2030 (USD MILLION)
    1. TABLE
  349. JAPAN: OIL SHALE MARKET, BY METHOD, 2019-2030 (MILLION BARRELS)
    1. TABLE
  350. JAPAN: OIL SHALE MARKET, BY PRODUCT, 2019-2030 (USD MILLION)
    1. TABLE
  351. JAPAN: OIL SHALE MARKET, BY PRODUCT, 2019-2030 (MILLION BARRELS)
    1. TABLE
  352. JAPAN: OIL SHALE MARKET, BY END USER, 2019-2030 (USD MILLION)
    1. TABLE
  353. JAPAN: OIL SHALE MARKET, BY END USER, 2019-2030 (MILLION BARRELS)
    1. TABLE
  354. INDIA: OIL SHALE MARKET, BY PROCESS, 2019-2030 (USD MILLION)
    1. TABLE
  355. INDIA: OIL SHALE MARKET, BY PROCESS, 2019-2030 (MILLION BARRELS)
    1. TABLE
  356. INDIA: OIL SHALE MARKET, BY METHOD, 2019-2030 (USD MILLION)
    1. TABLE
  357. INDIA: OIL SHALE MARKET, BY METHOD, 2019-2030 (MILLION BARRELS)
    1. TABLE
  358. INDIA: OIL SHALE MARKET, BY PRODUCT, 2019-2030 (USD MILLION)
    1. TABLE
  359. INDIA: OIL SHALE MARKET, BY PRODUCT, 2019-2030 (MILLION BARRELS)
    1. TABLE
  360. INDIA: OIL SHALE MARKET, BY END USER, 2019-2030 (USD MILLION)
    1. TABLE
  361. INDIA: OIL SHALE MARKET, BY END USER, 2019-2030 (MILLION BARRELS)
    1. TABLE
  362. SOUTH KOREA: OIL SHALE MARKET, BY PROCESS, 2019-2030 (USD MILLION)
    1. TABLE
  363. SOUTH KOREA: OIL SHALE MARKET, BY PROCESS, 2019-2030 (MILLION BARRELS)
    1. TABLE
  364. SOUTH KOREA: OIL SHALE MARKET, BY METHOD, 2019-2030 (USD MILLION)
    1. TABLE
  365. SOUTH KOREA: OIL SHALE MARKET, BY METHOD, 2019-2030 (MILLION BARRELS)
    1. TABLE
  366. SOUTH KOREA: OIL SHALE MARKET, BY PRODUCT, 2019-2030 (USD MILLION)
    1. TABLE
  367. SOUTH KOREA: OIL SHALE MARKET, BY PRODUCT, 2019-2030 (MILLION BARRELS)
    1. TABLE
  368. SOUTH KOREA: OIL SHALE MARKET, BY END USER, 2019-2030 (USD MILLION)
    1. TABLE
  369. SOUTH KOREA: OIL SHALE MARKET, BY END USER, 2019-2030 (MILLION BARRELS)
    1. TABLE
  370. REST OF ASIA PACIFIC: OIL SHALE MARKET, BY PROCESS, 2019-2030 (USD MILLION)
    1. TABLE
  371. REST OF ASIA PACIFIC: OIL SHALE MARKET, BY PROCESS, 2019-2030 (MILLION BARRELS)
    1. TABLE
  372. REST OF ASIA PACIFIC: OIL SHALE MARKET, BY METHOD, 2019-2030 (USD MILLION)
    1. TABLE
  373. REST OF ASIA PACIFIC: OIL SHALE MARKET, BY METHOD, 2019-2030 (MILLION BARRELS)
    1. TABLE
  374. REST OF ASIA PACIFIC: OIL SHALE MARKET, BY PRODUCT, 2019-2030 (USD MILLION)
    1. TABLE
  375. REST OF ASIA PACIFIC: OIL SHALE MARKET, BY PRODUCT, 2019-2030 (MILLION BARRELS)
    1. TABLE
  376. REST OF ASIA PACIFIC: OIL SHALE MARKET, BY END USER, 2019-2030 (USD MILLION)
    1. TABLE
  377. REST OF ASIA PACIFIC: OIL SHALE MARKET, BY END USER, 2019-2030 (MILLION BARRELS)
    1. TABLE
  378. LATIN AMERICA: OIL SHALE MARKET, BY COUNTRY, 2019-2030 (USD MILLION)
    1. TABLE
  379. LATIN AMERICA: OIL SHALE MARKET, BY COUNTRY, 2019-2030 (MILLION BARRELS)
    1. TABLE
  380. LATIN AMERICA: OIL SHALE MARKET, BY PROCESS, 2019-2030 (USD MILLION)
    1. TABLE
  381. LATIN AMERICA: OIL SHALE MARKET, BY PROCESS, 2019-2030 (MILLION BARRELS)
    1. TABLE
  382. LATIN AMERICA: OIL SHALE MARKET, BY METHOD, 2019-2030 (USD MILLION)
    1. TABLE
  383. LATIN AMERICA: OIL SHALE MARKET, BY METHOD, 2019-2030 (MILLION BARRELS)
    1. TABLE
  384. LATIN AMERICA: OIL SHALE MARKET, BY PRODUCT, 2019-2030 (USD MILLION)
    1. TABLE
  385. LATIN AMERICA: OIL SHALE MARKET, BY PRODUCT, 2019-2030 (MILLION BARRELS)
    1. TABLE
  386. LATIN AMERICA: OIL SHALE MARKET, BY END USER, 2019-2030 (USD MILLION)
    1. TABLE
  387. LATIN AMERICA: OIL SHALE MARKET, BY END USER, 2019-2030 (MILLION BARRELS)
    1. TABLE
  388. ARGENTINA: OIL SHALE MARKET, BY PROCESS, 2019-2030 (USD MILLION)
    1. TABLE
  389. ARGENTINA: OIL SHALE MARKET, BY PROCESS, 2019-2030 (MILLION BARRELS)
    1. TABLE
  390. ARGENTINA: OIL SHALE MARKET, BY METHOD, 2019-2030 (USD MILLION)
    1. TABLE
  391. ARGENTINA: OIL SHALE MARKET, BY METHOD, 2019-2030 (MILLION BARRELS)
    1. TABLE
  392. ARGENTINA: OIL SHALE MARKET, BY PRODUCT, 2019-2030 (USD MILLION)
    1. TABLE
  393. ARGENTINA: OIL SHALE MARKET, BY PRODUCT, 2019-2030 (MILLION BARRELS)
    1. TABLE
  394. ARGENTINA: OIL SHALE MARKET, BY END USER, 2019-2030 (USD MILLION)
    1. TABLE
  395. ARGENTINA: OIL SHALE MARKET, BY END USER, 2019-2030 (MILLION BARRELS)
    1. TABLE
  396. BRAZIL: OIL SHALE MARKET, BY PROCESS, 2019-2030 (USD MILLION)
    1. TABLE
  397. BRAZIL: OIL SHALE MARKET, BY PROCESS, 2019-2030 (MILLION BARRELS)
    1. TABLE
  398. BRAZIL: OIL SHALE MARKET, BY METHOD, 2019-2030 (USD MILLION)
    1. TABLE
  399. BRAZIL: OIL SHALE MARKET, BY METHOD, 2019-2030 (MILLION BARRELS)
    1. TABLE
  400. BRAZIL: OIL SHALE MARKET, BY PRODUCT, 2019-2030 (USD MILLION)
    1. TABLE
  401. BRAZIL: OIL SHALE MARKET, BY PRODUCT, 2019-2030 (MILLION BARRELS)
    1. TABLE
  402. BRAZIL: OIL SHALE MARKET, BY END USER, 2019-2030 (USD MILLION)
    1. TABLE
  403. BRAZIL: OIL SHALE MARKET, BY END USER, 2019-2030 (MILLION BARRELS)
    1. TABLE
  404. REST OF LATIN AMERICA: OIL SHALE MARKET, BY PROCESS, 2019-2030 (USD MILLION)
    1. TABLE
  405. REST OF LATIN AMERICA: OIL SHALE MARKET, BY PROCESS, 2019-2030 (MILLION BARRELS)
    1. TABLE
  406. REST OF LATIN AMERICA: OIL SHALE MARKET, BY METHOD, 2019-2030 (USD MILLION)
    1. TABLE
  407. REST OF LATIN AMERICA: OIL SHALE MARKET, BY METHOD, 2019-2030 (MILLION BARRELS)
    1. TABLE
  408. REST OF LATIN AMERICA: OIL SHALE MARKET, BY PRODUCT, 2019-2030 (USD MILLION)
    1. TABLE
  409. REST OF LATIN AMERICA: OIL SHALE MARKET, BY PRODUCT, 2019-2030 (MILLION BARRELS)
    1. TABLE
  410. REST OF LATIN AMERICA: OIL SHALE MARKET, BY END USER, 2019-2030 (USD MILLION)
    1. TABLE
  411. REST OF LATIN AMERICA: OIL SHALE MARKET, BY END USER, 2019-2030 (MILLION BARRELS)
    1. TABLE
  412. MIDDLE EAST & AFRICA: OIL SHALE MARKET, BY COUNTRY, 2019-2030 (USD MILLION)
    1. TABLE
  413. MIDDLE EAST & AFRICA: OIL SHALE MARKET, BY COUNTRY, 2019-2030 (MILLION
    1. BARRELS)
  414. MIDDLE EAST & AFRICA: OIL SHALE MARKET, BY PROCESS,
  415. MIDDLE EAST & AFRICA: OIL SHALE
  416. MARKET, BY PROCESS, 2019-2030 (MILLION BARRELS)
  417. MIDDLE EAST
  418. & AFRICA: OIL SHALE MARKET, BY METHOD, 2019-2030 (USD MILLION)
    1. TABLE
  419. MIDDLE EAST & AFRICA: OIL SHALE MARKET, BY METHOD, 2019-2030 (MILLION BARRELS)
    1. TABLE
  420. MIDDLE EAST & AFRICA: OIL SHALE MARKET, BY PRODUCT, 2019-2030 (USD MILLION)
    1. TABLE
  421. MIDDLE EAST & AFRICA: OIL SHALE MARKET, BY PRODUCT, 2019-2030 (MILLION
    1. BARRELS)
  422. MIDDLE EAST & AFRICA: OIL SHALE MARKET, BY END
    1. USER, 2019-2030 (USD MILLION)
  423. MIDDLE EAST & AFRICA: OIL
  424. SHALE MARKET, BY END USER, 2019-2030 (MILLION BARRELS)
  425. SOUTH
  426. AFRICA: OIL SHALE MARKET, BY PROCESS, 2019-2030 (USD MILLION)
    1. TABLE 198.
  427. SOUTH AFRICA: OIL SHALE MARKET, BY PROCESS, 2019-2030 (MILLION BARRELS)
    1. TABLE
  428. SOUTH AFRICA: OIL SHALE MARKET, BY METHOD, 2019-2030 (USD MILLION)
    1. TABLE
  429. SOUTH AFRICA: OIL SHALE MARKET, BY METHOD, 2019-2030 (MILLION BARRELS)
    1. TABLE
  430. SOUTH AFRICA: OIL SHALE MARKET, BY PRODUCT, 2019-2030 (USD MILLION)
    1. TABLE
  431. SOUTH AFRICA: OIL SHALE MARKET, BY PRODUCT, 2019-2030 (MILLION BARRELS)
    1. TABLE
  432. SOUTH AFRICA: OIL SHALE MARKET, BY END USER, 2019-2030 (USD MILLION)
    1. TABLE
  433. SOUTH AFRICA: OIL SHALE MARKET, BY END USER, 2019-2030 (MILLION BARRELS)
    1. TABLE
  434. GCC COUNTRIES: OIL SHALE MARKET, BY PROCESS, 2019-2030 (USD MILLION)
    1. TABLE
  435. GCC COUNTRIES: OIL SHALE MARKET, BY PROCESS, 2019-2030 (MILLION BARRELS)
    1. TABLE
  436. GCC COUNTRIES: OIL SHALE MARKET, BY METHOD, 2019-2030 (USD MILLION)
    1. TABLE
  437. GCC COUNTRIES: OIL SHALE MARKET, BY METHOD, 2019-2030 (MILLION BARRELS)
    1. TABLE
  438. GCC COUNTRIES: OIL SHALE MARKET, BY PRODUCT, 2019-2030 (USD MILLION)
    1. TABLE
  439. GCC COUNTRIES: OIL SHALE MARKET, BY PRODUCT, 2019-2030 (MILLION BARRELS)
    1. TABLE
  440. GCC COUNTRIES: OIL SHALE MARKET, BY END USER, 2019-2030 (USD MILLION)
    1. TABLE
  441. GCC COUNTRIES: OIL SHALE MARKET, BY END USER, 2019-2030 (MILLION BARRELS)
    1. TABLE
  442. REST OF MIDDLE EAST & AFRICA: OIL SHALE MARKET, BY PROCESS, 2019-2030 (USD
    1. MILLION)
  443. REST OF MIDDLE EAST & AFRICA: OIL SHALE MARKET,
    1. BY PROCESS, 2019-2030 (MILLION BARRELS)
  444. REST OF MIDDLE EAST
  445. & AFRICA: OIL SHALE MARKET, BY METHOD, 2019-2030 (USD MILLION)
    1. TABLE
  446. REST OF MIDDLE EAST & AFRICA: OIL SHALE MARKET, BY METHOD, 2019-2030 (MILLION
    1. BARRELS)
  447. REST OF MIDDLE EAST & AFRICA: OIL SHALE MARKET,
    1. BY PRODUCT, 2019-2030 (USD MILLION)
  448. REST OF MIDDLE EAST &
  449. AFRICA: OIL SHALE MARKET, BY PRODUCT, 2019-2030 (MILLION BARRELS)
    1. TABLE
  450. REST OF MIDDLE EAST & AFRICA: OIL SHALE MARKET, BY END USER, 2019-2030
    1. (USD MILLION)
  451. REST OF MIDDLE EAST & AFRICA: OIL SHALE MARKET,
    1. BY END USER, 2019-2030 (MILLION BARRELS)
  452. LIST OF FIGURES
    1. FIGURE
  453. MARKET SYNOPSIS
  454. MARKET ATTRACTIVENESS ANALYSIS: GLOBAL OIL
  455. SHALE MARKET
  456. GLOBAL OIL SHALE MARKET ANALYSIS BY PROCESS
    1. FIGURE
  457. GLOBAL OIL SHALE MARKET ANALYSIS BY METHOD
  458. GLOBAL OIL SHALE
    1. MARKET ANALYSIS BY PRODCT
  459. GLOBAL OIL SHALE MARKET ANALYSIS BY
    1. END USER
  460. GLOBAL OIL SHALE MARKET ANALYSIS BY REGION
    1. FIGURE
  461. GLOBAL OIL SHALE MARKET: MARKET STRUCTURE
  462. KEY BUYING CRITERIA
    1. OF OIL SHALE RESEARCH PROCESS OF MRFR
  463. NORTH AMERICA MARKET
    1. SIZE & MARKET SHARE BY COUNTRY (2023 VS 2030)
  464. EUROPE MARKET
    1. SIZE & MARKET SHARE BY COUNTRY (2023 VS 2030)
  465. ASIA-PACIFIC
    1. & MARKET SHARE BY COUNTRY (2023 VS 2030)
  466. MIDDLE EAST &
    1. AFRICA MARKET SIZE & MARKET SHARE BY COUNTRY (2023 VS 2030)
    2. FIGURE
  467. LATIN AMERICA MARKET SIZE & MARKET SHARE BY COUNTRY (2023 VS 2030)
    1. FIGURE
  468. DROC ANALYSIS OF GLOBAL OIL SHALE MARKET
  469. DRIVERS IMPACT
    1. ANALYSIS: OIL SHALE MARKET
  470. RESTRAINTS IMPACT ANALYSIS: OIL
  471. SHALE MARKET
  472. SUPPLY / VALUE CHAIN: GLOBAL OIL SHALE MARKET
    1. FIGURE
  473. GLOBAL OIL SHALE MARKET, BY END USE, 2022 (% SHARE)
  474. GLOBAL
  475. OIL SHALE MARKET, BY END USE, 2023 TO 2030 (USD MILLION)

Oil Shale Market Segmentation

Market Segmentation Overview

  • Detailed segmentation data will be available in the full report
  • Comprehensive analysis by multiple parameters
  • Regional and country-level breakdowns
  • Market size forecasts by segment
Infographic

Free Sample Request

Kindly complete the form below to receive a free sample of this Report

Get Free Sample

Customer Strories

“I am very pleased with how market segments have been defined in a relevant way for my purposes (such as "Portable Freezers & refrigerators" and "last-mile"). In general the report is well structured. Thanks very much for your efforts.”

Victoria Milne

Founder

Compare Licence

×
Features License Type
Single User Multiuser License Enterprise User
Price $4,950 $5,950 $7,250
Maximum User Access Limit 1 User Upto 10 Users Unrestricted Access Throughout the Organization
Free Customization
Direct Access to Analyst
Deliverable Format
Platform Access
Discount on Next Purchase 10% 15% 15%
Printable Versions