Organic Tea Market (2026 - 2035)

Organic Tea Market Size, Share, Industry Trend & Analysis Research Report Information By Type (Black Organic Tea, Green Organic Tea, Oolong Organic Tea, Herbal/Fruit Infusions, Others), By Flavor (Unflavored, Flavored), By Packaging Type (Cartons, Paper Pouches, Tins/Cans, Sachets, Others), By Distribution Channel (Off-Trade, On-Trade), By Geography (North America, Europe, Asia-Pacific, South America, Middle East & Africa) – Forecast Till 2035

Forecast Period
2026-2035
CAGR
12.9%
2025 Market Size
USD 1.49 Billion
2035 Market Size
USD 4.97 Billion
Food, Beverages & Nutrition ● Updated August 26, 2026 Report ID: MRFR/FnB/2261-HCR | Pages: 110 | Author: Snehal Singh

Organic Tea Market Summary

The Organic Tea Market closed 2025 at USD 1.49 Billion and opens the forecast window at USD 1.67 Billion in 2026, climbing to USD 4.97 Billion by 2035 at a 12.9% CAGR. Two catalysts anchor that trajectory. The European Union's organic production regulation (EU 2018/848), fully enforced since January 2022, tightened import equivalence and pushed certified volumes into audited traceability [3]. In parallel, India's Mission Organic Value Chain Development committed roughly USD 190 million to certified smallholder clusters, much of it in Assam, Darjeeling and the Nilgiris [7].

Silently, the Organic Tea Market is being transformed by processing and provenance technology. Blockchain-backed lot tracking, near-infrared residue screening at receiving ports, and QR-linked batch disclosure at retail are replacing paper-ledger estate records and unverified "natural" claims. Rainforest Alliance reported certified-farm assurance spending above USD 55 million annually across its tea and coffee initiatives [9], while Tata Consumer Products has extended digital estate mapping across more than 25 gardens [17].

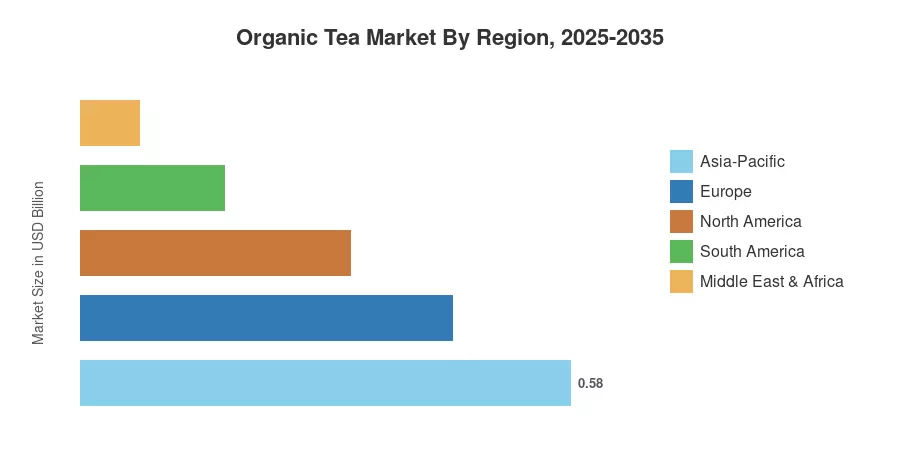
Origin economics and a growing middle class are the driving forces behind Asia-Pacific's 38.8% share of global revenue. The most rapid growth in Europe is observed at a compound annual growth rate (CAGR) of 13.2%, where certification literacy and price tolerance are at their highest. North America follows with a 21.5% share, which is primarily due to the functional-wellness reformulation of mainstream grocery stores. Through 2035, verified supply — not marketing volume — will determine who wins.


Key Report Takeaways

• By Type

  • Green organic tea led the Organic Tea Market with a 36.8% share in 2025, supported by catechin-linked wellness positioning.
  • Herbal and fruit infusions are the fastest-expanding type at a 14.2% CAGR through 2035

• By Flavor

  • Unflavored blends accounted for 67.4% of 2025 revenue, reflecting purist demand in the Organic Tea Market.


• By Packaging

  • Cartons captured 32.2% of packaging revenue on recyclability and shelf economics.


• By Channel

  • On-trade venues — cafés, hotels, and quick-service chains — are advancing at a 14.8% CAGR.

• By Region

  • Asia-Pacific commanded 38.8% of the Organic Tea Market in 2025
  • Europe posts the quickest regional CAGR at 13.2% across 2026–2035
  • North America generated USD 0.32 Billion in 2025 revenue


Market Size and Forecast (2021–2035)

Estimates blend certified-hectare data from FiBL/IFOAM, customs-level trade flows from the International Tea Committee, audited revenue disclosures from listed players, and roughly 40 supply-side interviews with estate operators, blenders and category buyers. Values are triangulated top-down against retail scanner panels and bottom-up against certified volume multiplied by realized farmgate-to-shelf spreads. All figures for the Organic Tea Market are expressed in USD Billion at constant 2025 prices.
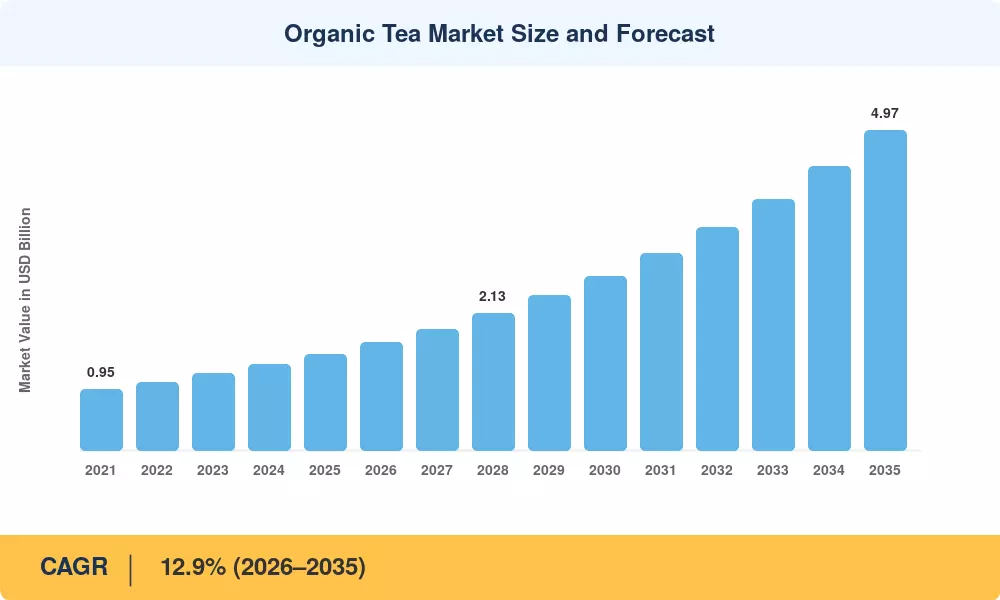
Organic Tea Market Size and Forecast
Our Impact
Enabled $4.3B Revenue Impact for Fortune 500 and Leading Multinationals
Partnering with 2000+ Global Organizations Each Year
30K+ Citations by Top-Tier Firms in the Industry

Driver Impact Analysis

Driver ~% Impact on CAGR Geographic Relevance Impact Timeline
Clean-label and wellness demand ~3.1% Global Short-term (≤2 yr)
Stricter organic certification enforcement ~2.4% Europe, North America Medium-term (2–4 yr)
Café and hospitality menu conversion ~2.0% Europe, Middle East Medium-term (2–4 yr)
Certified acreage expansion at origin ~1.8% Asia-Pacific, Africa Long-term (≥4 yr)
E-commerce and subscription retail ~1.5% North America, Asia-Pacific Short-term (≤2 yr)
Regenerative and carbon-neutral estate claims ~1.2% Europe, Latin America Long-term (≥4 yr)
Functional botanical blending ~0.9% Global Medium-term (2–4 yr)


Clean-Label Demand Reshapes Shelf Economics

Shoppers now read ingredient decks the way they once read price tags. FiBL's 2025 survey placed global organic food retail sales above USD 145 billion, with beverages among the three fastest-moving aisles [12]. Tea benefits disproportionately because the leaf is consumed as an infusion, making pesticide residue a visceral concern rather than an abstract one. Retailers have responded by ring-fencing planogram space — several European grocers now allocate above 20% of tea shelf facings to certified lines.

Certification Enforcement Raises the Barrier to Entry

Regulation has become a moat. EU 2018/848 removed the old equivalence shortcut and required compliance-based recognition for third-country imports, forcing origin operators to rebuild documentation from the field upward [3]. The USDA's Strengthening Organic Enforcement rule, effective March 2024, closed uncertified-handler gaps and mandated import certificates across the chain [1]. Both raised audit costs materially, but they also stripped out unverified competitors and protected realized pricing for compliant brands.

Hospitality Channels Convert Faster Than Expected

Cafés and hotel groups discovered that a certified pot carries a defensible premium. Menu audits across Western European chains show organic tea list prices much above conventional equivalents at comparable serve sizes [16]. That spread funds barista training, ceramic service and provenance storytelling — all of which lift attach rates. On-trade remains the smaller channel by volume, yet its 14.8% CAGR outpaces retail by a wide margin.

Origin Investment Unlocks Supply

Supply, not demand, has been the binding constraint. India's organic value-chain program and Sri Lanka's post-2022 agronomy reset together brought tens of thousands of certified hectares into transition [7]. Kenya's Tea Board has meanwhile piloted smallholder group certification to cut per-farm audit costs by roughly 40% [8]. Each hectare converted compresses the scarcity premium and widens the addressable base.


Restraints Impact Analysis

Restraint ~% Impact on CAGR Geographic Relevance Impact Timeline
Certification and audit cost burden ~-1.7% Asia-Pacific, Africa Medium-term (2–4 yr)
Yield gap versus conventional cultivation ~-1.4% Global Long-term (≥4 yr)
Retail price premium and elasticity limits ~-1.1% Latin America, MEA Short-term (≤2 yr)
Climate volatility at origin ~-0.9% Asia-Pacific Long-term (≥4 yr)
Label fraud and consumer trust erosion ~-0.6% Global Medium-term (2–4 yr)


Certification Costs Squeeze Smallholders

Audit economics punish scale disadvantage. Third-party certification for a single estate typically runs USD 3,000–7,500 annually before internal control system overhead, a figure that can exceed 4% of gross revenue for farms under 20 hectares [10]. Three-year transition periods compound the problem: growers absorb organic input costs while still selling at conventional prices. Group certification schemes help, but coverage remains thin across East Africa and Indonesia.

Yield Gaps Constrain Volume Growth

Agronomic reality caps supply. Peer-reviewed meta-analysis places organic perennial-crop yields 18–24% below conventional benchmarks under comparable conditions, with tea sitting near the middle of that band [11]. Compost logistics, biological pest control and manual weeding raise labor intensity by roughly a third. Until regenerative agronomy narrows that gap, certified leaf will stay structurally scarce, and prices will stay elevated.

Price Elasticity Caps Emerging-Market Penetration

Affordability sets a ceiling. In Brazil, Egypt and much of Southeast Asia, certified retail packs carry a 45–60% premium over mainstream tea, well beyond discretionary tolerance for median households [20]. Brands have tested smaller formats and refill pouches with partial success, but per-serve economics remain the gating factor outside metropolitan cores.


Organic Tea Market Opportunities

Functional Botanical Blending

Blending certified leaf with adaptogens, turmeric, ashwagandha and chamomile converts a commodity infusion into a wellness SKU with 30–40% higher gross margin. Regulatory clarity matters: EFSA's health-claim register still restricts most botanical assertions, so the winning play is sensory and ritual framing rather than clinical language [13]. Herbal and fruit infusions already grow fastest by type.

Emerging-Market Origin Brands

Origin countries are moving downstream. Kenyan, Rwandan and Nepali producers that once shipped bulk leaf are launching consumer-facing certified brands, capturing spread that historically accrued to Western blenders [8]. Development finance — including a USD 45 million IFC agribusiness facility for East African value addition — is underwriting packaging and export infrastructure [18]. This is the largest untapped margin pool in the category.


Circular and Compostable Packaging

Packaging regulation is becoming a demand driver. The EU Packaging and Packaging Waste Regulation sets recyclability requirements for all packaging by 2030, and several member states have already banned polypropylene-sealed tea bags [5]. Brands that convert early to plant-based mesh and mono-material cartons secure listings ahead of competitors.

Premium Hospitality and Gifting

Luxury hotels, airline premium cabins and corporate gifting represent a small-volume, high-value pocket where single-origin tea sourcing commands three-figure per-kilogram realizations. Middle East hospitality expansion tied to Saudi Vision 2030 tourism targets adds a concentrated demand node [19].


Organic Tea Market Future Outlook

Traceability Becomes Table Stakes

Digital provenance moves from differentiator to requirement. The EU Deforestation Regulation, applying from December 2025 for large operators, has normalized geolocation-level supply disclosure across agricultural imports [4]. Tea sits adjacent to covered commodities, and retailers are extending the same evidentiary standard voluntarily. By 2030, expect lot-level traceability to be a listing precondition rather than a premium claim in the Organic Tea Market.

Platform Economics Reshape Distribution

Marketplace and subscription models compress the distance between estate and cup. Brands operating hybrid retail-plus-direct models report blended gross margins 8–12 points above pure wholesale peers [20]. The strategic asset is the customer relationship: reorder data enables inventory precision that wholesale never delivered.

Climate Adaptation Enters Cost Models

Warming is repricing origin risk. FAO analysis links shifting rainfall patterns in Assam and the Nilgiris to yield variability approaching 15% year to year [6]. Shade-tree systems, drought-tolerant cultivars and altitude migration all require capital that smallholders lack, making buyer-funded adaptation programs a growing line item in procurement budgets.

Sustainability Disclosure Becomes Financial

Reporting obligations now touch mid-size beverage firms. The EU Corporate Sustainability Reporting Directive phases in through 2028, requiring value-chain emissions and biodiversity disclosure [5]. Certified organic sourcing simplifies Scope 3 accounting materially, turning what was a marketing expense into a compliance efficiency.


Organic Tea Market Segmentation

By Type

Type segmentation in the Organic Tea Market reflects both heritage consumption and functional experimentation.

Segment Metric Primary Demand Driver
Green Organic Tea 36.8% share Antioxidant and metabolic positioning
Black Organic Tea USD 0.44 Billion Breakfast ritual and blending base
Herbal/Fruit Infusions 14.2% CAGR Caffeine-free wellness occasions
Oolong Organic Tea 6.1% share Specialty and connoisseur channels
Others (White, Pu-erh) 13.1% CAGR Rare-lot and gifting demand


Green tea's lead with 36.8% share is durable rather than fashionable. Its clinical association with catechins and cardiovascular research gives retailers a defensible shelf narrative, and East Asian production depth keeps certified supply reliable. Herbal and fruit infusions grow faster because they escape caffeine constraints entirely, opening evening and pediatric-adjacent occasions that traditional leaf cannot serve. Black tea remains the revenue ballast, particularly in the UK, Ireland and Gulf markets where daily consumption frequency is highest. Others (White, Pu-erh) segment with 13.1% CAGR is projected to be the fastest-growing sub-segment.

By Flavor

The flavor split in the Organic Tea Market reveals a purist core with an expanding periphery.

Segment Metric Primary Demand Driver
Unflavored 67.4% share Terroir and single-estate appreciation
Flavored (Naturally) 13.6% CAGR Younger cohort recruitment


Unflavored sub-segment with 67.4% share, establishing: buyers paying a certification premium generally want the leaf to speak for itself. Naturally flavored variants grow faster (13.6% CAGR ) because they recruit new drinkers — bergamot, citrus and berry profiles lower the entry barrier for consumers migrating from sweetened beverages. Synthetic flavoring is prohibited under organic standards, which conveniently forces authenticity.

By Packaging Type

Packaging decisions in the Organic Tea Market now carry regulatory weight alongside shelf appeal.

Segment Metric Primary Demand Driver
Cartons 32.2% share Recyclability and print real estate
Paper Pouches USD 0.31 Billion Refill and bulk formats
Tins/Cans 8.8% CAGR Gifting and freshness preservation
Sachets 21.4% share Convenience and portion control
Others 9.6% CAGR Compostable and mono-material trials


Cartons with 32.2% share win on the combination of curbside recyclability and billboard surface for certification marks. Others segment grows fastest in value terms because they anchor gifting sets and premium loose-leaf, where the container itself justifies price.

By Distribution Channel

Segment Metric Primary Demand Driver
Off-Trade 55.4% share Grocery, specialty retail, e-commerce
On-Trade 14.8% CAGR Cafés, hotels, restaurants


Off-trade, with 55.4% share, retains scale through supermarket and online reach. On-trade compounds faster because each venue conversion locks in recurring volume and normalizes the premium price point for consumers who then replicate it at home.


Regional Market Share Analysis

Region Metric (2025) Primary Investment Themes
North America USD 0.32 Billion Functional reformulation, private label, DTC
Europe 29.4% share Certification depth, circular packaging, premium retail
Asia-Pacific 38.8% share Origin integration, domestic premiumization
South America 11.2% CAGR Yerba-adjacent blends, export processing
Middle East & Africa 4.7% share Hospitality demand, smallholder certification
Total USD 1.49 Billion

Regional performance in the Organic Tea Market splits cleanly between volume and value. Asia-Pacific supplies and increasingly consumes the leaf; Europe pays the most for it. That divergence defines where capital should sit across the Organic Tea Market forecast horizon.


North America

Country Metric Key Driver
US 74.8% share of region Strengthening Organic Enforcement compliance
Canada USD 0.05 Billion Bilingual clean-label retail expansion
Mexico 11.4% CAGR Urban wellness retail growth


The USDA's Strengthening Organic Enforcement rule reset the compliance baseline in March 2024, requiring import certificates and certification for previously exempt handlers [1]. Large grocers used the transition to consolidate suppliers, favoring blenders with audited chains. Canada's organic equivalency arrangement with the EU continues to smooth cross-border listings, while Mexican demand concentrates in Mexico City and Monterrey specialty channels.

Europe

Country Metric Key Driver
Germany 24.2% share of region Drogerie and Bio-supermarket density
UK USD 0.09 Billion Premium blender heritage brands
France 13.5% CAGR Agence Bio conversion subsidies
Italy 9.1% share of region Herbal infusion tradition
Spain USD 0.03 Billion Foodservice recovery
Nordic Countries 14.1% CAGR Highest per-capita organic spend
Russia 5.8% share of region Domestic certification framework
Rest of Europe USD 0.04 Billion Discounter organic private label


Europe's lead rests on institutional infrastructure. The EU organic action plan targets 25% of agricultural land under organic management by 2030, backed by CAP eco-scheme payments [4]. Germany alone hosts more than 3,000 dedicated organic retail outlets, giving certified tea guaranteed distribution independent of mainstream grocery negotiations. Nordic markets pay the highest realized per-kilogram prices in the world.

Asia-Pacific

Country Metric Key Driver
China 27.4% share of region Domestic premium green tea demand
India USD 0.13 Billion Mission Organic Value Chain Development
Japan 11.2% CAGR Certified matcha and sencha exports
South Korea 8.3% share of region Wellness café culture
ASEAN 14.6% CAGR Vietnamese and Indonesian conversion
Rest of Asia-Pacific USD 0.05 Billion Sri Lankan estate certification


Origin advantage compounds here. India's program has channeled roughly USD 190 million into certified cluster development, with Sikkim's fully organic state status serving as a policy template [7]. China's green food and organic dual-certification system has expanded audited tea acreage past 100,000 hectares. Sustainable tea cultivation practices adopted across Sri Lankan estates after the 2021–22 input crisis have since become a durable export credential.

South America

Country Metric Key Driver
Brazil 52.6% share of region Urban specialty retail
Argentina USD 0.02 Billion Yerba mate crossover blends
Rest of South America 10.9% CAGR Andean botanical exports


Brazil anchors the region through São Paulo's specialty retail cluster and a growing natural-products channel. Argentina's mate infrastructure — cooperatives, drying capacity, export licensing — transfers readily to certified tea processing. Peruvian and Ecuadorian botanical exporters increasingly supply European blenders directly, bypassing intermediaries.

Middle East & Africa

Country Metric Key Driver
Saudi Arabia 26.8% share of region Vision 2030 hospitality buildout
UAE USD 0.01 Billion Luxury hotel and duty-free demand
South Africa 12.7% CAGR Rooibos certification leadership
Egypt 14.9% share of region Herbal infusion production base
Rest of MEA USD 0.02 Billion Kenyan smallholder certification


Kenya remains the pivotal supply story. Its Tea Board has piloted group certification structures designed to reduce per-farm audit costs by roughly 40%, opening organic pathways for growers below five hectares [8]. South Africa's rooibos sector, already carrying EU geographical indication status, demonstrates how origin protection and organic certification stack into pricing power. Gulf demand is concentrated, hospitality-led and largely import-dependent.


Organic Tea Market By Region, 2025-2035

Competitive Benchmarking

Concentration in the Organic Tea Market remains low. Estimated HHI sits near 480, with the top five players controlling roughly 29–33% of global revenue — a structure that reflects fragmented origin supply, low technical barriers to blending, and strong regional brand loyalty. Consolidation is accelerating nonetheless, as multinationals acquire certified specialists to secure audited supply rather than to buy share. Private label complicates the picture further, holding double-digit share in several European grocery chains.

Company Est. Revenue Share Range Key Offerings for Organic Tea Market Strategic Positioning
Lipton Teas and Infusions ~8–11% Pukka, Tazo, T2 organic ranges Scale distribution with premium sub-brands
Tata Consumer Products Ltd. ~6–9% Tetley Organic, Good Earth, Teapigs Vertically integrated from Indian estates
Associated British Foods (Twinings) ~5–8% Twinings Organic, Superblends Heritage brand equity and global retail reach
The Hain Celestial Group ~4–6% Celestial Seasonings organic herbals Herbal infusion specialist, North America-led
Yogi Products GmbH ~3–5% Ayurvedic organic blends Functional wellness positioning
Traditional Medicinals, Inc. ~2–4% Herbal wellness organic teas Pharmacy and natural channel strength
Numi Organic Tea ~2–4% Fair-trade organic loose and bagged Sustainability-first brand narrative
R.C. Bigelow, Inc. ~2–3% Organic green and black lines US family-owned, mainstream grocery
Organic India Pvt. Ltd. ~2–3% Tulsi organic infusions Origin-integrated smallholder model
Hälssen & Lyon GmbH ~2–3% Bulk certified leaf, private label B2B supply and contract blending
Clipper Teas (Ecotone) ~1–3% Organic Fairtrade everyday teas Ethical positioning in UK and EU
The Republic of Tea ~1–2% Specialty organic sipping teas Premium DTC and gifting focus


Recent News & Developments

  • USDA (March 2024): The Strengthening Organic Enforcement rule took full effect, mandating import certificates and closing uncertified-handler exemptions — materially raising documentation costs for the Organic Tea Market supply chain [1]
  • Lipton Teas and Infusions (June 2024): Completed the divestiture of its Kenyan and Rwandan estate assets to Browns Investments, signaling a shift from plantation ownership toward asset-light certified sourcing [15]
  • Tata Consumer Products (September 2024): Expanded organic-certified acreage across its Assam and Nilgiris operations and extended digital estate mapping to more than 25 gardens [17]
  • European Commission (January 2025): Published updated guidance on organic import compliance under EU 2018/848, tightening residue-testing frequency for third-country consignments [3]
  • Hain Celestial (April 2025): Relaunched Celestial Seasonings herbal range with compostable mesh bags and mono-material cartons ahead of EU packaging deadlines [5]
  • Rainforest Alliance (July 2024): Introduced revised tea supply-chain requirements integrating living-income reference pricing for certified smallholders [9]
  • Kenya Tea Board (November 2024): Launched a group-certification pilot covering over 12,000 smallholders, targeting a 40% reduction in per-farm audit cost [8]
  • Twinings (ABF) (February 2025): Announced a multi-year sourcing partnership with Nepali cooperatives to secure high-altitude certified leaf for its premium organic tier [21]


Organic Tea Market Report Scope

Parameter Detail
Market Scope Global certified organic tea across type, flavor, packaging and distribution channel
Study Period 2021–2035 (Historical 2021–2024; Base Year 2025; Forecast 2026–2035)
CAGR 12.9% (2026–2035)
Market Size Checkpoints USD 1.49 Billion (2025); USD 1.67 Billion (2026); USD 4.97 Billion (2035)
Fastest Growing Segments Herbal/Fruit Infusions (type); On-Trade (channel); Europe (region)
Companies Profiled 12 leading players in the Organic Tea Market, including Lipton Teas and Infusions, Tata Consumer Products, Associated British Foods, Hain Celestial and Yogi Products
Valuation Currency USD Billion, constant 2025 prices

FAQs

What contract terms should procurement teams negotiate when sourcing for the Organic Tea Market?
Lock multi-year volume commitments with indexed pricing tied to certified farmgate benchmarks. Insist on transition-period cost sharing and audit-failure remediation clauses rather than immediate termination rights [10].
How does organic certification differ from Fairtrade or Rainforest Alliance marks?
Organic governs agricultural inputs and processing. Fairtrade governs price floors and producer premiums; Rainforest Alliance covers biodiversity and labor. Stacking marks raises audit cost roughly 30% but improves retail listing odds [9].
Which capital deployment models are working best in the Organic Tea Market?
Buyer-funded conversion financing outperforms pure acquisition. Prepaying growers through the three-year transition secures exclusive certified supply at below-spot pricing once certification completes [18].
What are the most common integration failures after acquiring an organic tea brand?
Acquirers typically break the supply relationship first. Consolidating an artisan brand onto centralized procurement severs grower ties that underpinned its provenance story, eroding the premium that justified the purchase [15].
How should buyers verify authenticity beyond the certificate?
Request lot-level residue test reports and geolocation data, not just the certificate number. Isotope ratio testing can confirm claimed origin when documentation looks thin [2].
Does private label threaten branded margins in the Organic Tea Market?
Yes, in everyday tiers. Retailer organic lines now undercut brands by 20–25% in European grocery. Branded defense works only at specialty, single-estate and functional tiers [20].
What regulatory change should the industry watch most closely?
Corporate sustainability reporting expansion through 2028. It converts sourcing transparency from voluntary claim to audited disclosure, favoring vertically integrated suppliers over opportunistic traders [5].    
Author
Author
Author Profile
Snehal Singh LinkedIn
Manager - Research
High acumen in analyzing complex macro & micro markets with more than 6 years of work experience in the field of market research. By implementing her analytical skills in forecasting and estimation into market research reports, she has expertise in Packaging, Construction, and Equipment domains. She handles a team size of 20-25 resources and ensures smooth running of the projects, associated marketing activities, and client servicing.
Share::
Request Free Sample

Research Approach


Secondary Research

The secondary research process involved comprehensive analysis of regulatory databases, agricultural commodity statistics, peer-reviewed nutritional journals, food safety publications, and authoritative trade organizations. Key sources included the US Department of Agriculture (USDA) National Organic Program (NOP), European Commission Directorate-General for Agriculture and Rural Development (DG-AGR), Food and Agriculture Organization (FAO) Intergovernmental Group on Tea, International Trade Centre (ITC) Trade Map, UN Comtrade Database, Food Standards Agency (FSA) UK, European Food Safety Authority (EFSA), Organic certifying bodies including Soil Association (UK), Ecocert (France), Rainforest Alliance, and Fairtrade International. National agricultural authorities comprising the Tea Board of India, China Ministry of Agriculture and Rural Affairs (MARA), Sri Lanka Tea Board, Kenya Tea Board, and Japan Tea Central Public Interest Incorporated Association were consulted for production volume and export statistics. Additional sources included the Tea Association of the USA, UK Tea & Infusions Association, Research Institute of Organic Agriculture (FiBL), Organic Monitor, World Health Organization (WHO) Global Health Observatory, EU Eurostat Agri-Environmental Indicators, and national customs databases from major producing and consuming nations. These sources were used to collect cultivation statistics, organic certification data, export/import trade flows, pricing trends, regulatory compliance standards, and competitive landscape analysis for Camellia sinensis-based teas (Green, Black, Oolong, White) and herbal infusions (Chamomile, Peppermint, Ginger, Hibiscus, Rooibos).


Primary Research

Primary research included conducting in-depth interviews with both supply- and demand-side players to glean quantitative and qualitative data. Directors of Global Sourcing, Export Operations, Plantation Estates, Sustainability, and Organic Certification, as well as Managing Directors, were among the supply-side sources. Heads of organic tea estates, blending companies, and manufacturers of packaged items. The demand side was supplied by health-focused direct-to-consumer platforms' wellness brand managers, beverage program directors from café chains and hospitality groups, procurement leads from specialty tea retailers and gourmet food distributors, and beverage category managers from supermarkets and hypermarkets (Whole Foods Market, Tesco, Carrefour, Aeon, Aeon, etc.). Primary research has confirmed the timelines for organic certification, uncovered insights into premium pricing strategies, private label penetration, and sustainable packaging adoption patterns, and validated market segmentation by type of tea (Green, Black, White, Oolong, Herbal), form (Dried Leaf, Powder, Liquid/RTD), and packaging format (Tea Bags, Loose Leaf, Cans, Carton).

Primary Respondent Breakdown:

• By Designation: C-level Primaries (30%), Director Level (35%), Others (35%)

• By Region: North America (32%), Europe (30%), Asia-Pacific (28%), Rest of World (10%)


Market Size Estimation

Global market valuation was derived through production volume mapping and trade value analysis. The methodology included:

• Identification of 50+ key manufacturers and estate consolidators across North America, Europe, Asia-Pacific, Latin America, and Africa

• Product mapping across tea categories (Green, Black, Oolong, White, Herbal/Non-Camellia), physical forms (Dried Leaf, Powder, Liquid Concentrates/RTD), and packaging types (Tea Bags, Paper Pouches, Cartons, Cans, Aluminum Tins)

• Analysis of reported and modeled annual revenues specific to organic tea portfolios from publicly listed beverage conglomerates and privately held specialty brands

• Coverage of manufacturers and estate groups representing 75-80% of global organic tea market share in 2024

• Extrapolation using bottom-up (cultivation area under organic management × yield per hectare × farm-gate price × export-to-retail markup by producing country) and top-down (manufacturer revenue validation against customs export data) approaches to derive segment-specific valuations for true teas and herbal infusions across retail and foodservice channels

Share::
Request Free Sample
Download Free Sample

Kindly complete the form below to receive a free sample of this Report

* Please use a valid business email

Share::
Request Free Sample
Download PDF ×

We do not share your information with anyone. However, we may send you emails based on your report interest from time to time. You may contact us at any time to opt-out.
















