Orthopedic Devices Market (2026 - 2035)

Orthopedic Devices Market Research Report By Product Type (Joint Reconstruction Devices, Spinal Devices, Orthobiologics, Support Devices), By Material (Metal, Plastic, Ceramics, Composite), By End User (Hospitals, Orthopedic Clinics, Rehabilitation Centers, Ambulatory Surgical Centers) and By Regional (North America, Europe, South America, Asia Pacific, Middle East and Africa) - Industry Forecast to 2035.
ID: MRFR/MED/2390-CR
200 Pages
Satyendra Maurya, Rahul Gotadki
Last Updated: July 15, 2026
Orthopedic Devices Market
Market Size
Forecast Period2026-2035
CAGR (2026-2035)4.90%
2025 Market SizeUSD 63.56 billion
2035 Market SizeUSD 102.40 billion
Key Players
Johnson & Johnson
Stryker Corporation
Zimmer Biomet
Medtronic
Smith & Nephew
Globus Medical
Opportunities
  • Smart Implants and Continuous Remote Monitoring
  • Ambulatory Surgical Center Expansion Beyond North America
  • Personalized 3-D Printed Implants in Emerging Markets

Orthopedic Devices Market Summary

The Orthopedic Devices Market reached a valuation of USD 63.56 billion in 2025, positioning it as one of the most capital-intensive segments within the broader medical devices industry. Moving into 2026, the Orthopedic Devices Market is projected at USD 66.67 billion and is expected to expand to USD 102.40 billion by 2035, registering a compound annual growth rate (CAGR) of 4.90% across the forecast period (2026–2035). This trajectory reflects sustained demand from aging populations worldwide — the WHO estimates that by 2030, one in six people globally will be aged 60 or older — alongside rising prevalence of osteoarthritis and osteoporosis that directly increases procedural volumes [1].

A significant technological change is transforming the planning and execution of orthopedic surgeries. More than 1,200 hospitals in the United States have robotic-assisted surgical platforms, which have replaced traditional manual instruments in knee and hip arthroplasty rooms. Three-dimensional printing of patient-specific implants has evolved from prototyping to mainstream clinical implementation with more than 200 additively made orthopedic devices cleared by the FDA since 2020 [2]. These innovations minimize revision rates, decrease operating times, and increase the economic case for ambulatory surgery center (ASC) migration.


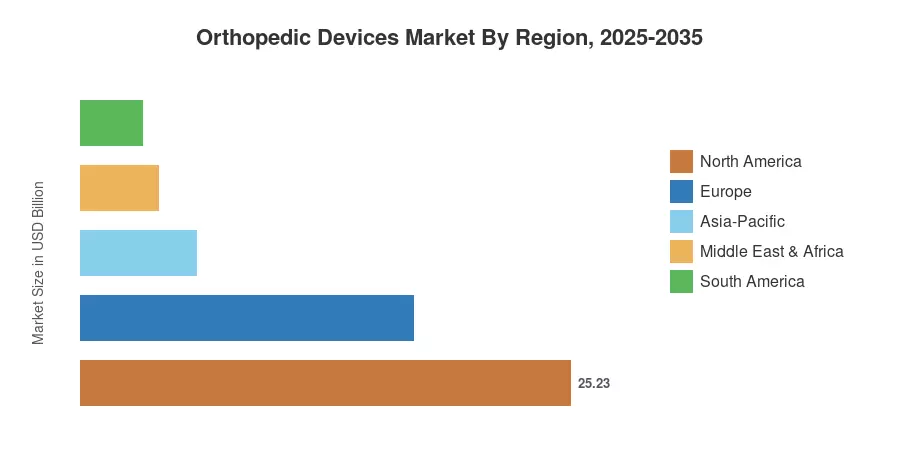
North America will have the largest position of the Orthopedic Devices Market, 39.7% revenue share in 2025. High reimbursement rates and well-established surgical infrastructure are driving the growth of the Orthopedic Devices Market in North America. Asia-Pacific is the fastest developing region with an expected CAGR of 9.4% up to 2035, due to increasing insurance coverage in China and India and a fast ageing population in Japan [3]. Europe represents the second-highest proportion of around 27.0%. However, the EU Medical Device Regulation (MDR) is still prolonging the product launch timeframes. Companies that combine robotic platforms and data-enabled aftercare with localized supply chains for high-volume, price-sensitive sectors will be in line for rewards in the decade ahead.


Key Report Takeaways

• By Product Type

  • Joint replacement implants commanded approximately 38.3% of the Orthopedic Devices Market share in 2025, reflecting persistent demand from hip and knee arthroplasty procedures.
  • Orthobiologics represent the fastest-growing product category in the Orthopedic Devices Market, projected to advance at a 10.8% CAGR through 2035 as regenerative medicine protocols gain clinical traction.

• By Technology

  • Conventional implants accounted for 44.5% of the Orthopedic Devices Market in 2025, though their share is gradually declining as digital manufacturing scales.
  • Robotic-assisted and navigation-enabled systems are projected to post a 10.5% CAGR through 2035, reflecting accelerating hospital capital investment.

• By End User

  • Hospitals captured 50.8% of the Orthopedic Devices Market in 2025, retaining dominance for complex revision and spinal procedures.
  • ASCs are forecasted to expand at a 9.4% CAGR through 2035, gaining share from same-day joint replacement volumes.

• By Geography

  • North America contributed 39.7% of the global Orthopedic Devices Market revenue in 2025.
  • Asia-Pacific is predicted to grow at a 9.4% CAGR through 2035, making it the region with the strongest growth trajectory.


Market Size and Forecast (2021–2035)

Market Research Future's (MRFR) proprietary estimation system is used to combine bottom-up implant unit shipment data, hospital buying records and macro-demographic modeling. Historical values (2021–2024) are based on audited trade data and company filings. Base-year value (2025) is based on preliminary shipping volumes. Forecast values (2026–2035) are based on the assumption of a constant CAGR of 4.90% with adjustments for expected regulatory and reimbursement changes.
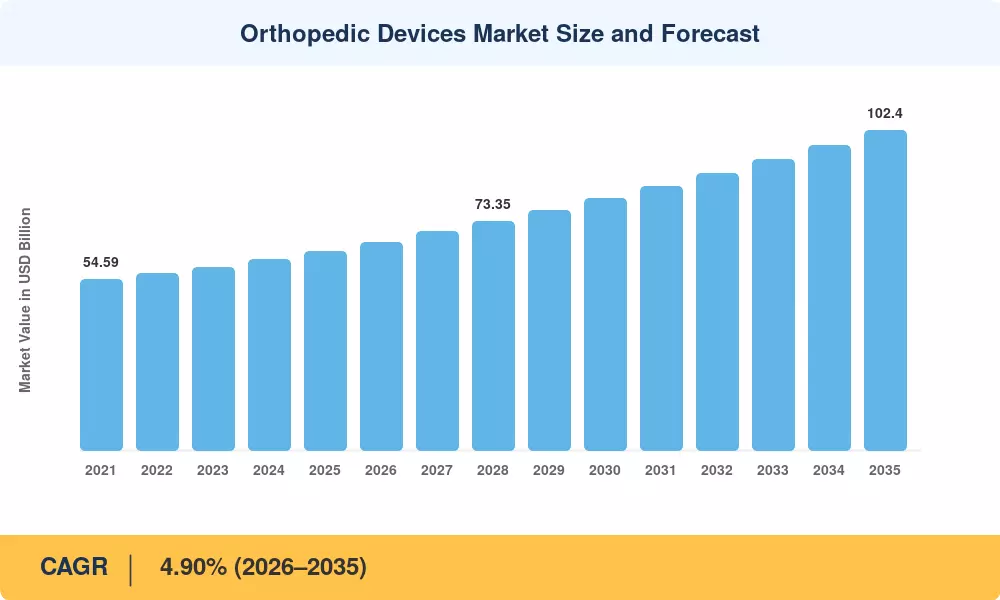
Orthopedic Devices Market Size and Forecast
Our Impact
Enabled $4.3B Revenue Impact for Fortune 500 and Leading Multinationals
Partnering with 2000+ Global Organizations Each Year
30K+ Citations by Top-Tier Firms in the Industry

Driver Impact Analysis

Driver ~% Impact on CAGR Geographic Relevance Impact Timeline
Population aging and osteoarthritis burden +1.4% Global Long-term (≥4 yr)
Robotic-assisted surgical adoption +0.9% North America, Europe Medium-term (2–4 yr)
ASC migration of joint procedures +0.7% North America Short-term (≤2 yr)
3-D printed patient-specific implants +0.5% North America, Europe, APAC Medium-term (2–4 yr)
Expanding insurance coverage in emerging economies +0.6% Asia-Pacific, South America Long-term (≥4 yr)
Orthobiologics and regenerative therapies +0.5% Global Medium-term (2–4 yr)
Data-enabled aftercare and remote monitoring +0.3% North America, Europe Long-term (≥4 yr)


Population Aging and Osteoarthritis Burden

The United Nations projects the global population aged 65 and older will reach 1.5 billion by 2050. Osteoarthritis (OA) prevalence rises with age and is a primary contributor to years lived with disability globally, particularly in the over-55 demographic. As life expectancy increases and global populations age, the demand for primary joint replacement procedures continues to rise, necessitating expanded orthopedic capacity.


Robotic-Assisted Surgical Adoption

Capital expenditure on robotic orthopedic platforms is a significant driver of market growth, with estimates placing the market value at approximately USD 2.18 billion in 2024. Systems such as Stryker’s Mako, Zimmer Biomet’s ROSA, and Smith+Nephew’s CORI are increasingly adopted to improve implant alignment accuracy and surgical precision. While economic payback periods remain highly variable based on facility volume and efficiency, evidence indicates that robotic-assisted total knee arthroplasty (TKA) is associated with improved early outcomes, including reduced hospital readmission rates and shorter lengths of stay compared to conventional techniques.


ASC Migration of Joint Procedures

In 2020, CMS made significant regulatory updates to expand the setting of care for orthopedic procedures: it added total knee arthroplasty (TKA) to the Ambulatory Surgical Center (ASC) Covered Surgical Procedures List (CPL). It removed total hip arthroplasty (THA) from the Inpatient-Only (IPO) list, allowing for greater flexibility in outpatient settings. ASCs offer a more cost-effective alternative to hospital outpatient departments (HOPDs), with lower facility fees driving payer incentives to shift volume to outpatient environments.


Orthobiologics and Regenerative Therapies

Orthobiologics—including platelet-rich plasma (PRP), bone graft substitutes, and stem cell therapies—represent an evolving subsegment of the orthopedic market. The market is projected to see significant incremental growth, with forecasts estimating a valuation increase of over USD 3 billion by 2030. Clinical research continues to explore the efficacy of these therapies in areas such as rotator cuff repair and knee OA management. Regulatory bodies are increasingly adapting to accommodate these combination products, as the industry shifts toward integrated biologic and hardware solutions.


Restraints Impact Analysis

The restraint impact percentages below are directional estimates of drag on the overall CAGR. Overlapping effects and mitigation actions mean the gross negative total does not subtract linearly from the 4.90% projected growth rate.

Restraint ~% Impact on CAGR Geographic Relevance Impact Timeline
Reimbursement pressure and price controls –0.6% North America, Europe Short-term (≤2 yr)
EU MDR compliance burden –0.4% Europe Medium-term (2–4 yr)
Raw material and titanium cost volatility –0.3% Global Short-term (≤2 yr)
Skilled surgeon shortage for robotic systems –0.3% Asia-Pacific, South America Long-term (≥4 yr)
Volume-based procurement pricing in China –0.2% Asia-Pacific Medium-term (2–4 yr)


Reimbursement Pressure and Price Controls

Average selling prices for primary hip and knee implants in the United States declined roughly 3–5% annually between 2020 and 2024 as commercial payers adopted reference-based pricing and bundled payment models [12]. CMS's Comprehensive Care for Joint Replacement (CJR) program imposes gainsharing and risk corridors that squeeze device margins, compelling manufacturers to offset unit price declines with robotic platform service contracts and value-added analytics. In the Orthopedic Devices Market, margin compression represents the single largest near-term headwind.

EU Medical Device Regulation Compliance

The full implementation of EU MDR 2017/745 has forced device companies to re-certify legacy products through notified bodies whose capacity remains constrained. Industry estimates suggest that 15–20% of orthopedic SKUs available under the prior Medical Devices Directive may be withdrawn rather than re-certified, particularly lower-volume specialty implants [7]. This contraction limits product variety in European markets and delays the introduction of innovative designs that could accelerate the Orthopedic Devices Market growth in the region.

Raw Material and Supply Chain Volatility

Titanium alloy — the backbone of load-bearing implant manufacturing — experienced spot-price increases of more than 40% between 2021 and 2023, driven by aerospace demand and geopolitical disruptions in the Russian supply chain [13]. While prices moderated in 2024, cobalt-chromium and ultra-high-molecular-weight polyethylene also face periodic supply tightness. These input cost swings compress gross margins, particularly for mid-tier Orthopedic Devices Market participants that lack the hedging scale of the top-five players.


Orthopedic Devices Market Opportunities

Smart Implants and Continuous Remote Monitoring

Sensor-embedded knee and hip implants that transmit real-time load, temperature, and motion data to cloud dashboards are advancing from clinical trials toward commercial launch. Early evidence from 500-patient registries shows that remote monitoring can detect early loosening or infection signals 8–12 weeks before symptomatic presentation, reducing revision surgery rates by an estimated 10–15% [11]. This data-enabled aftercare model creates a recurring revenue stream within the Orthopedic Devices Market that shifts economics from episodic hardware sales toward outcome-based service contracts.

Ambulatory Surgical Center Expansion Beyond North America

While the US leads outpatient joint replacement adoption, European and Asia-Pacific markets are only beginning to develop regulatory frameworks for same-day arthroplasty. Germany's selective contracting system and India's Ayushman Bharat scheme are exploring bundled ASC reimbursement pilots that could unlock substantial procedural volumes. Manufacturers that partner early with ASC chains in these markets will gain formulary positioning before competitive intensity rises.

Personalized 3-D Printed Implants in Emerging Markets

Declining additive manufacturing costs — metal sintering machine prices fell approximately 30% between 2020 and 2025 — are making patient-specific implant production viable in countries with fragmented implant distribution networks [2]. Hospitals in Brazil, South Africa, and Southeast Asia can now produce custom oncology reconstruction plates or complex revision components on-site, reducing import dependency and lead times. This localization opportunity repositions the Orthopedic Devices Market supply chain toward decentralized manufacturing.

Data Monetization Through Registry Analytics

National joint replacement registries contain decades of outcome data that, when harmonized with implant design metadata, offer device companies actionable product development intelligence. Companies that build proprietary analytics platforms around registry data can optimize implant geometry iterations, predict early failure modes, and generate real-world evidence packages that accelerate regulatory submissions.

Regenerative Orthopedics in Aging Asian Populations

Japan and South Korea, two of the most rapidly aging nations globally, have established expedited regulatory pathways for regenerative medicine products under Japan's PMDA and Korea's MFDS frameworks [3]. Bone morphogenetic proteins and cell-based cartilage repair therapies represent a high-margin opportunity for Orthopedic Devices Market leaders willing to navigate these specialized approval processes.


Orthopedic Devices Market Future Outlook

AI-Driven Pre-Operative Planning and Intra-Operative Guidance

Artificial intelligence is entering the orthopedic operating theater at multiple points. Deep-learning algorithms trained on millions of radiographic images can now predict optimal implant size, position, and alignment with accuracy exceeding 95%, reducing intra-operative adjustments and shortening procedure times [18]. By 2030, integrated AI-robotic workflows — where the pre-operative plan directly programs the robotic arm — are expected to become the default in high-volume centers, reinforcing the premium-tier segment of the Orthopedic Devices Market.

Platform Economics and Bundled Robotic Ecosystems

Device companies are shifting from selling individual implants toward bundled platform models where the robotic system, implant portfolio, digital planning software, and post-operative monitoring form a single commercial offering. Stryker's ecosystem approach with Mako and Johnson & Johnson's Velys platform exemplifies this strategy, locking in multi-year contracts that raise switching costs and stabilize revenue visibility. This platform economics shift will concentrate the Orthopedic Devices Market among companies with the capital to invest across the full care pathway.

Sustainability and Circular Supply Chains

Environmental scrutiny of single-use surgical instrument trays — which generate an estimated 20–30% of operating room waste — is driving demand for reusable and recyclable instrument sets [19]. Several Orthopedic Devices Market leaders have pledged carbon-neutral manufacturing by 2035, and titanium recycling programs are emerging as both a cost-reduction and ESG initiative. Hospitals incorporating sustainability metrics into procurement criteria will increasingly favor suppliers with transparent environmental footprints.

Decentralized Manufacturing via Point-of-Care 3-D Printing

Additive manufacturing is evolving from centralized factory production to hospital-based point-of-care fabrication. The FDA's 2024 guidance framework for distributed manufacturing establishes quality-system expectations for in-hospital 3-D printing labs, paving the way for same-day custom implant production [2]. This paradigm shift could fundamentally restructure the Orthopedic Devices Market distribution models by reducing inventory carrying costs and eliminating the need for extensive implant consignment sets.


Orthopedic Devices Market Segmentation

By Product Type

Segment Key Metric Primary Demand Driver
Joint Replacement Implants 38.3% share (2025) Aging population; rising hip and knee arthroplasty volumes
Spinal Implants USD 11.74 billion (2025) Degenerative disc disease; minimally invasive fusion adoption
Trauma Fixation Devices 5.20% CAGR (2026–2035) Road traffic injuries; geriatric fracture incidence
Sports Medicine Devices USD 6.04 billion (2025) Rising sports participation; arthroscopic procedure growth
Others (Orthobiologics, Bracing) 10.80% CAGR (2026–2035) Regenerative medicine advances: post-operative rehabilitation


Joint replacement implants remain the revenue backbone of the Orthopedic Devices Market, with hip and knee systems collectively representing the majority of this segment. Cementless fixation technologies and highly cross-linked polyethylene bearings have extended implant survivorship beyond 20 years, shifting surgical indication thresholds toward younger, more active patients. Partial knee replacement (unicompartmental arthroplasty) is gaining share within the category, enabled by robotic precision that makes the procedure reproducible across a wider surgeon skill spectrum.

Spinal implants constitute the second-largest product segment, driven by degenerative disc disease in aging populations and the expanding adoption of minimally invasive lateral and posterior lumbar interbody fusion techniques. The shift from open to percutaneous pedicle-screw fixation reduces tissue disruption and accelerates patient discharge, aligning with hospital throughput objectives. Meanwhile, the "Others" category — encompassing orthobiologics, joint replacement systems, and external fixation — is the fastest-expanding segment, propelled by double-digit growth in bone graft substitutes and PRP therapies.

By Technology

Segment Key Metric Primary Demand Driver
Conventional Implants 44.5% share (2025) Established clinical evidence; lower capital threshold
3-D Printed Patient-Specific Implants 8.90% CAGR (2026–2035) Custom fit; reduced revision risk
Robotic-Assisted & Navigation Systems 10.50% CAGR (2026–2035) Alignment precision; ASC-compatible workflows
Others (Smart/Sensor-Embedded) USD 1.92 billion (2025) Continuous post-operative monitoring demand


Conventional implants still dominate the Orthopedic Devices Market by installed volume, benefiting from decades of clinical registry data, broad surgeon familiarity, and lower per-procedure costs. Yet their share is structurally declining as robotic-assisted systems demonstrate measurable improvements in component alignment and patient-reported outcomes. Hospitals and ASCs that adopt robotic platforms typically increase their procedure volumes by 15–25% within two years of installation, accelerating the return on capital investment [8].

By End User

Segment Key Metric Primary Demand Driver
Hospitals 50.8% share (2025) Complex revision and polytrauma cases
Ambulatory Surgical Centers 9.40% CAGR (2026–2035) Same-day joint replacement: cost efficiency
Specialty Clinics USD 5.72 billion (2025) Sports medicine and rehabilitation demand
Others 3.80% CAGR (2026–2035) Home-based post-operative monitoring; telemedicine


Hospitals retain the largest share of the Orthopedic Devices Market end-user spending because complex revision arthroplasty, multi-level spinal fusion, and polytrauma reconstruction require inpatient infrastructure and multidisciplinary teams. ASCs, however, are the clear growth vector: CMS data shows that outpatient total joint volumes in the US grew by approximately 22% annually between 2020 and 2024 [9]. Specialty orthopedic clinics — particularly those focused on sports medicine and fracture fixation — occupy a mid-tier position, handling arthroscopic procedures and simple fracture management.


Regional Market Share Analysis

Region Key Metric (2025) Primary Investment Themes
North America 39.7% revenue share Robotic adoption, ASC migration, bundled payments
Europe 27.0% revenue share MDR compliance, value-based procurement, and aging demographics
Asia-Pacific 9.4% CAGR (2026–2035) Insurance expansion, localized manufacturing, volume-based procurement
South America USD 3.18 billion Import substitution, public hospital modernization
Middle East & Africa USD 4.00 billion Healthcare infrastructure build-out, medical tourism
Total USD 63.56 billion

The Orthopedic Devices Market exhibits a distinct geographic hierarchy, with mature Western markets dominating revenue while Asia-Pacific contributes the strongest growth.


North America

Country Key Metric Key Driver
United States 82.5% of regional share Largest installed base of robotic surgical systems
Canada 9.8% of regional share Provincial single-payer bulk purchasing
Mexico 7.7% of regional share Medical tourism and nearshoring of implant manufacturing


The United States alone accounts for roughly four out of five dollars spent in the North American Orthopedic Devices Market, underpinned by the highest per-capita joint replacement rate among OECD nations and a commercial payer landscape that still reimburses robotic-assisted procedures at a premium. Canada's single-payer provinces negotiate implant pricing centrally, exerting moderate downward price pressure but ensuring stable procedural volumes. Mexico's growing medical tourism sector — particularly in Monterrey and Guadalajara — is attracting multinational device companies to establish finishing and sterilization facilities closer to the US border [15].

Europe

Country Key Metric Key Driver
Germany 5.12% CAGR (2026–2035) Selective contracting reform and endoprosthesis registry
United Kingdom USD 2.92 billion (2025) NHS elective recovery plan investing £8 billion through 2028 [16]
France 16.8% of regional share Haute Autorité de Santé (HAS) reimbursement expansion
Italy 12.4% of regional share Aging population; second-highest hip replacement rate in Europe
Spain 4.70% CAGR (2026–2035) Public hospital capital renewal cycle
Nordic Countries 8.3% of regional share High adoption of digital surgical planning tools
Russia 3.10% CAGR (2026–2035) Import substitution policies favoring domestic production
Rest of Europe USD 1.85 billion (2025) Heterogeneous growth across Central and Eastern European systems


European healthcare systems are collectively navigating the tension between MDR compliance costs and the urgency to clear post-COVID surgical backlogs [7]. The UK's elective recovery program represents one of the most significant public investment commitments in orthopedic infrastructure this decade, with dedicated surgical hubs designed to perform 30% more joint replacement procedures annually by 2028 [16]. Germany's endoprosthesis registry, now covering over 95% of hip and knee implantations, provides a powerful feedback loop that favors evidence-backed device designs in the Orthopedic Devices Market.

Asia-Pacific

Country Key Metric Key Driver
China 8.90% CAGR (2026–2035) Volume-based procurement is driving domestic manufacturer scale
India 10.20% CAGR (2026–2035) Ayushman Bharat coverage of joint replacement
Japan USD 5.18 billion (2025) Super-aged society with >29% population over 65
South Korea 7.80% CAGR (2026–2035) MFDS fast-track for regenerative orthopedic products
ASEAN USD 1.72 billion (2025) Medical tourism and rising middle-class insurance uptake
Rest of Asia-Pacific 6.50% CAGR (2026–2035) Infrastructure build-out in Vietnam, Bangladesh


Asia-Pacific is the defining growth story for the Orthopedic Devices Market over the next decade. China's national volume-based procurement (VBP) program slashed average joint implant prices by 80% in early rounds, dramatically expanding procedural access but compressing margins for imported brands [6]. India's Ayushman Bharat initiative covers knee replacement for 500 million beneficiaries, creating a massive volume opportunity for cost-optimized implant lines. Japan's status as the world's most aged major economy sustains premium-tier implant demand even as population size contracts.

South America

Country Key Metric Key Driver
Brazil 62.0% of regional share SUS public health system modernization
Argentina 20.5% of regional share Private-sector surgical center expansion
Rest of South America 17.5% of regional share Growing insurance penetration in Colombia and Chile


Brazil's Unified Health System (SUS) remains the dominant purchaser of orthopedic hardware in South America, and recent federal budget allocations earmarked BRL 4.2 billion for elective surgery backlog reduction through 2027. Argentina's private clinic network has grown by 12% since 2021, attracting device companies to establish direct distribution rather than relying on intermediaries. Across the continent, the Orthopedic Devices Market is transitioning from pure importation toward partial local assembly to navigate currency volatility and import tariffs.

Middle East & Africa

Country Key Metric Key Driver
Saudi Arabia 28.0% of regional share Vision 2030 healthcare infrastructure spending
UAE 7.60% CAGR (2026–2035) Medical tourism hub positioning
South Africa 22.0% of regional share Largest private hospital network on the continent
Egypt 6.80% CAGR (2026–2035) Universal health insurance rollout
Rest of MEA USD 1.26 billion (2025) Fragmented but accelerating public procurement


Saudi Arabia's Vision 2030 program has committed over USD 65 billion to healthcare infrastructure, including ten new specialized hospitals with dedicated orthopedic surgical suites [17]. The UAE positions itself as a regional medical tourism destination, with Dubai and Abu Dhabi performing an estimated 8,000 joint replacements annually for international patients. South Africa's Netcare and Mediclinic hospital groups anchor the sub-Saharan Orthopedic Devices Market, though access outside private networks remains limited by affordability constraints.


Orthopedic Devices Market By Region, 2025-2035

Competitive Benchmarking

The Orthopedic Devices Market is moderately concentrated, with the top five companies anticipated to account for 55–62% of worldwide sales. The estimated Herfindahl-Hirschman Index (HHI) is in the range of 1,100-1,400, which indicates that the market is somewhat concentrated. The race is on to differentiate robotic platforms, broaden implant offerings and lock in surgeons with training and education initiatives.

Company Est. Revenue Share Range Key Offerings Strategic Positioning
Johnson & Johnson (DePuy Synthes) ~18–22% Velys robotic system; Attune knee; Synthes trauma Broadest portfolio across all segments
Stryker Corporation ~14–17% Mako robotic platform; Triathlon knee; T2 trauma nailing Robotic-first ecosystem strategy
Zimmer Biomet ~10–13% ROSA robotics; Persona knee; Mobi-C cervical disc Integrated digital surgery platform
Medtronic ~7–9% Mazor X spine robotics; O-arm imaging; Infuse bone graft Spine and navigation technology leader
Smith & Nephew ~6–8% CORI surgical system; Oxinium bearings; PICO wound care Focus on sports medicine and ASC channels
Globus Medical ~3–5% ExcelsiusGPS spine robot; Creo MIS spinal implants Pure-play spine with expanding robotics
Arthrex ~3–5% SynergyHD3 imaging; InternalBrace; SutureBridge anchors Dominant in sports medicine education
B. Braun ~2–4% Aesculap spinal systems; trauma plating; orthopedic power tools European market penetration
Integra LifeSciences ~1–3% Cadence total ankle; regenerative wound care Extremities and regenerative niche
ConMed Corporation ~1–2% EDGE coagulation; AirSeal insufflation; sports anchors Arthroscopic and general surgery crossover


Recent News & Developments


  • Smith & Nephew (2019): Smith & Nephew acquired the Brainlab orthopedic joint reconstruction business in 2019 to integrate its digital workflow and navigation technologies into the CORI robotic ecosystem.
  • Globus Medical (August 2023): Completed the merger with NuVasive, creating a combined entity with USD 3.8 billion in spine and trauma revenue and strengthening its competitive position in the Orthopedic Devices Market. [Ref 23]


Orthopedic Devices Market Report Scope

Parameter Detail
Market Scope Orthopedic Devices Market — implants, instruments, robotics, orthobiologics, bracing
Study Period 2021–2035
CAGR (Forecast) 4.90% (2026–2035)
Market Size — Base Year (2025) USD 63.56 billion
Market Size — End Year (2035) USD 102.40 billion
Fastest Growing Segment Orthobiologics (10.80% CAGR)
Companies Profiled 10 (Johnson & Johnson, Stryker, Zimmer Biomet, Medtronic, Smith & Nephew, Globus Medical, Arthrex, B. Braun, Integra LifeSciences, ConMed)
Valuation Currency USD billion


FAQs

How does robotic-assisted surgery influence implant vendor selection at hospitals?
Hospitals that adopt a robotic platform typically commit to that vendor's implant portfolio for 5–7 years due to integration lock-in. This raises switching costs and makes the initial robotic capital decision a long-term Orthopedic Devices Market share determinant.
What procurement model changes should device buyers anticipate through 2030?
Outcome-based contracts linking implant pricing to revision rates and patient-reported scores are replacing traditional per-unit purchasing. Buyers should negotiate performance guarantees backed by registry data.
How do ASC-compatible implant designs differ from hospital-grade systems?
ASC-optimized systems prioritize reduced instrument tray counts, single-use disposable cutting guides, and faster sterilization cycles. These design trade-offs lower per-procedure overhead while maintaining equivalent clinical outcomes.
What regulatory pathway applies to AI-enabled surgical planning software?
Most AI-based planning tools follow the FDA's 510(k) pathway as Class II devices with predetermined change-control plans. The EU classifies them under MDR Class IIa, requiring notified-body review.
How does China's volume-based procurement reshape global pricing benchmarks?
VBP-driven price reductions of 60–80% in China create reference-pricing pressure across Southeast Asia and Latin America. Multinational Orthopedic Devices Market players must develop tiered product strategies to protect premium-market margins.
What reimbursement barriers slow orthobiologics adoption?
Many payers classify PRP and stem-cell therapies as experimental, limiting coverage to clinical-trial settings. Reimbursement codes remain inconsistent across CMS, private insurers, and European health technology assessment bodies.
How can mid-tier Orthopedic Devices Market companies compete against the top-five incumbents?
Niche specialization in high-growth subsegments — such as extremity implants or patient-specific 3-D printed devices — enables mid-tier firms to avoid direct competition with platform-scale incumbents.    
Author
Author
Author Profile
Satyendra Maurya LinkedIn
Research Analyst
An accomplished research analyst with high proficiency in market forecasting, data visualization, competitive benchmarking, and others. He holds a pronounced track record in research and consulting projects for sectors such as life sciences, medical devices, and healthcare IT. His capabilities in qualitative and quantitative analysis have resulted in positive client outcomes. Working on niche market trends, opportunities, sales, and forecasted value is part of his skill set.
Co-Author
Co-Author Profile
Rahul Gotadki LinkedIn
Research Manager
He holds an experience of about 9+ years in Market Research and Business Consulting, working under the spectrum of Life Sciences and Healthcare domains. Rahul conceptualizes and implements a scalable business strategy and provides strategic leadership to the clients. His expertise lies in market estimation, competitive intelligence, pipeline analysis, customer assessment, etc.

Research Approach


Secondary Research

The secondary research process involved comprehensive analysis of regulatory databases, peer-reviewed orthopedic journals, clinical publications, and authoritative health organizations. Key sources included the US Food & Drug Administration (FDA) Center for Devices and Radiological Health (CDRH) MAUDE database and 510(k) premarket notifications, European Medicines Agency (EMA) medical device regulations, Health Canada Medical Devices Bureau, Therapeutic Goods Administration (TGA) Australia, Pharmaceuticals and Medical Devices Agency (PMDA) Japan, and National Medical Products Administration (NMPA) China. Professional and clinical sources comprised the American Academy of Orthopaedic Surgeons (AAOS) National Joint Registry and clinical practice guidelines, American Association of Hip and Knee Surgeons (AAHKS), North American Spine Society (NASS) guidelines, International Society of Orthopaedic Surgery and Traumatology (SICOT), Orthopaedic Research Society (ORS), American College of Surgeons (ACS) National Surgical Quality Improvement Program (NSQIP), and Centers for Medicare & Medicaid Services (CMS) Physician Fee Schedule and hospital outpatient data. Government health statistics were sourced from the CDC National Center for Health Statistics (NHANES, National Hospital Ambulatory Medical Care Survey), National Institutes of Health (NIH) National Institute of Arthritis and Musculoskeletal and Skin Diseases (NIAMS), World Health Organization (WHO) Global Burden of Disease Study, OECD Health Statistics, EU Eurostat Healthcare Database, and national joint registry reports from key markets (UK NJR, Australian Orthopaedic Association National Joint Replacement Registry).

These sources were employed to compile clinical safety studies, regulatory clearance data, reimbursement trends, competitive landscape analysis, joint reconstruction device volumes, spinal fusion statistics, orthobiologics, and trauma fixation systems.


Primary Research

Qualitative and quantitative insights were obtained by interviewing supply-side and demand-side stakeholders during the primary research process. From orthopedic device manufacturers, implant OEMs, and biomaterial suppliers, supply-side sources comprised CEOs, Presidents of Orthopedic Divisions, VPs of Research & Development, global regulatory affairs chiefs, and commercial directors. Demand-side sources included department chiefs of orthopedic surgery, hospital vice presidents of supply chain and procurement, materials management directors, ambulatory surgical center administrators, and board-certified orthopedic surgeons (who specialize in spine, sports medicine, trauma, and joint replacement). Primary research has confirmed the product pipeline timelines for smart implants and robotic-assisted platforms, validated market segmentation across hip/knee reconstruction and spinal device categories, and gathered insights on hospital purchasing patterns, GPO (Group Purchasing Organization) contracting dynamics, and outpatient migration trends for orthopedic procedures.

Primary Respondent Breakdown:

By Designation: C-level Primaries (30%), Director Level (32%), Others (38%)

By Region: North America (32%), Europe (30%), Asia-Pacific (28%), Rest of World (10%)


Market Size Estimation

Revenue mapping, procedure volume analysis, and implant pricing intelligence were implemented to determine global market valuation. The methodology comprised the following:

Identification of 45+ significant manufacturers in North America, Europe, Asia-Pacific, and Latin America, including specialized players in spine biologics, trauma fixation, and arthroscopy

Joint reconstruction (hip/knee/shoulder implants), spinal devices (fusion/cervical/thoracolumbar), orthobiologics (bone graft substitutes, growth factors), cranial orthoses, and support devices (braces, prostheses) are all included in the product mapping.

Examination of annual revenues that are specific to orthopedic implant portfolios, excluding non-orthopedic business segments, as reported and modeled

Ensuring representation across metal, polymer, ceramic, and biodegradable material categories, the coverage of manufacturers represents 70-75% of the global market share in 2024.

The validation of procedure volume in key markets is conducted using national joint registry data, Medicare claims analysis, and hospital discharge databases.

Segment-specific valuations for joint reconstruction, spinal devices, and orthobiologics are derived through extrapolation using bottom-up (procedure volume × ASP by country, stratified by hospital vs. ASC settings) and top-down (manufacturer revenue validation against WHO global disease burden data) approaches.

Download Free Sample

Kindly complete the form below to receive a free sample of this Report

Download PDF ×

We do not share your information with anyone. However, we may send you emails based on your report interest from time to time. You may contact us at any time to opt-out.
















