Osteoarthritis Therapeutics Market (2026 - 2035)

Osteoarthritis Market Research Report By Treatment Type (Medication, Surgery, Therapy), By Diagnosis (Imaging, Joint Fluid Analysis), By Route of Administration (Oral, Topical, Parenteral), By Disease Type (Knee Osteoarthritis, Spine Osteoarthritis, Foot & Ankle Osteoarthritis, Shoulder Osteoarthritis, Hand Osteoarthritis) and By Regional (North America, Europe, South America, Asia Pacific, Middle East and Africa) - Industry Forecast to 2035.
ID: MRFR/Pharma/1078-HCR
90 Pages
Nidhi Mandole, Rahul Gotadki
Last Updated: July 10, 2026
Osteoarthritis Therapeutics Market
Market Size
Forecast Period2026-2035
CAGR (2026-2035)5.10%
2025 Market SizeUSD 8.21 Billion
2035 Market SizeUSD 13.51 Billion
Key Players
Pfizer Inc.
Johnson & Johnson
Sanofi S.A.
Bayer AG
Bioventus Inc.
Anika Therapeutics
Opportunities
  • Disease-Modifying Osteoarthritis Drug Breakthroughs
  • Digital Therapeutics and AI-Enabled Remote Monitoring
  • Emerging Market Penetration in Southeast Asia and Latin America

Osteoarthritis Market Summary

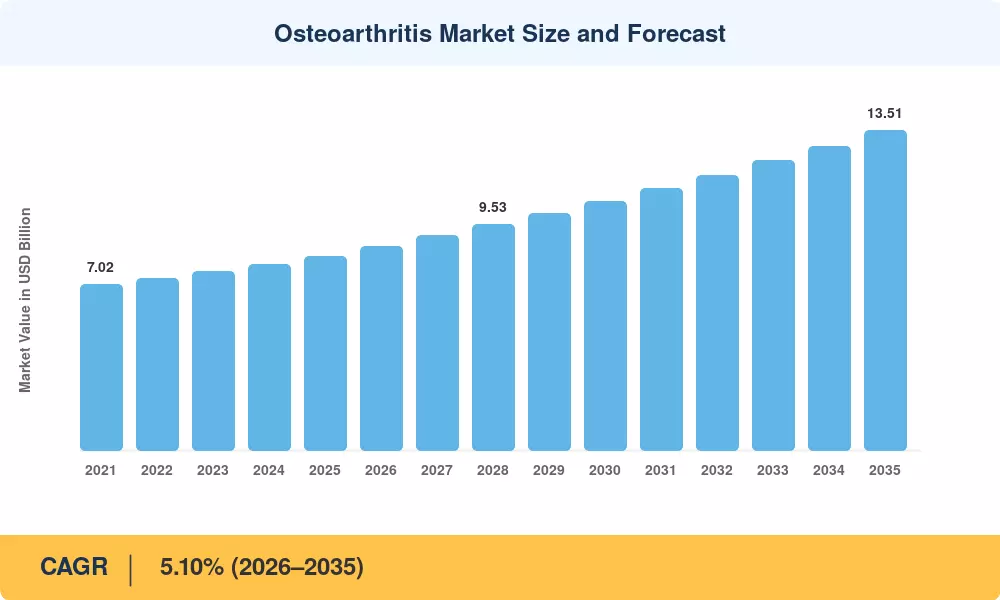
The Osteoarthritis Market size was valued at USD 8.21 Billion in 2025, and the market is projected to grow from USD 8.63 Billion in 2026 to USD 13.51 Billion by 2035, registering a CAGR of 5.10% during the forecast period 2026–2035. The rising prevalence of degenerative joint conditions among aging populations worldwide, combined with WHO projections indicating that over 500 million adults live with osteoarthritis globally, has elevated this therapeutic area to a healthcare spending priority [1]. National reimbursement reforms in the U.S. and EU are channeling hospital budgets toward minimally invasive interventions that delay costly total joint replacements, sustaining demand across pharmaceutical and device segments alike [2].

Treatment paradigms are shifting from symptom-only management toward disease-modification ambitions. Conventional oral anti-inflammatory regimens still anchor first-line care, yet clinicians are progressively adopting topical formulations and extended-release injectable therapies that improve safety profiles. Regulatory bodies, including the FDA and EMA, have fast-tracked several pipeline assets targeting nerve growth factor pathways and Wnt-signaling modulators, signaling a potential inflection point for the Osteoarthritis Market over the coming decade [3]. Biopharma investment in regenerative cartilage programs exceeded USD 2.8 billion cumulatively between 2022 and 2025 [4].

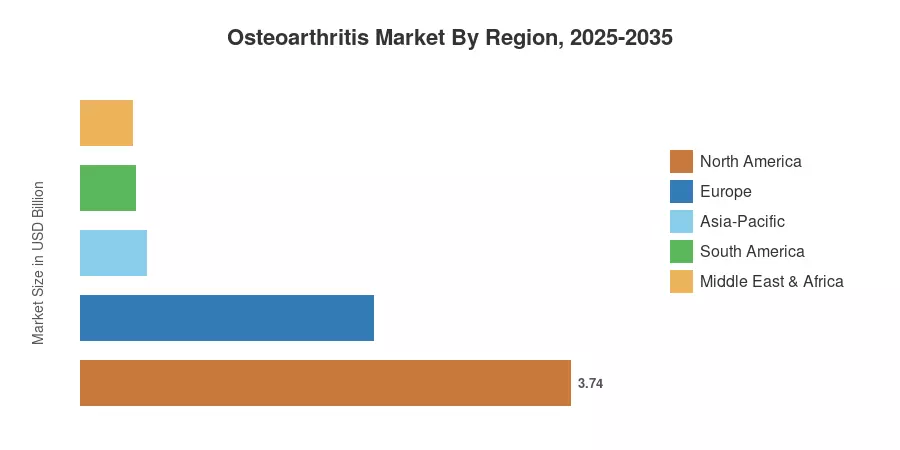
North America leads the Osteoarthritis Market with a 45.6% revenue share, driven by high per-capita pharmaceutical expenditure and broad private insurance coverage. Asia-Pacific is the fastest-growing region at a projected CAGR of 6.05%, propelled by rapidly expanding middle-class populations in China and India seeking specialist orthopedic care. Europe holds the second-largest share at 27.3%, supported by universal healthcare frameworks that encourage standardized treatment protocols. As demographic pressures intensify globally, the Osteoarthritis Market is poised for sustained, broad-based expansion through 2035.


Key Report Takeaways

• By Drug Class

  • NSAIDs commanded a 44.3% share of the Osteoarthritis Market in 2025, remaining the dominant therapeutic category due to cost-effectiveness and wide formulary inclusion.
  • Single-injection hyaluronic acid products are forecast to expand at a 7.05% CAGR through 2035, reflecting clinician preference for viscosupplementation that delays surgical intervention.

• By Anatomy

  • Knee osteoarthritis accounted for 50.1% of the Osteoarthritis Market in 2025, correlating with the joint's high mechanical load-bearing burden.
  • Shoulder cases are projected to advance at a 7.24% CAGR through 2035 as diagnostic imaging improvements increase detection rates.

• By Region

  • North America retained a 45.6% revenue share of the Osteoarthritis Market in 2025, anchored by the United States' outsized pharmaceutical spending.
  • The Asia-Pacific region is projected to grow at a 6.05% CAGR through 2035, led by rising healthcare access in China and India.


Osteoarthritis Market Size and Forecast (2021–2035)

Market Research Future's estimates draw on primary interviews with orthopedic specialists, hospital procurement officers, and pharmaceutical executives, triangulated against national health expenditure databases, prescription audit data from IQVIA, and proprietary demand models calibrated to demographic projections from the United Nations Population Division [1][5].
Osteoarthritis Market Size and Forecast
Our Impact
Enabled $4.3B Revenue Impact for Fortune 500 and Leading Multinationals
Partnering with 2000+ Global Organizations Each Year
30K+ Citations by Top-Tier Firms in the Industry

Driver Impact Analysis

Driver ~% Impact on CAGR Geographic Relevance Impact Timeline
Aging global population +1.4% Global Long-term (≥4 yr)
Rising obesity prevalence +0.9% North America, Europe Medium-term (2–4 yr)
Shift to topical/injectable formulations +0.7% North America, Asia-Pacific Short-term (≤2 yr)
Expanded insurance coverage in emerging markets +0.6% Asia-Pacific, South America Medium-term (2–4 yr)
Pipeline disease-modifying OA drugs +0.5% Global Long-term (≥4 yr)
Digital health integration in chronic care +0.4% North America, Europe Medium-term (2–4 yr)
Hospital budget reallocation from arthroplasty +0.3% Europe, North America Short-term (≤2 yr)


Aging Global Population and Expanding Patient Pool

The United Nations projects that the global population aged 60 and above will reach 2.1 billion by 2050, nearly doubling from 2020 levels [1]. Osteoarthritis prevalence rises sharply after age 50, and the Osteoarthritis Market benefits directly from this demographic shift. The WHO Global Burden of Disease study estimates that disability-adjusted life years attributable to osteoarthritis increased by 48% between 2000 and 2020, underscoring the growing therapeutic demand that healthcare systems must address [11].

Rising Obesity Rates Across Developed Economies

The CDC reports that adult obesity prevalence in the United States exceeded 42% in 2024, a figure that carries outsized implications for weight-bearing joint disease [2]. Excess body mass accelerates cartilage degradation in knees and hips, pulling patients into treatment pathways earlier and prolonging their therapeutic journey. The Osteoarthritis Market in North America derives measurable uplift from this trend, as obese patients consume roughly 1.7 times more anti-inflammatory prescriptions than their normal-weight counterparts [14].

Shift Toward Injectable and Topical Formulations

Gastrointestinal and cardiovascular safety warnings associated with chronic oral NSAID use have prompted prescribers to pivot toward topical diclofenac gels and single-injection viscosupplements [9]. The American College of Rheumatology's 2024 updated guidelines conditionally recommend topical NSAIDs over oral formulations for patients aged 65 and above, a policy shift that is reshaping prescribing volumes within the Osteoarthritis Market [15].

Insurance Expansion in Emerging Economies

India's Ayushman Bharat scheme now covers over 500 million beneficiaries for secondary and tertiary orthopedic procedures, while China's National Healthcare Security Administration has expanded its essential drug list to include hyaluronic acid injectables [12]. These policy actions are pulling previously underserved populations into formal treatment channels and accelerating the Osteoarthritis Market growth trajectory across Asia-Pacific.


Restraints Impact Analysis

Restraint ~% Impact on CAGR Geographic Relevance Impact Timeline
Reimbursement limitations for novel therapies −0.6% North America, Europe Medium-term (2–4 yr)
Evidence gaps for disease-modifying drugs −0.5% Global Long-term (≥4 yr)
Generic NSAID price erosion −0.4% Global Short-term (≤2 yr)
Regulatory hurdles for regenerative therapies −0.3% North America, Europe Long-term (≥4 yr)
Patient non-adherence in chronic care −0.3% Global Short-term (≤2 yr)


Reimbursement Barriers for Advanced Therapeutics

The lack of long-term efficacy data is hindering the adoption of premium-priced biologics and viscosupplements in the Osteoarthritis Market since payers are reluctant to reimburse. In the U.S., local coverage determinations for hyaluronic acid injections have been given by Medicare Administrative Contractors, resulting in a fragmented reimbursement landscape that inhibits provider adoption [16]. European health technology evaluation agencies (e.g., NICE, G-BA) set cost effectiveness requirements that novel disease-modifying candidates find difficult to meet without multi-year outcome data [18].


Generic Price Erosion Compressing Revenue per Unit

The worldwide oral NSAID segment continues to suffer pricing pressure from generics, with manufacturers from India and China competing aggressively on price. Despite increasing prescription numbers, ibuprofen and naproxen costs have fallen by an estimated 15-20% in real terms during the previous 5 years, further squeezing the income base [7]. This dynamic limits the top-line growth potential of the main medicine class in the Osteoarthritis Market.


Regulatory Complexity for Regenerative and Cell-Based Therapies

Some platelet-rich plasma and stem-cell-derived medicines are classified by the FDA inside its biologics framework (351 route) with clinical trial requirements that push commercialization timelines back 5–8 years compared to traditional medications [10]. The regulatory framework delays the entrance of next-generation medicines, which otherwise could have sped up the Osteoarthritis Market expansion.


Osteoarthritis Market Opportunities

Disease-Modifying Osteoarthritis Drug Breakthroughs

Several late stage pipeline medicines against nerve growth factor, Wnt signaling and matrix metalloproteinase pathways may change the Osteoarthritis Market from the symptom management segment to the disease modification space. Positive Phase III readouts for anti-NGF antibodies might drive a USD 2–3 billion addressable revenue expansion by 2032 [3].


Digital Therapeutics and AI-Enabled Remote Monitoring

Wearable sensor platforms that track gait patterns, joint loading, and pain biomarkers in real time are opening new commercial models for the Osteoarthritis Market. Companies integrating prescription digital therapeutics with pharmaceutical interventions can offer bundled care packages that improve adherence and generate recurring subscription revenue [13].

Emerging Market Penetration in Southeast Asia and Latin America

Countries such as Indonesia, Vietnam, Brazil, and Colombia present significant untapped patient populations where osteoarthritis diagnosis rates remain below 30% of estimated prevalence. Government investment in primary care infrastructure and essential medicine lists creates a pathway for pharmaceutical companies to expand their Osteoarthritis Market footprint at favorable margins [12].

Point-of-Care Injection Clinics and Ambulatory Models

The rise of standalone orthopedic injection clinics that perform viscosupplementation and corticosteroid procedures outside hospital settings reduces per-procedure costs by 30–40% and improves patient throughput [6]. This ambulatory shift creates new distribution and pricing dynamics within the Osteoarthritis Market.

Real-World Evidence Platforms for Payer Negotiations

Manufacturers that invest in real-world evidence databases linking treatment outcomes to healthcare cost savings can strengthen payer negotiations and expand formulary access. Outcomes-based contracting models, already piloted in oncology, represent a transferable framework for the Osteoarthritis Market that could unlock reimbursement for premium-priced therapies [16].


Osteoarthritis Market Future Outlook

AI-Driven Diagnostics and Precision Treatment Selection

Artificial intelligence algorithms trained on radiographic and MRI datasets are reaching clinical-grade accuracy for osteoarthritis staging. By 2030, AI-assisted diagnostic platforms could reduce time-to-treatment by 30–40%, enabling earlier pharmaceutical intervention and expanding the addressable Osteoarthritis Market window [13]. Companies embedding predictive analytics into their commercial offerings stand to capture differentiated positioning.

Regenerative Medicine Entering Mainstream Clinical Practice

Autologous chondrocyte implantation, mesenchymal stem cell injections, and gene therapy candidates targeting cartilage regeneration are progressing through late-stage clinical development. The WHO estimates that regenerative orthopedic therapies could address up to 15% of moderate-to-severe osteoarthritis cases by 2033, creating a high-value sub-segment within the Osteoarthritis Market [10][21].

Digital Therapeutics and Connected Care Ecosystems

Prescription digital therapeutics that combine exercise coaching, cognitive behavioral therapy modules, and remote physiotherapy monitoring are emerging as adjuncts to pharmacological treatment. The Osteoarthritis Market will increasingly integrate these platforms into bundled care models, particularly as payers in the U.S. and Germany begin issuing reimbursement codes for FDA-cleared and DiGA-listed digital health applications [13][18].

Value-Based Contracting and Outcomes-Linked Pricing

Health systems globally are transitioning from fee-for-service to value-based reimbursement frameworks. For the Osteoarthritis Market, this shift incentivizes manufacturers to demonstrate long-term functional outcomes and total cost-of-care reductions. Outcomes-based agreements linking payment to pain-score improvements and surgical deferral metrics are expected to become standard in North America and Western Europe by 2032 [16].


Osteoarthritis Market Segmentation

By Drug Class

Segment Key Metric Primary Demand Driver
NSAIDs 44.3% share (2025) Formulary ubiquity and low cost
Analgesics CAGR 4.52% (2026–2035) Adjunctive pain management protocols
Corticosteroids USD 1.25 Billion (2025) Rapid anti-inflammatory efficacy
Hyaluronic Acid CAGR 7.05% (2026–2035) Single-injection convenience
Others 9.2% share (2025) Emerging biologics and nutraceuticals


NSAIDs remain the cornerstone of the Osteoarthritis Market drug landscape, driven by decades of clinical familiarity, generic availability, and inclusion on virtually every national essential medicines list. Topical NSAID formulations are gaining ground as safety-conscious prescribers shift elderly patients away from chronic oral regimens that carry gastrointestinal and cardiovascular risk [15].

Hyaluronic acid injectables represent the fastest-growing drug class in the Osteoarthritis Market, propelled by the convenience of single-injection cross-linked formulations that provide six-month symptom relief. Payer acceptance is broadening as real-world evidence studies demonstrate that viscosupplementation can defer total knee arthroplasty by an average of 3.2 years, generating net cost savings for health systems [9][21].

By Anatomy

Segment Key Metric Primary Demand Driver
Knee 50.1% share (2025) High mechanical loading and prevalence
Hip USD 2.00 Billion (2025) Aging-related joint degeneration
Shoulder CAGR 7.24% (2026–2035) Improved diagnostic imaging uptake
Ankle CAGR 5.85% (2026–2035) Post-traumatic OA awareness
Other Anatomies 7.2% share (2025) Hand and spine OA management


Knee disease dominates the Osteoarthritis Market by anatomy, reflecting the joint's unique biomechanical vulnerability to age-related wear, obesity-linked loading, and sports-related injury. Hospital systems dedicate the largest share of their orthopedic pharmaceutical budgets to knee OA management, and the segment benefits from the broadest clinical evidence base supporting injectable interventions [14].

By Distribution Channel

Segment Key Metric Primary Demand Driver
Hospital Pharmacies 59.0% share (2025) Institutional procurement and in-patient dispensing
Retail Pharmacies USD 2.26 Billion (2025) Outpatient NSAID and analgesic prescriptions
Online Pharmacies CAGR 8.43% (2026–2035) E-commerce convenience and chronic refill automation


Hospital pharmacies lead distribution because injectable therapies — corticosteroids and viscosupplements — are administered in clinical settings and dispensed through institutional channels. Online pharmacies are the fastest-growing distribution channel within the Osteoarthritis Market, benefiting from chronic medication refill automation and home-delivery convenience that appeals to elderly patients with mobility limitations [22].

By End User

Segment Key Metric Primary Demand Driver
Hospitals 52.2% share (2025) Comprehensive diagnostic and treatment infrastructure
Orthopedic Clinics CAGR 8.19% (2026–2035) Ambulatory injection procedures
Others 19.4% share (2025) Primary care and rehabilitation centers


Hospitals command the largest end-user share of the Osteoarthritis Market due to their capacity for advanced imaging, multidisciplinary care teams, and surgical referral pathways. Orthopedic clinics are growing fastest as standalone injection centers and ambulatory surgical facilities capture procedures that historically required hospital-based settings [6].


Regional Market Share Analysis

Region Key Metric (2025) Primary Investment Themes
North America 45.6% revenue share Injectable formulary expansion, payer reform
Europe 27.3% revenue share HTA-driven treatment standardization
Asia-Pacific CAGR 6.05% (2026–2035) Insurance expansion, rising surgical volumes
South America USD 0.42 Billion Public hospital formulary inclusion
Middle East & Africa CAGR 4.85% (2026–2035) Healthcare infrastructure investment
Total USD 8.21 Billion

The Osteoarthritis Market exhibits a clear regional hierarchy, with North America maintaining revenue dominance and Asia-Pacific registering the strongest growth trajectory through 2035.


North America

Country Key Metric Key Driver
United States 83.2% of regional share Medicare Part B injectable coverage
Canada CAGR 4.95% (2026–2035) Provincial formulary harmonization
Mexico USD 0.18 Billion (2025) Seguro Popular orthopedic access expansion


The United States accounts for the vast majority of North America's Osteoarthritis Market revenue, reflecting high per-capita drug spending, broad commercial insurance coverage for specialty injectables, and an aging baby-boomer cohort entering peak osteoarthritis prevalence years. CMS reimbursement pilot programs for bundled joint-care episodes are incentivizing providers to adopt injectable therapies that defer total knee replacement, sustaining pharmaceutical demand [16].

Europe

Country Key Metric Key Driver
Germany 22.8% of regional share SHI formulary inclusion of viscosupplements
United Kingdom CAGR 4.72% (2026–2035) NHS pathway standardization
France USD 0.41 Billion (2025) Haute Autorité de Santé guidelines
Italy 12.1% of regional share Aging Mediterranean demographic profile
Spain CAGR 4.88% (2026–2035) Regional health service modernization
Nordic Countries USD 0.19 Billion (2025) High per-capita health expenditure
Russia CAGR 5.32% (2026–2035) Domestic pharmaceutical manufacturing push
Rest of Europe 14.5% of regional share EU cross-border procurement frameworks


European healthcare systems favor cost-effective interventions validated through health technology assessment, and the Osteoarthritis Market in this region is shaped accordingly. NICE's 2024 updated guidance on osteoarthritis management reinforced topical NSAIDs as first-line and conditionally recommended intra-articular corticosteroids, channeling prescribing behavior toward evidence-backed protocols [18].

Asia-Pacific

Country Key Metric Key Driver
China 38.4% of regional share NHSA essential drug list expansion
India CAGR 6.72% (2026–2035) Ayushman Bharat coverage widening
Japan USD 0.31 Billion (2025) Super-aged population dynamics
South Korea CAGR 5.91% (2026–2035) HIRA reimbursement reforms
ASEAN 11.3% of regional share Middle-class healthcare demand growth
Rest of Asia-Pacific CAGR 5.48% (2026–2035) Primary care infrastructure build-out


Asia-Pacific represents the fastest-growing region for the Osteoarthritis Market, driven by a convergence of demographic aging, urbanization-linked obesity, and government investment in universal health coverage. China's inclusion of hyaluronic acid injectables on the National Reimbursement Drug List in 2023 materially expanded patient access, while India's orthopedic device manufacturing sector is lowering treatment costs through domestic production [12].

South America

Country Key Metric Key Driver
Brazil 62.5% of regional share SUS formulary expansion
Argentina CAGR 5.15% (2026–2035) PAMI elderly healthcare coverage
Rest of South America USD 0.07 Billion (2025) Incremental primary care investment


Brazil dominates the South American Osteoarthritis Market, with the Unified Health System (SUS) progressively incorporating injectable osteoarthritis therapies into its public formulary. Private-sector orthopedic clinics in São Paulo and Buenos Aires are adopting premium viscosupplementation protocols, creating a dual-tier market structure [19].

Middle East & Africa

Country Key Metric Key Driver
Saudi Arabia 28.7% of regional share Vision 2030 healthcare spending
UAE CAGR 5.62% (2026–2035) Medical tourism and specialty clinics
South Africa USD 0.05 Billion (2025) Public hospital procurement programs
Egypt CAGR 5.08% (2026–2035) Universal health insurance rollout
Rest of MEA 27.4% of regional share NGO-supported orthopedic care programs


The Middle East & Africa Osteoarthritis Market remains nascent but is expanding as Gulf Cooperation Council countries invest heavily in specialist healthcare infrastructure. Saudi Arabia's Vision 2030 framework has allocated substantial capital to tertiary hospital construction, increasing the installed base of facilities equipped for advanced orthopedic interventions [20].


Osteoarthritis Market By Region, 2025-2035

Competitive Benchmarking

The Osteoarthritis Market exhibits medium concentration, with the top five players collectively holding an estimated 35–42% revenue share. The competitive field spans large diversified pharmaceutical companies, specialty injectable manufacturers, and orthopedic device firms that have acquired regenerative medicine assets. Market fragmentation is increasing as smaller biotech companies enter with disease-modifying pipeline candidates.

Company Est. Revenue Share Range Key Offerings for Osteoarthritis Market Strategic Positioning
Pfizer Inc. ~8–11% Celebrex (celecoxib), pipeline anti-NGF assets Broad primary care and specialty reach
Johnson & Johnson ~7–10% DePuy Synthes viscosupplements, Tylenol arthritis Integrated device-pharma portfolio
Sanofi S.A. ~5–8% Synvisc (hylan G-F 20), topical formulations Viscosupplementation market leader
Bayer AG ~4–7% Aleve (naproxen), topical analgesics OTC and Rx dual-channel strength
Bioventus Inc. ~4–6% Durolane, GELSYN-3 Single-injection HA specialist
Anika Therapeutics ~3–5% Monovisc, Orthovisc Cross-linked hyaluronic acid focus
Zimmer Biomet Holdings ~3–5% Gel-One, joint replacement portfolio Device-pharma convergence strategy
Smith & Nephew plc ~2–4% CINGAL, regenerative medicine pipeline Biologics-augmented orthopedics
Fidia Farmaceutici S.p.A. ~2–4% Hyalgan, Hyalofast European viscosupplementation pioneer
Ferring Pharmaceuticals ~2–3% Euflexxa Specialty injectable positioning
Seikagaku Corporation ~1–3% ARTZ (sodium hyaluronate) Asia-Pacific injectable leader


Recent News & Developments


  • Zimmer Biomet (November 2024) announced FDA PMA Supplement approval for their Oxford Cementless Partial Knee, based on data from an IDE study and non-clinical testing. The device showed improved fixation, longer-lasting implants and better efficiency in the operating room and is the only FDA-approved cementless partial knee implant in the U.S.


Osteoarthritis Market Report Scope

Parameter Detail
Market Scope Global Osteoarthritis Market covering pharmaceuticals, injectables, and related therapeutic products
Study Period 2021–2035
CAGR 5.10% (2026–2035)
Market Size (2025) USD 8.21 Billion
Market Size (2035) USD 13.51 Billion
Fastest Growing Segments Hyaluronic Acid (by drug class); Shoulder (by anatomy); Online Pharmacies (by distribution); Orthopedic Clinics (by end user); Asia-Pacific (by region)
Companies Profiled 11 (Pfizer, J&J, Sanofi, Bayer, Bioventus, Anika Therapeutics, Zimmer Biomet, Smith & Nephew, Fidia, Ferring, Seikagaku)
Valuation Currency USD Billion


FAQs

How do anti-NGF antibodies compare to existing injectables for pain relief in osteoarthritis?
Anti-NGF antibodies target pain pathways centrally rather than locally, offering systemic relief but carrying joint-safety signals that have delayed regulatory approvals [3]. Viscosupplements remain preferred for localized mechanical symptom management.
What reimbursement models are gaining traction for premium osteoarthritis therapies?
Outcomes-based contracts linking payment to measurable pain-score improvements and arthroplasty deferral timelines are piloting across U.S. and European payers [16]. These models shift financial risk to manufacturers.
How is the Osteoarthritis Market affected by the rise of ambulatory surgical centers?
Ambulatory centers reduce per-procedure costs by 30–40% compared to hospital settings, accelerating injectable adoption [6]. They are expanding the treatable patient base by improving access and convenience.
What role does AI play in osteoarthritis diagnosis and treatment planning?
AI algorithms trained on radiographic data can stage disease severity with specialist-level accuracy, reducing diagnostic delays [13]. Earlier diagnosis expands the pharmaceutical intervention window.
Which Osteoarthritis Market segments present the highest near-term investment returns?
Single-injection hyaluronic acid products combine high gross margins with strong clinical differentiation and growing payer acceptance [9]. Their surgical-deferral value proposition resonates with cost-conscious health systems.
How are biosimilar entrants reshaping competitive dynamics in the Osteoarthritis Market?
Biosimilar NSAIDs and corticosteroid formulations are compressing branded pricing by 15–20% in key markets [7]. Innovators are responding by shifting portfolios toward differentiated biologics.
What procurement strategies should hospital buyers consider for the Osteoarthritis Market?
Group purchasing organization contracts that bundle injectable viscosupplements with extended-release corticosteroids can reduce per-patient costs by 10–15% [6]. Volume-tiered pricing from specialty distributors offers additional savings.    
What is the current size of the osteoarthritis market?
The osteoarthritis market reached USD 8.21 billion in 2025 and is projected to reach USD 13.51 billion by 2035.
What is the CAGR of the osteoarthritis market?
The osteoarthritis market is projected to grow at a CAGR of 5.10% during the forecast period 2026–2035.
Which region leads the osteoarthritis market?
North America holds the largest share at 45.6%, while Asia-Pacific is the fastest-growing region at 6.05% CAGR.
Author
Author
Author Profile
Nidhi Mandole LinkedIn
Senior Research Analyst
She is an extremely curious individual currently working in Healthcare and Medical Devices Domain. Nidhi is comfortably versed in data centric research backed by healthcare educational background. She leverages extensive data mining and analytics tools such as Primary and Secondary Research, Statistical Analysis, Machine Learning, Data Modelling. Her key role also involves Technical Sales Support, Client Interaction and Project management within the Healthcare team. Lastly, she showcases extensive affinity towards learning new skills and remain fascinated in implementing them.
Co-Author
Co-Author Profile
Rahul Gotadki LinkedIn
Research Manager
He holds an experience of about 9+ years in Market Research and Business Consulting, working under the spectrum of Life Sciences and Healthcare domains. Rahul conceptualizes and implements a scalable business strategy and provides strategic leadership to the clients. His expertise lies in market estimation, competitive intelligence, pipeline analysis, customer assessment, etc.

Research Approach


Secondary Research

The secondary research process involved comprehensive analysis of regulatory databases, peer-reviewed rheumatology and orthopedic journals, clinical trial registries, and authoritative arthritis health organizations. Key sources included the US Food & Drug Administration (FDA), European Medicines Agency (EMA), Osteoarthritis Research Society International (OARSI), Arthritis Foundation, American College of Rheumatology (ACR), European Alliance of Associations for Rheumatology (EULAR), National Institute of Arthritis and Musculoskeletal and Skin Diseases (NIAMS/NIH), National Center for Biotechnology Information (NCBI/PubMed), Centers for Disease Control and Prevention (CDC) Arthritis Program, World Health Organization (WHO) Global Health Observatory, EU Eurostat Health Database, OECD Health Statistics, Agency for Healthcare Research and Quality (AHRQ), National Health Service (NHS) England Digital, and national health ministry reports from key markets (Japan Ministry of Health, Labour and Welfare; China National Health Commission). These sources were used to collect disease prevalence statistics, joint replacement procedure volumes, regulatory approval data for disease-modifying osteoarthritis drugs (DMOADs), clinical safety and efficacy studies, demographic aging trends, obesity prevalence correlations, and market access dynamics for viscosupplementation, NSAIDs, corticosteroids, and surgical interventions.


Primary Research

Qualitative and quantitative insights were obtained by interviewing supply-side and demand-side stakeholders during the primary research process. The supply-side sources consisted of CEOs, Presidents, VPs of Clinical Development, regulatory affairs leaders, and commercial directors from pharmaceutical manufacturers (Pfizer, Johnson & Johnson, Novartis, AbbVie, Amgen), orthopedic device manufacturers, and viscosupplement producers. Demand-side sources included hospital pharmacy directors, procurement leaders from academic medical centers, healthcare administrators from integrated delivery networks (IDNs), orthopedic surgeons (fellowship-trained in joint replacement), and board-certified rheumatologists. Market segmentation was validated across hip and spinal osteoarthritis types through primary research. Pipeline timelines for novel biologics and cell therapies were confirmed, and clinical adoption patterns for imaging diagnostics (MRI, X-ray, ultrasound) were gathered. Additionally, pricing strategies for hyaluronic acid injections versus total joint arthroplasty, reimbursement dynamics for conservative therapy versus surgical intervention, and varying surgical volumes by region were observed.

Primary Respondent Breakdown:

By Designation: C-level Primaries (32%), Director Level (30%), Others (38%)

By Region: North America (32%), Europe (28%), Asia-Pacific (32%), Rest of World (8%)


Market Size Estimation

Global market valuation was derived through revenue mapping, procedure volume analysis, and prescription data modeling. The methodology included:

Identification of 50+ key manufacturers and solution providers across pharmaceuticals (analgesics, NSAIDs, DMOADs), medical devices (joint replacement implants, arthroscopy equipment), and therapy providers (viscosupplementation, physical therapy services) across North America, Europe, Asia-Pacific, and Latin America

Product mapping across medication (oral and intra-articular), surgical intervention (total knee arthroplasty, total hip arthroplasty, spinal fusion), and non-pharmacological therapy categories

Analysis of reported and modeled annual revenues specific to osteoarthritis therapeutic portfolios, including hospital inpatient surgical revenue and outpatient pharmaceutical dispensing

Coverage of manufacturers and healthcare providers representing 75-80% of global market share in 2024

Extrapolation using bottom-up approach (segmented by country: diagnosed prevalent cases × treated cases × therapy mix × average selling price by treatment type—medication, surgery, therapy) and top-down approach (manufacturer revenue validation and pharmaceutical wholesaler data triangulation) to derive segment-specific valuations for hip osteoarthritis and spinal osteoarthritis verticals

Download Free Sample

Kindly complete the form below to receive a free sample of this Report

Download PDF ×

We do not share your information with anyone. However, we may send you emails based on your report interest from time to time. You may contact us at any time to opt-out.
















