Osteoarthritis Therapeutics Market (2026 - 2035)

ID: MRFR/Pharma/1078-HCR
90 Pages
Nidhi Mandole
Last Updated: July 10, 2026
Osteoarthritis Market Research Report By Treatment Type (Medication, Surgery, Therapy), By Diagnosis (Imaging, Joint Fluid Analysis), By Route of Administration (Oral, Topical, Parenteral), By Disease Type (Knee Osteoarthritis, Spine Osteoarthritis, Foot & Ankle Osteoarthritis, Shoulder Osteoarthritis, Hand Osteoarthritis) and By Regional (North America, Europe, South America, Asia Pacific, Middle East and Africa) - Industry Forecast to 2035.
Osteoarthritis Therapeutics Market
Market Size
Forecast Period2026-2035
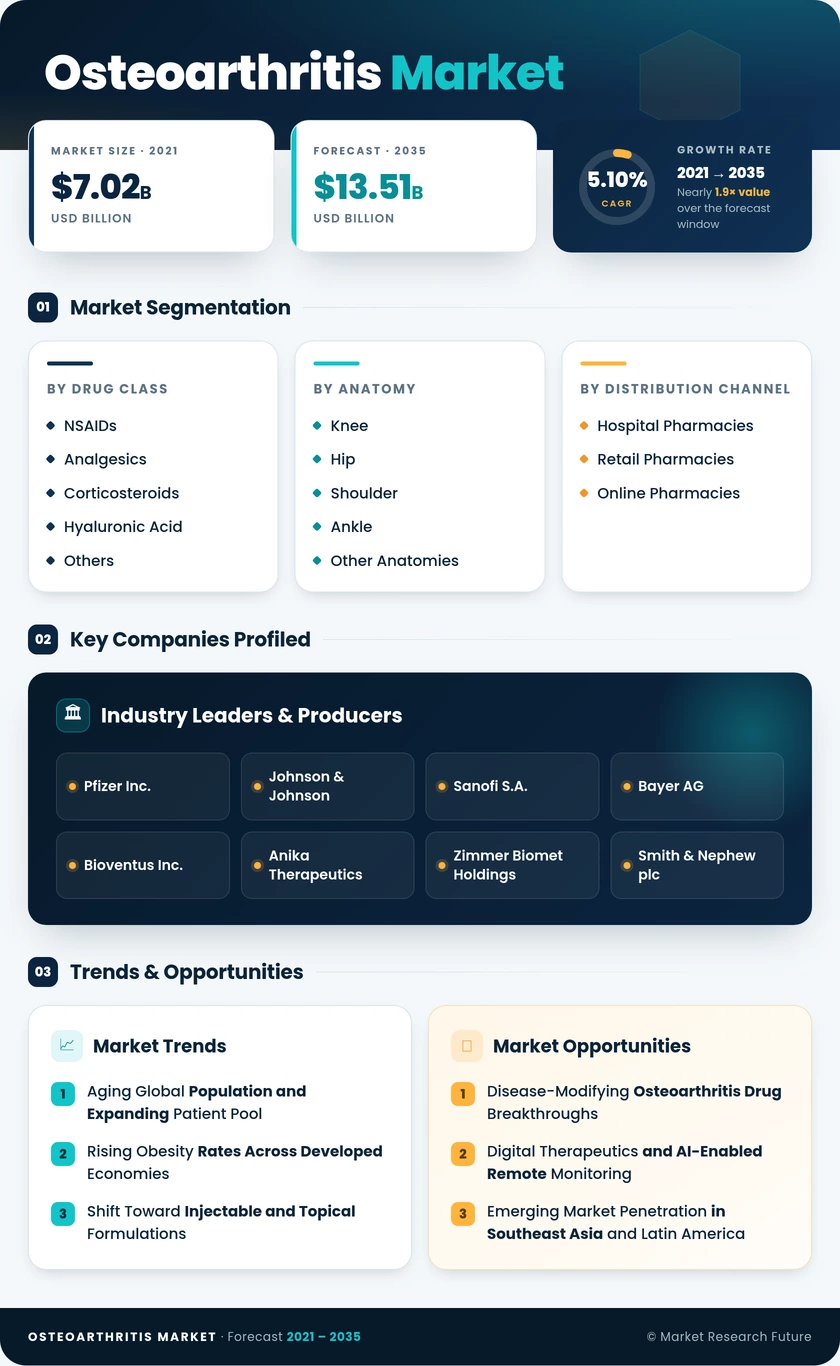
CAGR (2026-2035)5.10%
2025 Market SizeUSD 8.21 Billion
2035 Market SizeUSD 13.51 Billion
Key Players
Pfizer Inc.
Johnson & Johnson
Sanofi S.A.
Bayer AG
Bioventus Inc.
Anika Therapeutics
Opportunities
  • Disease-Modifying Osteoarthritis Drug Breakthroughs
  • Digital Therapeutics and AI-Enabled Remote Monitoring
  • Emerging Market Penetration in Southeast Asia and Latin America
  1. 1 Market Overview |
    1. 1.1 Study Assumptions & Market Definition |
    2. 1.2 Scope of the Study |
    3. 1.3 Research Methodology
  2. 2 Market Summary & Key Takeaways
  3. 3 Market Dynamics |
    1. 3.1 Market Drivers Analysis | |
      1. 3.1.1 Aging Global Population and Expanding Patient Pool | |
      2. 3.1.2 Rising Obesity Rates Across Developed Economies | |
      3. 3.1.3 Shift Toward Injectable and Topical Formulations | |
      4. 3.1.4 Insurance Expansion in Emerging Economies | |
      5. 3.1.5 Hospital Budget Reallocation from Arthroplasty | |
      6. 3.1.6 Digital Health Integration in Chronic Care | |
      7. 3.1.7 Pipeline Disease-Modifying OA Drugs |
    2. 3.2 Market Restraints Analysis | |
      1. 3.2.1 Reimbursement Barriers for Advanced Therapeutics | |
      2. 3.2.2 Generic Price Erosion Compressing Revenue per Unit | |
      3. 3.2.3 Regulatory Complexity for Regenerative and Cell-Based Therapies | |
      4. 3.2.4 Evidence Gaps for Disease-Modifying Drugs | |
      5. 3.2.5 Patient Non-Adherence in Chronic Care |
    3. 3.3 Market Opportunity Analysis | |
      1. 3.3.1 Disease-Modifying Osteoarthritis Drug Breakthroughs | |
      2. 3.3.2 Digital Therapeutics and AI-Enabled Remote Monitoring | |
      3. 3.3.3 Emerging Market Penetration in Southeast Asia and Latin America | |
      4. 3.3.4 Point-of-Care Injection Clinics and Ambulatory Models | |
      5. 3.3.5 Real-World Evidence Platforms for Payer Negotiations |
    4. 3.4 Industry Value Chain Analysis |
    5. 3.5 Porter's Five Forces Analysis
  4. 4 Global Osteoarthritis Market Size & Forecast (2021–2035) |
    1. 4.1 Historical Market Size (2021–2025) |
    2. 4.2 Current & Forecast Market Size (2026–2035) |
    3. 4.3 Market Size by Revenue (USD Billion) |
    4. 4.4 Year-over-Year Growth Analysis
  5. 5 Segmentation Analysis |
    1. 5.1 By Drug Class | |
      1. 5.1.1 NSAIDs | |
      2. 5.1.2 Analgesics | |
      3. 5.1.3 Corticosteroids | |
      4. 5.1.4 Hyaluronic Acid | |
      5. 5.1.5 Others |
    2. 5.2 By Anatomy | |
      1. 5.2.1 Knee | |
      2. 5.2.2 Hip | |
      3. 5.2.3 Shoulder | |
      4. 5.2.4 Ankle | |
      5. 5.2.5 Other Anatomies |
    3. 5.3 By Distribution Channel | |
      1. 5.3.1 Hospital Pharmacies | |
      2. 5.3.2 Retail Pharmacies | |
      3. 5.3.3 Online Pharmacies |
    4. 5.4 By End User | |
      1. 5.4.1 Hospitals | |
      2. 5.4.2 Orthopedic Clinics | |
      3. 5.4.3 Others
  6. 6 Regional Analysis |
    1. 6.1 North America | |
      1. 6.1.1 United States | |
      2. 6.1.2 Canada | |
      3. 6.1.3 Mexico |
    2. 6.2 Europe | |
      1. 6.2.1 Germany | |
      2. 6.2.2 United Kingdom | |
      3. 6.2.3 France | |
      4. 6.2.4 Italy | |
      5. 6.2.5 Spain | |
      6. 6.2.6 Nordic Countries | |
      7. 6.2.7 Russia | |
      8. 6.2.8 Rest of Europe |
    3. 6.3 Asia-Pacific | |
      1. 6.3.1 China | |
      2. 6.3.2 India | |
      3. 6.3.3 Japan | |
      4. 6.3.4 South Korea | |
      5. 6.3.5 ASEAN | |
      6. 6.3.6 Rest of Asia-Pacific |
    4. 6.4 South America | |
      1. 6.4.1 Brazil | |
      2. 6.4.2 Argentina | |
      3. 6.4.3 Rest of South America |
    5. 6.5 Middle East & Africa | |
      1. 6.5.1 Saudi Arabia | |
      2. 6.5.2 UAE | |
      3. 6.5.3 South Africa | |
      4. 6.5.4 Egypt | |
      5. 6.5.5 Rest of MEA
  7. 7 Competitive Landscape |
    1. 7.1 Market Share Analysis (2025) |
    2. 7.2 Competitive Benchmarking Matrix |
    3. 7.3 Company Profiles | |
      1. 7.3.1 Pfizer Inc. | |
      2. 7.3.2 Johnson & Johnson | |
      3. 7.3.3 Sanofi S.A. | |
      4. 7.3.4 Bayer AG | |
      5. 7.3.5 Bioventus Inc. | |
      6. 7.3.6 Anika Therapeutics | |
      7. 7.3.7 Zimmer Biomet Holdings | |
      8. 7.3.8 Smith & Nephew plc | |
      9. 7.3.9 Fidia Farmaceutici S.p.A. | |
      10. 7.3.10 Ferring Pharmaceuticals | |
      11. 7.3.11 Seikagaku Corporation
  8. 8 Future Outlook & Strategic Recommendations (2026–2035) |
    1. 8.1 AI-Driven Diagnostics and Precision Treatment Selection |
    2. 8.2 Regenerative Medicine Entering Mainstream Clinical Practice |
    3. 8.3 Digital Therapeutics and Connected Care Ecosystems |
    4. 8.4 Value-Based Contracting and Outcomes-Linked Pricing
  9. 9 Recent Developments & News
  10. 10 Frequently Asked Questions (FAQs)
  11. 11 Report Scope & Methodology |
    1. 11.1 Study Period & Base Year |
    2. 11.2 Data Sources & Citations |
    3. 11.3 Abbreviations
  12. 12 LIST OF TABLES |
  13. TABLE 1 Global Osteoarthritis Market Size & Forecast, by Revenue (USD Billion), 2021–2035 |
  14. TABLE 2 Global Osteoarthritis Market – Year-over-Year Growth Analysis, 2021–2035 |
  15. TABLE 3 Global Osteoarthritis Market – Driver Impact Analysis |
  16. TABLE 4 Global Osteoarthritis Market – Restraint Impact Analysis |
  17. TABLE 5 Global Osteoarthritis Market Size, by Drug Class, 2021–2035 (USD Billion) |
  18. TABLE 6 Global Osteoarthritis Market Size, by Anatomy, 2021–2035 (USD Billion) |
  19. TABLE 7 Global Osteoarthritis Market Size, by Distribution Channel, 2021–2035 (USD Billion) |
  20. TABLE 8 Global Osteoarthritis Market Size, by End User, 2021–2035 (USD Billion) |
  21. TABLE 9 Global Osteoarthritis Market Size, by Region, 2021–2035 (USD Billion) |
  22. TABLE 10 North America Osteoarthritis Market Size, by Country, 2021–2035 (USD Billion) |
  23. TABLE 11 Europe Osteoarthritis Market Size, by Country, 2021–2035 (USD Billion) |
  24. TABLE 12 Asia-Pacific Osteoarthritis Market Size, by Country, 2021–2035 (USD Billion) |
  25. TABLE 13 South America Osteoarthritis Market Size, by Country, 2021–2035 (USD Billion) |
  26. TABLE 14 Middle East & Africa Osteoarthritis Market Size, by Country, 2021–2035 (USD Billion) |
  27. TABLE 15 North America Osteoarthritis Market Size, by Drug Class, 2021–2035 (USD Billion) |
  28. TABLE 16 North America Osteoarthritis Market Size, by Anatomy, 2021–2035 (USD Billion) |
  29. TABLE 17 North America Osteoarthritis Market Size, by Distribution Channel, 2021–2035 (USD Billion) |
  30. TABLE 18 North America Osteoarthritis Market Size, by End User, 2021–2035 (USD Billion) |
  31. TABLE 19 Europe Osteoarthritis Market Size, by Drug Class, 2021–2035 (USD Billion) |
  32. TABLE 20 Europe Osteoarthritis Market Size, by Anatomy, 2021–2035 (USD Billion) |
  33. TABLE 21 Europe Osteoarthritis Market Size, by Distribution Channel, 2021–2035 (USD Billion) |
  34. TABLE 22 Europe Osteoarthritis Market Size, by End User, 2021–2035 (USD Billion) |
  35. TABLE 23 Asia-Pacific Osteoarthritis Market Size, by Drug Class, 2021–2035 (USD Billion) |
  36. TABLE 24 Asia-Pacific Osteoarthritis Market Size, by Anatomy, 2021–2035 (USD Billion) |
  37. TABLE 25 Asia-Pacific Osteoarthritis Market Size, by Distribution Channel, 2021–2035 (USD Billion) |
  38. TABLE 26 Asia-Pacific Osteoarthritis Market Size, by End User, 2021–2035 (USD Billion) |
  39. TABLE 27 South America Osteoarthritis Market Size, by Drug Class, 2021–2035 (USD Billion) |
  40. TABLE 28 South America Osteoarthritis Market Size, by Anatomy, 2021–2035 (USD Billion) |
  41. TABLE 29 South America Osteoarthritis Market Size, by Distribution Channel, 2021–2035 (USD Billion) |
  42. TABLE 30 South America Osteoarthritis Market Size, by End User, 2021–2035 (USD Billion) |
  43. TABLE 31 Middle East & Africa Osteoarthritis Market Size, by Drug Class, 2021–2035 (USD Billion) |
  44. TABLE 32 Middle East & Africa Osteoarthritis Market Size, by Anatomy, 2021–2035 (USD Billion) |
  45. TABLE 33 Middle East & Africa Osteoarthritis Market Size, by Distribution Channel, 2021–2035 (USD Billion) |
  46. TABLE 34 Middle East & Africa Osteoarthritis Market Size, by End User, 2021–2035 (USD Billion) |
  47. TABLE 35 Competitive Benchmarking Matrix – Global Osteoarthritis Market, 2025 |
  48. TABLE 36 Company Profiles – Key Players, Global Osteoarthritis Market |
  49. TABLE 37 Recent Developments & Strategic Announcements, 2023–2025 |
  50. TABLE 38 Report Scope & Methodology Summary
  51. 13 LIST OF FIGURES |
  52. FIGURE 1 Global Osteoarthritis Market Dynamics Overview |
  53. FIGURE 2 Industry Value Chain Analysis – Osteoarthritis Market |
  54. FIGURE 3 Porter's Five Forces Analysis – Global Osteoarthritis Market |
  55. FIGURE 4 Global Osteoarthritis Market Size Trend (USD Billion), 2021–2035 |
  56. FIGURE 5 Global Osteoarthritis Market Share, by Drug Class (%), 2025 |
  57. FIGURE 6 Global Osteoarthritis Market Share, by Anatomy (%), 2025 |
  58. FIGURE 7 Global Osteoarthritis Market Share, by Distribution Channel (%), 2025 |
  59. FIGURE 8 Global Osteoarthritis Market Share, by End User (%), 2025 |
  60. FIGURE 9 Global Osteoarthritis Market Share, by Region (%), 2025 |
  61. FIGURE 10 North America Osteoarthritis Market Size Trend, 2021–2035 |
  62. FIGURE 11 Europe Osteoarthritis Market Size Trend, 2021–2035 |
  63. FIGURE 12 Asia-Pacific Osteoarthritis Market Size Trend, 2021–2035 |
  64. FIGURE 13 South America Osteoarthritis Market Size Trend, 2021–2035 |
  65. FIGURE 14 Middle East & Africa Osteoarthritis Market Size Trend, 2021–2035 |
  66. FIGURE 15 Competitive Landscape – Market Share Analysis, 2025

Segmentation Quick Reference

DimensionSub-SegmentsDominant SegmentFastest Growing Segment
Drug ClassNSAIDs, Analgesics, Corticosteroids, Hyaluronic Acid, OthersNSAIDsHyaluronic Acid
AnatomyKnee, Hip, Shoulder, Ankle, Other AnatomiesKneeShoulder
Distribution ChannelHospital Pharmacies, Retail Pharmacies, Online PharmaciesHospital PharmaciesOnline Pharmacies
End UserHospitals, Orthopedic Clinics, OthersHospitalsOrthopedic Clinics
GeographyNorth America, Europe, Asia-Pacific, South America, Middle East & AfricaNorth AmericaAsia-Pacific


Market Segmentation Overview

By Drug Class

Sub-SegmentKey Trend
NSAIDsShift from oral to topical formulations for improved safety profiles
AnalgesicsCombination acetaminophen-tramadol protocols for moderate pain management
CorticosteroidsExtended-release intra-articular formulations reducing injection frequency
Hyaluronic AcidSingle-injection cross-linked products replacing multi-dose regimens
OthersEmerging biologics, nutraceuticals, and disease-modifying pipeline agents


NSAIDs remain the largest drug class due to established efficacy and low cost, while hyaluronic acid injectables lead growth as clinical evidence increasingly supports their role in deferring surgical intervention.

By Anatomy

Sub-SegmentKey Trend
KneeLargest addressable population; highest injectable procedure volumes
HipGrowing demand for pre-arthroplasty pharmaceutical management
ShoulderRising detection through advanced MRI and ultrasound imaging
AnklePost-traumatic osteoarthritis driving specialist referrals
Other AnatomiesHand and spine osteoarthritis gaining clinical attention


Knee disease dominates therapeutic spending across all regions, while shoulder osteoarthritis is emerging as a high-growth segment as improved imaging expands the diagnosed patient pool.

By Distribution Channel

Sub-SegmentKey Trend
Hospital PharmaciesInstitutional procurement of injectable therapies for in-patient and outpatient administration
Retail PharmaciesOutpatient dispensing of oral NSAIDs and topical analgesics
Online PharmaciesChronic medication refill automation and home delivery for elderly patients


Hospital pharmacies lead by revenue share given the clinical administration requirements of injectable products, while online channels are growing fastest as digital pharmacy platforms improve access for chronic disease management.

By End User

Sub-SegmentKey Trend
HospitalsComprehensive diagnostic, pharmaceutical, and surgical osteoarthritis management
Orthopedic ClinicsAmbulatory injection procedures shifting away from hospital settings
OthersPrimary care physicians, rehabilitation centers, and physiotherapy clinics


Hospitals capture the largest share of end-user spending, but orthopedic clinics represent the fastest-growing segment as ambulatory care models reduce procedural costs and improve patient access.


 

Download PDF ×

We do not share your information with anyone. However, we may send you emails based on your report interest from time to time. You may contact us at any time to opt-out.