Payment Gateway Market (2026 - 2035)

Payment Gateway Market Size, Share and Research Report By Type (Hosted, Non-hosted), By Enterprise Size (Large Enterprises, Small & Medium Enterprises), By End-use (BFSI, Media & Entertainment, Retail & E-commerce, Travel & Hospitality, Others) and By Region (North America, Europe, Asia-Pacific, And Rest Of The World) –Industry Forecast Till 2035
ID: MRFR/BS/17325-HCR
128 Pages
Ankit Gupta, Aarti Dhapte
Last Updated: June 26, 2026
Payment Gateway Market
Market Size
Forecast Period2026-2035
CAGR (2026-2035)15.4%
2025 Market SizeUSD 19.58 Billion
2035 Market SizeUSD 82.01 Billion
Key Players
Stripe
PayPal
Adyen
Block
Worldpay
Fiserv
Opportunities
  • Embedded-Finance Gateway Integrations
  • AI-Powered Dynamic Routing and Fraud Prevention
  • Emerging-Market Cashless Mandates

Payment Gateway Market Summary

The Payment Gateway Market was valued at USD 19.58 billion in 2025 and is projected to reach USD 22.60 billion in 2026, climbing to USD 82.01 billion by 2035 at a compound annual growth rate of 15.4% during the 2026–2035 forecast window. This expansion is anchored in the global proliferation of real-time payment rails — India's UPI processed over 13 billion transactions in a single month during late 2024 [1] — and increasingly stringent strong-customer-authentication mandates rolling out across the EU and Southeast Asia [2]. Governments and central banks are actively incentivizing cashless commerce, and every incremental percentage point of card or wallet penetration translates directly into higher gateway transaction volumes.

Legacy batch-processing payment architectures are giving way to API-first, microservices-based gateway stacks capable of handling tokenized card-on-file flows, buy-now-pay-later decisioning, and multi-acquirer routing in a single call. Global venture investment in payment infrastructure exceeded USD 18 billion in 2024 alone [3], with significant capital flowing into orchestration layers that sit atop traditional gateways and add intelligent routing logic. The Payment Gateway Market stands at the centre of this transformation.

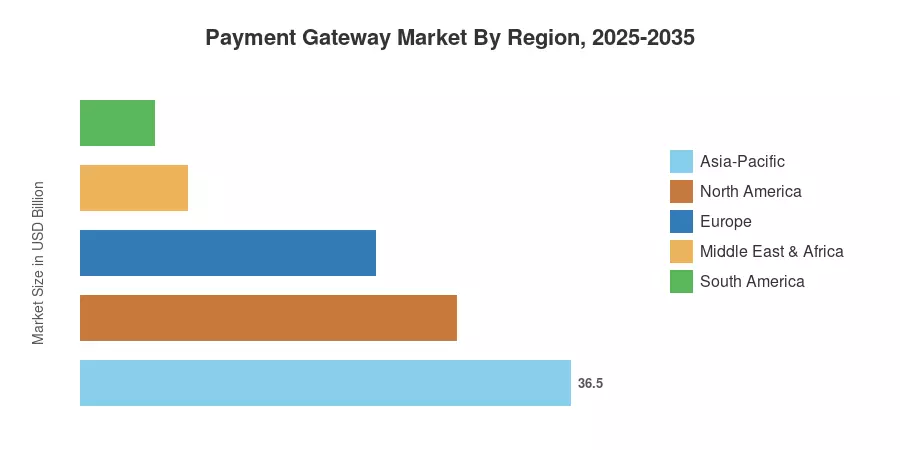
Asia-Pacific commands the largest share of the Payment Gateway Market at roughly 36.5% of 2025 revenue, powered by super-app ecosystems in China, India, and Southeast Asia. Middle East & Africa is positioned as the fastest-growing region with an anticipated 18.2% CAGR through 2035, driven by Saudi Arabia's Vision 2030 cashless targets and CBDC pilot programs. North America holds the second-largest position, contributing approximately 28% of global spending. The decade ahead promises accelerating consolidation, deeper AI-driven fraud screening, and a blurring line between gateways and full-stack payment platforms.


Key Report Takeaways

• By Type

  • Hosted gateways accounted for approximately 52% of 2025 Payment Gateway Market revenue, reflecting merchant preference for quick integration and PCI compliance offloading.
  • Self-hosted deployments are forecast to expand at a 15.2% CAGR through 2035 as enterprise merchants seek granular control over tokenization vaults and routing rules.

• By Enterprise Size & Channel

  • Small and medium enterprises drove roughly 60% of the 2025 Payment Gateway Market transaction volume, aided by subscription-priced, low-code integrations.
  • Mobile in-app payments are advancing at a 17.1% CAGR, fueled by super-app SDKs embedded in ride-hailing and food-delivery ecosystems.

• By End-User Industry & By Region

  • Retail and e-commerce represented about 29% of 2025 demand across the Payment Gateway Market, while travel and hospitality is projected to record the fastest segment CAGR of 15.8%.
  • Asia-Pacific retained 36.5% of global revenue in 2025, whereas the Middle East & Africa region is projected to post an 18.2% CAGR through 2035.


Market Size and Forecast (2021–2035)

Market Research Future's estimation framework synthesizes primary interviews with payment processors, gateway vendors, and acquiring banks alongside secondary data from central bank settlement reports, card-network disclosures, and app-store analytics. Historical figures (2021–2024) reflect verified transaction-value data; the base year 2025 is calibrated against the latest quarterly filings; and the forecast period (2026–2035) applies a 15.4% CAGR derived from regression modelling of gateway API call volumes, merchant onboarding rates, and real-time-payment adoption curves.
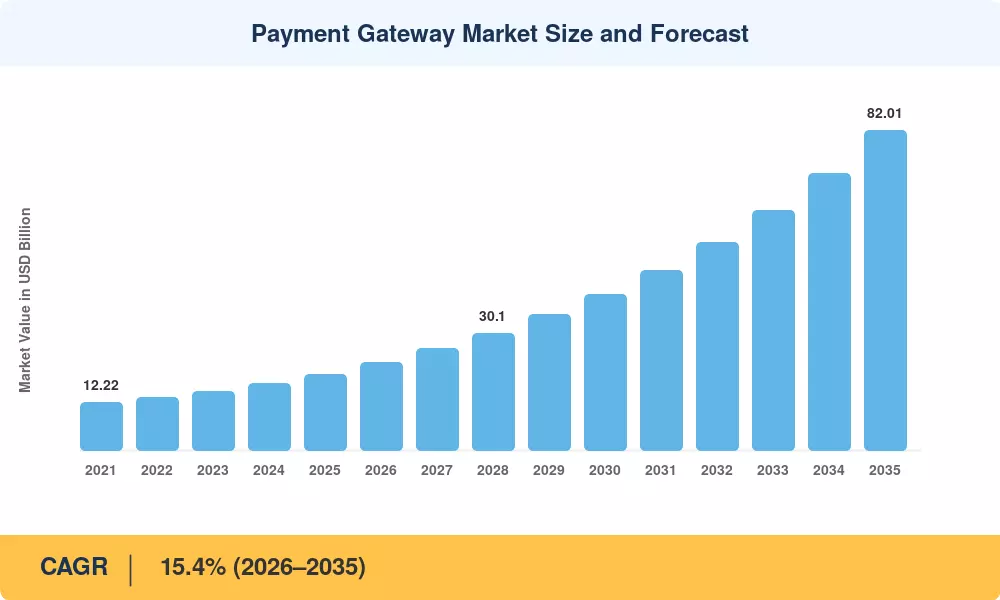
Payment Gateway Market Size and Forecast
Our Impact
Enabled $4.3B Revenue Impact for Fortune 500 and Leading Multinationals
Partnering with 2000+ Global Organizations Each Year
30K+ Citations by Top-Tier Firms in the Industry

Driver Impact Analysis

Driver ~% Impact on CAGR Geographic Relevance Impact Timeline
Real-time payment rail expansion +2.8% Global Short-term (≤2 yr)
Strong-customer-authentication mandates +2.2% EU, APAC Medium-term (2–4 yr)
BNPL and instalment-flow proliferation +1.9% North America, Europe Short-term (≤2 yr)
Super-app SDK gateway embedding +1.7% Asia-Pacific Medium-term (2–4 yr)
Cross-border e-commerce growth +1.5% Global Long-term (≥4 yr)
AI-driven fraud-scoring integration +1.3% North America, Europe Medium-term (2–4 yr)
CBDC retail settlement pilots +0.9% Middle East, APAC Long-term (≥4 yr)


Real-Time Payment Rail Expansion

India's Unified Payments Interface crossed 14 billion monthly transactions by early 2025 [1], and Brazil's Pix system processed over BRL 17 trillion in 2024 [4]. Each real-time transfer that runs through a merchant acceptance flow generates an API call through a payment gateway, making rail expansion arguably the single strongest driver for the Payment Gateway Market. FedNow in the United States, while still early, is expected to onboard over 2,000 financial institutions by 2027, creating a fresh layer of gateway demand in a market historically dominated by card rails [12].

Strong-Customer-Authentication Mandates

The EU's revised Payment Services Directive (PSD3) and its accompanying Payment Services Regulation, expected to be finalized in 2026, will tighten SCA requirements and mandate interoperability of authentication tokens across gateway providers [2]. In APAC, the Monetary Authority of Singapore and Bank Indonesia have introduced phased SCA frameworks that require tokenized 3-D Secure 2.x handshakes on all card-not-present transactions above local thresholds. These regulatory catalysts push merchants toward hosted gateway solutions capable of handling compliant authentication flows without in-house cryptography teams.

BNPL and Instalment-Flow Proliferation

Global BNPL transaction volume surpassed USD 400 billion in 2024, and each BNPL checkout triggers multiple gateway API calls — an initial authorization, a soft-credit decisioning webhook, and subsequent instalment captures. The Payment Gateway Market benefits disproportionately because BNPL increases the average number of gateway interactions per order by a factor of three to five compared with a single card payment.

Super-App SDK Gateway Embedding

Platforms like Grab, Gojek, and WeChat are embedding payment-gateway SDKs directly within their super-app environments, effectively making the gateway invisible to the consumer while dramatically increasing call volumes. Grab Financial processed over USD 14 billion in total payment volume through its embedded gateway in 2024 [9], and this model is now being replicated by food-delivery and mobility platforms across Latin America and the Middle East.


Restraints Impact Analysis

Restraint-impact percentages are directional estimates representing headwinds to the Payment Gateway Market's growth rate. They do not net directly against the CAGR and are included for strategic-planning context.

Restraint ~% Impact on CAGR Geographic Relevance Impact Timeline
Fragmented data-localization regulations −1.4% APAC, MEA Long-term (≥4 yr)
Rising gateway fee compression −1.1% North America, Europe Medium-term (2–4 yr)
Cybersecurity breach liabilities −0.9% Global Short-term (≤2 yr)
Merchant platform disintermediation −0.7% North America Medium-term (2–4 yr)
Infrastructure gaps in frontier markets −0.5% Africa, South America Long-term (≥4 yr)


Fragmented Data-Localization Regulations

India's RBI data-localization mandate, Indonesia's GR 71 amendment, and Vietnam's Decree 13 each impose distinct requirements on where transaction data must be stored and processed [13]. For gateway providers operating cross-border, compliance often means deploying parallel infrastructure in multiple jurisdictions, raising per-transaction costs by 15–25 basis points in affected corridors. This fragmentation slows geographic rollout and compresses margins for mid-tier Payment Gateway Market participants that lack the capital for multi-region data centres.

Rising Gateway Fee Compression

Stripe reduced its standard processing fee for high-volume merchants in the US by 30 basis points in 2024, and Adyen adjusted interchange-plus pricing across European corridors [14]. As large-scale orchestration platforms give merchants real-time visibility into routing costs, downward pressure on gateway take-rates is intensifying. For the Payment Gateway Market, this means revenue growth increasingly depends on value-added services — fraud tools, analytics dashboards, and treasury-management modules — rather than per-transaction fees alone.

Cybersecurity Breach Liabilities

The average cost of a payment-data breach reached USD 4.88 million globally in 2024 [15], and PCI DSS v4.0 compliance deadlines in March 2025 imposed significant remediation costs on self-hosted gateway operators. Smaller merchants facing these liabilities sometimes delay gateway adoption altogether, opting for manual invoicing or cash-based workflows in emerging economies.


Payment Gateway Market Opportunities

Embedded-Finance Gateway Integrations

Payments acceptance is being embedded into key flows by non-financial services platforms – from SaaS billing tools to healthcare scheduling apps. The Payment Gateway Market is poised to ride this embedded-finance tsunami that anticipates as much as USD 230 billion in worldwide revenue by 2030 [18]. The best placed are white-label API suppliers with flexible KYC and ledger capabilities.


AI-Powered Dynamic Routing and Fraud Prevention

Machine-learning algorithms to optimize real-time acquirer selection can increase authorization rates by 2-4 percentage points and reduce false-decline losses [11]. That turns the gateway into an intelligence layer for the Payment Gateway Market, justifying a premium SaaS price. Vendors such as Checkout.com and Adyen have previously deployed adaptive-routing engines, and the technology is now going downmarket to mid-market gateways.


Emerging-Market Cashless Mandates

Saudi Arabia’s Vision 2030 aims to reach 70% non-cash transactions by 2025, while Nigeria’s cashless-policy framework is sanctioning massive cash withdrawals [7]. These top-down directives create greenfield gateway demand in places that have hitherto underperformed in terms of card-acceptance infrastructure. These policy tailwinds directly favor the Middle East & Africa segment of the Payment Gateway Market.


Data Monetization Through Transaction Analytics

Aggregated, anonymized transaction data is being used by gateway operators to create a new revenue stream. Merchant dashboards are fed with insights on customer spending, basket-size analytics and churn-prediction scoring. The move from pure payment processing to a data-platform play in the Payment Gateway Market is illustrated by Adyen’s Data Connect for Marketing offering and Stripe’s Revenue Recognition suite.


Omnichannel POS-to-Online Unification

Retailers operating both physical and digital storefronts increasingly demand a single gateway that unifies in-store terminal transactions with online and mobile channels. This omnichannel convergence creates upsell opportunities for the Payment Gateway Market as merchants consolidate from multiple point solutions to integrated platforms.


Payment Gateway Market Future Outlook

AI-Native Gateway Architecture

By 2028, leading gateway providers will transition from bolting AI fraud models onto legacy stacks to deploying AI-native architectures where machine learning governs routing decisions, authorization-retry logic, and fee optimization in real time. projects that 60% of payment-infrastructure decisions will be AI-mediated by 2030 [11]. For the Payment Gateway Market, this shift redefines competitive differentiation around data assets and model quality rather than connectivity breadth alone.

Platform and Marketplace Orchestration

The rise of marketplace-model businesses — from Shopify's merchant ecosystem to Uber's multi-sided platform — demands payment gateways that can split settlements, manage escrow accounts, and handle multi-party compliance in a single API call. The Payment Gateway Market will increasingly bifurcate between simple checkout gateways and full-stack orchestration platforms, with the latter commanding 3–5x higher average revenue per merchant [16].

CBDC and Programmable-Money Integration

At least 130 countries are exploring CBDC initiatives as of 2025, and 36 are in active pilot or production phases [7]. Retail CBDCs will require gateway-layer integration to bridge central-bank digital wallets with existing merchant-acceptance infrastructure. The Payment Gateway Market stands to capture new integration revenue as jurisdictions like the EU (digital euro), China (e-CNY), and Saudi Arabia (Aber) move toward production rollout between 2027 and 2030.

Sustainability Reporting and Green-Transaction Tracking

ESG reporting mandates — including the EU's Corporate Sustainability Reporting Directive — are pushing enterprises to quantify the carbon footprint of their financial operations. Gateway providers like Stripe and Adyen have introduced carbon-calculation APIs tied to payment flows, and the Payment Gateway Market will see growing demand for environmental-impact dashboards as sustainability compliance expands beyond voluntary disclosure [19].


Payment Gateway Market Segmentation

By Type

Segment 2025 Revenue Share (%) Primary Demand Driver
Hosted 52.0 PCI compliance offloading, rapid merchant onboarding
Self-Hosted 48.0 Enterprise control over token vaults and routing logic


Hosted gateways remain the dominant architecture in the Payment Gateway Market because they eliminate the need for merchants to handle sensitive card data on their own servers. Platforms like Stripe Checkout and PayPal's hosted payment pages let SMEs go live in hours rather than weeks. Self-hosted solutions, meanwhile, are gaining traction among large enterprises that require custom checkout flows, direct acquirer integrations, and the ability to run proprietary fraud-scoring models within their own infrastructure.

By Enterprise Size

Segment Key Metric Primary Demand Driver
Small and Medium Enterprises 60% of 2025 volume Low-code plug-ins, flat subscription pricing
Large Enterprises 14.6% CAGR (2026–2035) Multi-acquirer orchestration, treasury integration


SMEs account for the bulk of the Payment Gateway Market by merchant count and transaction volume, driven by pre-built integrations with Shopify, WooCommerce, and similar platforms. Large enterprises, while fewer in number, generate higher per-merchant revenue and are investing in orchestration layers that dynamically route transactions across multiple gateways and acquirers to optimize authorization rates and minimize processing fees.

By Channel

Segment Key Metric Primary Demand Driver
Online / Web 93% of 2025 share Desktop and mobile-browser checkout dominance
Mobile In-App 17.1% CAGR (2026–2035) Super-app SDK embedding, one-tap payments
In-Store POS (Omnichannel) USD 0.78 Billion (2025) Unified commerce demand


Online and web-based checkout continues to dominate the Payment Gateway Market channel mix, though mobile in-app payments are closing the gap rapidly. The in-store POS omnichannel segment, while the smallest, represents a strategically important frontier as retailers seek a single gateway API for both physical and digital storefronts.

By End-User Industry

Segment Key Metric Primary Demand Driver
Retail and E-Commerce 29% of 2025 demand High transaction frequency, cross-border sales
Travel and Hospitality 15.8% CAGR (2026–2035) Dynamic pricing, multi-currency settlement
BFSI USD 3.42 Billion (2025) Regulatory compliance, open-banking flows
Other Industries 12.9% CAGR (2026–2035) Healthcare, education, government digitization


Retail and e-commerce remains the largest end-user segment in the Payment Gateway Market, reflecting the sector's inherently high transaction volumes and growing cross-border checkout complexity. Travel and hospitality is set to record the fastest CAGR as airlines, hotels, and online travel agencies adopt multi-currency settlement gateways that reduce FX conversion friction and improve authorization rates across regional acquirers [10].


Regional Market Share Analysis

Region 2025 Revenue Share (%) Primary Investment Themes
Asia-Pacific 36.5 Super-app ecosystems, UPI/Pix-style real-time rails
North America 28.0 Orchestration platforms, BNPL checkout flows
Europe 22.0 PSD3/SCA compliance, open-banking gateways
Middle East & Africa 8.0 Cashless mandates, CBDC retail pilots
South America 5.5 Pix ecosystem expansion, cross-border corridors
Total 100.0

The Payment Gateway Market exhibits distinct regional dynamics shaped by regulatory environments, mobile-wallet adoption curves, and the maturity of card-acceptance infrastructure.


North America

Country CAGR (2026–2035) Key Driver
United States 14.8% FedNow adoption, orchestration-layer growth
Canada 13.6% Open-banking framework (2025 launch)
Mexico 15.9% CoDi/DiMo digital-wallet expansion


North America's Payment Gateway Market is defined by intense competition among established processors and fast-scaling fintech challengers. The US accounts for the vast majority of regional revenue, driven by high card penetration and a rapidly maturing BNPL ecosystem. Canada's Consumer-Driven Banking framework, launched in 2025, is expected to stimulate new gateway integrations by enabling third-party-initiated payments through open-banking APIs [12]. Mexico's DiMo interoperable-wallet system is pushing small-merchant digitization beyond major metros.

Europe

Country 2025 Share of Regional Revenue (%) Key Driver
Germany 19.2 PSD3 compliance acceleration
United Kingdom 24.5 Open-banking payment-initiation growth
France 14.8 Carte Bancaire network gateway modernization
Italy 9.6 Government-backed cashless incentives
Spain 8.3 Tourism-driven cross-border checkout
Nordic Countries 11.1 Near-100% digital-payment penetration
Russia 3.8 Domestic MIR-network gateway demand
Rest of Europe 8.7 CEE fintech emergence


The European Payment Gateway Market is shaped by regulatory ambition. PSD3 and the proposed Payment Services Regulation will mandate API-level interoperability between gateway providers and account-servicing payment service providers [2]. The UK's open-banking ecosystem already supports over 11 million active users, and account-to-account payments routed through gateways grew 64% year-on-year in 2024 [6]. Nordic economies, where cash usage has dropped below 5% of retail transactions, serve as leading indicators for the rest of the continent.

Asia-Pacific

Country Key Metric Key Driver
China USD 2.84 Billion (2025) Alipay/WeChat Pay ecosystem dominance
India 16.8% CAGR UPI merchant-acceptance expansion
Japan USD 1.02 Billion (2025) Cashless-society 2025 roadmap
South Korea 15.3% CAGR Open-finance pilot programs
ASEAN USD 0.91 Billion (2025) Super-app gateway embedding
Rest of Asia-Pacific 14.2% CAGR Emerging mobile-wallet corridors


Asia-Pacific leads the global Payment Gateway Market thanks to the sheer scale of mobile-first payment ecosystems. India alone processes over 14 billion UPI transactions monthly [1], and each merchant-acceptance UPI flow increasingly routes through third-party gateway aggregators. China's cross-border gateway volume is expanding as Alipay+ and WeChat Pay Global extend acceptance to outbound tourists across Southeast Asia and Europe. Japan's government-backed cashless target of 40% by 2025 has driven rapid POS-gateway deployment in small retail and hospitality venues [9].

South America

Country CAGR (2026–2035) Key Driver
Brazil 16.2% Pix instant-payment rail dominance
Argentina 14.5% Fintech challenger bank growth
Rest of South America 13.8% Cross-border remittance digitization


Brazil's Pix system processed over BRL 17 trillion in 2024 [4], and the Central Bank of Brazil is introducing Pix Automático for recurring payments in 2025, creating new gateway integration requirements for subscription-based merchants. Argentina's high inflation environment has paradoxically accelerated digital-payment adoption as consumers and businesses seek to minimize cash-handling costs. The Payment Gateway Market in the region remains underpenetrated relative to GDP, presenting a significant runway for growth.

Middle East & Africa

Country Key Metric Key Driver
Saudi Arabia 18.6% CAGR Vision 2030 cashless targets
UAE USD 0.42 Billion (2025) DIFC/ADGM fintech licensing
South Africa 15.1% CAGR Interoperable QR-code frameworks
Egypt 17.4% CAGR Central bank fintech sandbox
Rest of MEA USD 0.34 Billion (2025) Mobile-money gateway bridging


The Middle East & Africa represents the fastest-growing region in the Payment Gateway Market, underpinned by aggressive government digitization mandates. Saudi Arabia's SAMA has mandated that all licensed merchants accept at least one digital-payment method by 2026, and the UAE's central bank launched its CBDC pilot — the Digital Dirham — in late 2024 [7]. In Sub-Saharan Africa, mobile-money operators like M-Pesa are increasingly integrating with gateway APIs to enable merchant acceptance beyond peer-to-peer transfers, bridging the gap between telco-wallet ecosystems and traditional card networks [17].


Payment Gateway Market By Region, 2025-2035

Competitive Benchmarking

The Payment Gateway Market exhibits medium concentration with an estimated top-five revenue share of 35–42%. The Herfindahl-Hirschman Index sits in the 600–900 range, reflecting a competitive field where no single player commands more than 12% of global revenue. The landscape is characterized by three tiers: global full-stack processors (Stripe, Adyen), legacy acquirer-linked gateways (Worldpay, Fiserv), and region-specific challengers (Razorpay, Paystack) that dominate local corridors.

Company Est. Revenue Share Range Key Offerings Strategic Positioning
Stripe ~8–11% Stripe Payments, Billing, Connect, Radar Full-stack platform for internet businesses
PayPal (Braintree) ~7–10% Braintree gateway, PayPal Checkout, Venmo Consumer-wallet-linked gateway ecosystem
Adyen ~5–8% Single-platform acquiring + gateway, RevenueAccel Unified commerce for enterprise merchants
Block (Square) ~4–7% Square Online, In-Person Payments, Afterpay SME-focused omnichannel suite
Worldpay (FIS) ~4–6% Gateway + acquiring, FraudSight, global reach Legacy acquirer with broad geographic coverage
Fiserv (Clover) ~3–5% Clover POS gateway, Carat platform Bank-channel distribution model
Checkout.com ~2–4% Intelligent Acceptance, Flow orchestration Enterprise-grade modular gateway
Razorpay ~2–4% Payment Gateway, RazorpayX, Payment Pages India-dominant with APAC expansion
Amazon Pay ~2–3% Amazon Pay for merchants, Alexa voice payments Leveraging Amazon consumer trust
Authorize.Net (Visa) ~1–3% Developer-friendly API, Advanced Fraud Detection Legacy SME gateway with Visa backing


Recent News & Developments


  • Block (Square) (January 2022 ): Integrated Afterpay's BNPL product directly into the Square Online gateway, enabling single-API checkout for instalment payments [24].
  • European Commission (March 2025): Published the final text of PSD3 and the Payment Services Regulation, establishing new gateway-interoperability requirements and API standardization mandates [2].


Payment Gateway Market Report Scope

Parameter Detail
Market Scope Global Payment Gateway Market covering hosted and self-hosted gateways across enterprise sizes, channels, and end-user industries
Study Period 2021–2035
CAGR 15.4% (2026–2035)
Market Size (2025) USD 19.58 Billion
Market Size (2035) USD 82.01 Billion
Fastest Growing Segment Mobile In-App (by channel); Middle East & Africa (by geography)
Companies Profiled 10 (Stripe, PayPal/Braintree, Adyen, Block, Worldpay, Fiserv, Checkout.com, Razorpay, Amazon Pay, Authorize.Net)
Valuation Currency USD Billion


FAQs

How do gateway orchestration layers differ from standalone payment gateways?
Orchestration layers sit above one or more gateways, dynamically routing each transaction to the acquirer or processor most likely to approve it at the lowest cost. Standalone gateways handle a single connection. Orchestration adds smart-routing intelligence that can lift authorization rates by 2–4 percentage points [11].
What PCI compliance burden does a hosted gateway eliminate for merchants?
A hosted gateway handles all card-data capture on its own servers, reducing the merchant's PCI DSS scope to the lightest self-assessment questionnaire (SAQ A). This eliminates the need for on-site network scans and penetration tests [15].
How are CBDC retail rails expected to affect gateway pricing models?
CBDC transactions bypass card-network interchange fees, so gateways processing CBDC flows will likely shift to flat per-transaction or subscription pricing. Early pilots in China and the UAE suggest per-transaction costs 40–60% below card equivalents [7].
What role does tokenization play in reducing gateway fraud exposure?
Tokenization replaces sensitive card numbers with non-reversible tokens at the gateway level, rendering intercepted data useless to attackers. Networks report 26% lower fraud rates on tokenized transactions versus raw PAN submissions [15].
Which integration model suits a fast-scaling marketplace — hosted or self-hosted gateway?
Marketplaces requiring custom split-settlement logic and multi-party escrow typically benefit from self-hosted or hybrid gateways that expose granular API control. Hosted solutions work for simpler single-seller checkouts [16].
How does multi-acquirer routing improve cross-border authorization rates?
Routing a transaction to a local acquirer in the cardholder's country reduces declines caused by foreign-issuer flags. Enterprise merchants using multi-acquirer setups report 5–8 percentage-point improvements in cross-border approval rates [10].
What compliance risks do gateway providers face under PSD3?
PSD3 mandates open-API interoperability between gateways and account-servicing providers, requiring new certification processes. Non-compliant operators risk losing their payment-institution licenses within the EU [2].    
Author
Author
Author Profile
Ankit Gupta LinkedIn
Team Lead - Research
Ankit Gupta is a seasoned market intelligence and strategic research professional with over six plus years of experience in the ICT and Semiconductor industries. With academic roots in Telecom, Marketing, and Electronics, he blends technical insight with business strategy. Ankit has led 200+ projects, including work for Fortune 500 clients like Microsoft and Rio Tinto, covering market sizing, tech forecasting, and go-to-market strategies. Known for bridging engineering and enterprise decision-making, his insights support growth, innovation, and investment planning across diverse technology markets.
Co-Author
Co-Author Profile
Aarti Dhapte LinkedIn
AVP - Research
A consulting professional focused on helping businesses navigate complex markets through structured research and strategic insights. I partner with clients to solve high-impact business problems across market entry strategy, competitive intelligence, and opportunity assessment. Over the course of my experience, I have led and contributed to 100+ market research and consulting engagements, delivering insights across multiple industries and geographies, and supporting strategic decisions linked to $500M+ market opportunities. My core expertise lies in building robust market sizing, forecasting, and commercial models (top-down and bottom-up), alongside deep-dive competitive and industry analysis. I have played a key role in shaping go-to-market strategies, investment cases, and growth roadmaps, enabling clients to make confident, data-backed decisions in dynamic markets.

Research Approach


Secondary Research

The secondary research process involved comprehensive analysis of regulatory databases, fintech publications, payment industry reports, and authoritative financial organizations. Key sources included the US Federal Reserve System (Fed), European Central Bank (ECB), Bank for International Settlements (BIS), Financial Conduct Authority (FCA) UK, Consumer Financial Protection Bureau (CFPB), International Monetary Fund (IMF) Global Financial Stability Report, World Bank Global Findex Database, Organization for Economic Co-operation and Development (OECD) Digital Economy Outlook, European Banking Authority (EBA), Payment Card Industry Security Standards Council (PCI SSC), SWIFT Institute, National Automated Clearing House Association (NACHA), Asian Development Bank (ADB) Fintech reports, and central bank reports from key markets. These sources were used to collect transaction volume statistics, regulatory compliance data, digital payment adoption trends, cybersecurity frameworks, and market landscape analysis for hosted payment gateways, non-hosted solutions, mobile payment integrations, and emerging payment technologies.


Primary Research

In order to gather both qualitative and quantitative insights, supply-side and demand-side stakeholders were interviewed during the primary research process. CEOs, CTOs, VPs of Product Development, chief risk officers, and commercial directors from fintech firms, payment gateway providers, and banking technology suppliers were examples of supply-side sources. Chief digital officers, heads of payments, treasury managers, and procurement leads from retail and e-commerce platforms, banking and financial institutions, media firms, travel aggregators, and hotel chains were among the demand-side sources. Market segmentation, product development roadmaps, pricing models, platform adoption trends, API integration difficulties, and regulatory compliance requirements were all confirmed by primary research.

Primary Respondent Breakdown:

By Designation: C-level Primaries (40%), Director Level (25%), Others (35%)

By Region: North America (32%), Europe (30%), Asia-Pacific (28%), Rest of World (10%)


Market Size Estimation

Global market valuation was derived through revenue mapping and transaction volume analysis. The methodology included:

Identification of 50+ key payment gateway providers across North America, Europe, Asia-Pacific, and Latin America

Product mapping across hosted payment gateways, non-hosted/API-integrated solutions, mobile payment platforms, and cryptocurrency payment gateways

Analysis of reported and modeled annual revenues specific to payment processing portfolios

Coverage of providers representing 70-75% of global market share in 2024

Extrapolation using bottom-up (transaction volume × average revenue per transaction by country) and top-down (provider revenue validation) approaches to derive segment-specific valuations for enterprise sizes (large enterprises, SMEs) and end-use sectors (BFSI, retail & e-commerce, media & entertainment, travel & hospitality)

Download Free Sample

Kindly complete the form below to receive a free sample of this Report

Download PDF ×

We do not share your information with anyone. However, we may send you emails based on your report interest from time to time. You may contact us at any time to opt-out.

















