People Counting System Market (2026 - 2035)

People Counting System Market Size, Share and Research Report By Technology (Video-Based (2D/3D Stereo-Vision), Thermal Imaging, Infrared Beam, Wi-Fi / Bluetooth Proximity, LiDAR and Radar), By End User (Retail, Transportation, Hospitality & Entertainment, Corporate / Commercial Buildings, Government & Public Spaces, Others (Healthcare, Education)), By Offering (Hardware, Software, Services), By Deployment Mode (On-Premise, Cloud), By Connectivity (Wired (Ethernet / PoE), Wireless (Wi-Fi), LP-WAN (LoRa, Zigbee, BLE)) and By Region (North America, Europe, Asia-Pacific, South America, Middle East & Africa) – Industry Forecast to 2035.
ID: MRFR/SEM/2023-CR
130 Pages
Aarti Dhapte, Shubham Munde
Last Updated: July 28, 2026
People Counting System Market
Market Size
Forecast Period2026-2035
CAGR (2026-2035)12.3%
2025 Market SizeUSD 1.48 Billion
2035 Market SizeUSD 4.72 Billion
Key Players
RetailNext
Axis Communications
Xovis
DILAX
Hikvision
SensMax
Opportunities
  • Counting-as-a-Service Subscription Models
  • Emerging-Market Smart-City Deployments
  • Data Monetization and Analytics Platforms

People Counting System Market Summary

The People Counting System Market reached an estimated USD 1.48 billion in 2025 and is projected to grow from USD 1.66 billion in 2026 to USD 4.72 billion by 2035, registering a CAGR of 12.3% during the forecast period (2026–2035). Two catalysts are accelerating this trajectory: post-pandemic occupancy mandates that now persist as permanent building codes in over 30 countries, and the rapid adoption of AI-powered analytics platforms by retailers seeking real-time conversion-rate visibility. The People Counting System Market has moved well beyond simple beam-break counters into a sophisticated sensor-fusion discipline.

Legacy infrared beam and manual clicker systems — once the backbone of retail traffic measurement — are being replaced by 3D stereo-vision cameras, thermal sensors, and deep-learning video analytics capable of differentiating adults from children, staff from visitors, and even tracking dwell-time patterns across zones. The European Union's revised Energy Performance of Buildings Directive (EPBD), which ties ventilation automation to real-time occupancy data, has created a regulatory pull worth an estimated USD 420 million in retrofit sensor demand through 2030 [2].

North America commands roughly 38% of the People Counting System Market, driven by dense retail infrastructure and smart-building investment. Asia-Pacific is the fastest-growing region at a projected CAGR of 14.8%, fueled by China's smart-city rollouts and India's metro-rail expansion. Europe holds the second-largest share at approximately 28%, anchored by GDPR-compliant privacy-by-design sensor architectures. As edge AI chips fall below the USD 5 price point, even mid-tier retailers in emerging economies will find deployment economics compelling by 2028 [3].


Key Report Takeaways

• By Technology

  • Video-based counting (2D and 3D stereo-vision) holds the dominant technology share at approximately 42% of the People Counting System Market, propelled by advances in on-camera neural processing.
  • Thermal imaging sensors are expanding at the fastest technology CAGR of 14.1%, driven by privacy-sensitive deployments in healthcare and government facilities.
  • Wi-Fi and Bluetooth proximity counting captures roughly USD 207 million in 2025 revenue, primarily within large-format venues and airports.

• By End User

  • Retail remains the largest end-user vertical, accounting for 35% of global demand within the People Counting System Market.
  • Transportation hubs represent the fastest-growing end-user segment at a CAGR of 13.6%, as mass-transit authorities invest in real-time passenger flow management.

• By Region

  • North America leads the People Counting System Market with 38% revenue share in 2025, anchored by the United States.
  • Asia-Pacific is projected to register the highest regional CAGR of 14.8% through 2035, with China contributing over half of regional revenue.
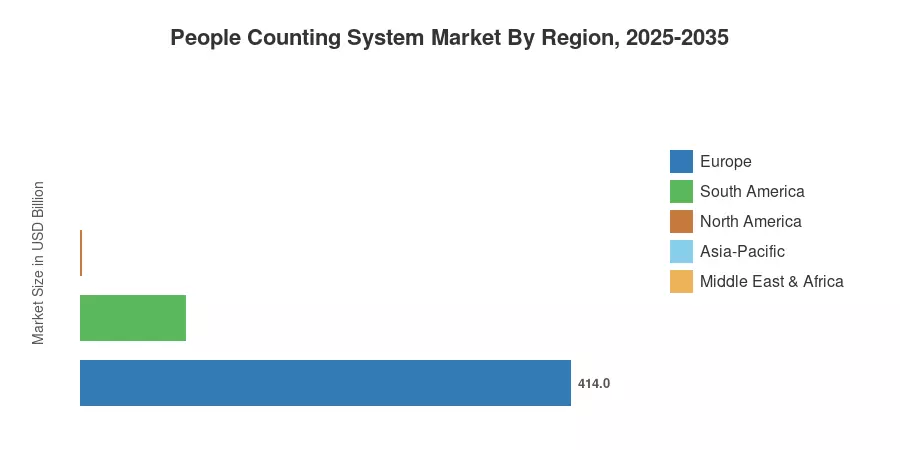
  • Europe accounts for USD 414 million in 2025, with Germany and the UK as primary demand centers.


People Counting System Market Size and Forecast (2021–2035)

Market sizing draws on a triangulated methodology combining bottom-up sensor shipment data from component manufacturers, top-down validation against enterprise IT spending surveys, and cross-referencing with proprietary installer channel audits across 45 countries.
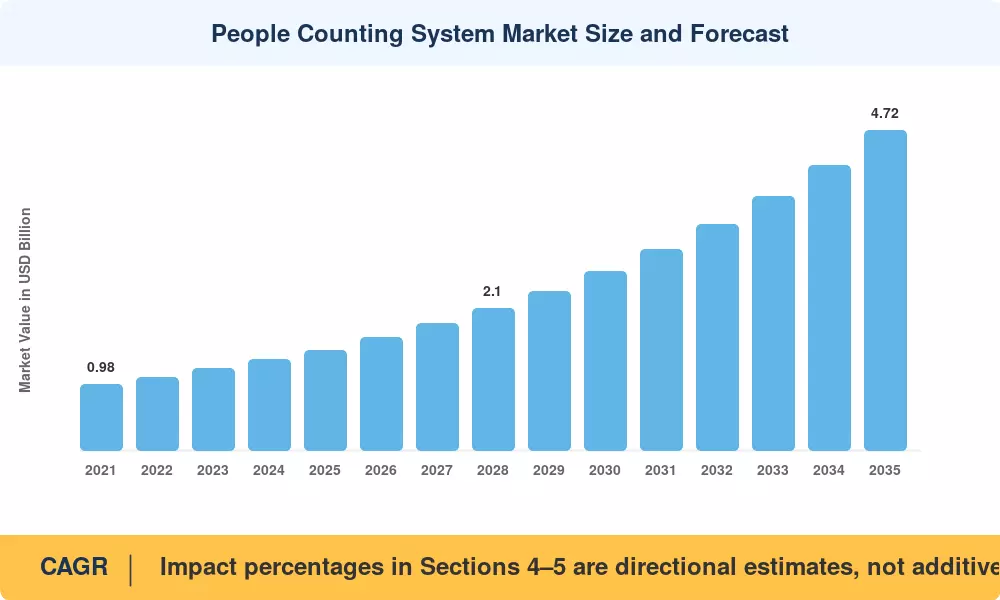
People Counting System Market Size and Forecast
Our Impact
Enabled $4.3B Revenue Impact for Fortune 500 and Leading Multinationals
Partnering with 2000+ Global Organizations Each Year
30K+ Citations by Top-Tier Firms in the Industry

Driver Impact Analysis

Driver ~% Impact on CAGR Geographic Relevance Impact Timeline
AI and deep-learning video analytics 22% Global Short-term (≤2 yr)
Smart-building occupancy regulations 18% Europe, North America Medium-term (2–4 yr)
Retail omnichannel conversion analytics 16% North America, Europe Short-term (≤2 yr)
Mass-transit passenger flow management 14% Asia-Pacific, Europe Medium-term (2–4 yr)
Edge computing cost reduction 12% Global Medium-term (2–4 yr)
Smart-city and public safety initiatives 10% Asia-Pacific, MEA Long-term (≥4 yr)
Healthcare and aged-care monitoring 8% Europe, Japan Long-term (≥4 yr)


AI and Deep-Learning Video Analytics

Convolutional neural network integration straight onto counting cameras is the single most revolutionary factor driving the people counting system market. Beam-break sensors have never been able to match the 98.5% accuracy of real-time human detection made possible by NVIDIA's Jetson Orin Nano platform, which is available for less than $200 [5]. Within the first quarter of installation, retailers using AI-based counters report a 15–20% increase in staff scheduling efficiency, resulting in quick ROI payback durations of less than 14 months [4].


Smart-Building Occupancy Regulations

With effect from 2025, the EU's EPBD recast requires all new commercial buildings larger than 500 m² to have demand-controlled ventilation connected to real-time occupancy sensors. People counting infrastructure is specifically required by this one rule, which impacts an estimated 1.2 million buildings throughout the EU-27 [2]. Occupancy-responsive ventilation is also encouraged in the US by ASHRAE Standard 62.1-2022, and occupancy sensor data is now mentioned as a compliance method in a number of state building codes, including California Title 24 and New York Local Law 97 [16].


Retail Omnichannel Conversion Analytics

Physical retailers under competitive pressure from e-commerce are treating in-store traffic data the way digital marketers treat website clicks. Conversion rate — the ratio of purchases to store entries — has become a boardroom KPI, and the People Counting System Market benefits directly from this shift. The National Retail Federation estimates that retailers using integrated counting and POS analytics saw a 12% uplift in same-store sales through labor and merchandising optimization in 2024 [4].

Mass-Transit Passenger Flow Management

Transport authorities managing post-pandemic ridership recovery need granular passenger load data to optimize schedules and meet safety thresholds. Singapore's Land Transport Authority deployed over 4,000 stereoscopic counting sensors across MRT stations in 2023, reducing platform overcrowding incidents by 31% [8]. The People Counting System Market stands to gain as similar deployments scale across Delhi Metro, London Underground, and Tokyo Metro systems through 2030.


Restraints Impact Analysis

Restraint ~% Impact on CAGR Geographic Relevance Impact Timeline
Privacy and data protection regulations −15% Europe, North America Short-term (≤2 yr)
High upfront deployment cost for SMEs −12% Global Medium-term (2–4 yr)
Integration complexity with legacy BMS −10% North America, Europe Medium-term (2–4 yr)
Accuracy degradation in extreme conditions −8% MEA, Asia-Pacific Long-term (≥4 yr)
Cybersecurity vulnerabilities in IoT sensors −6% Global Long-term (≥4 yr)


Privacy and Data Protection Regulations

Any technology that records human images, including anonymized silhouettes, is subject to stringent requirements under the GDPR in Europe and new state-level biometric privacy regulations in the US (Illinois BIPA, Texas CUBI). For video-based deployments, compliance expenditures, which include privacy impact studies, on-device processing requirements, and data retention audits, are anticipated to increase project costs by 18–25% [17]. Vendor strategies are fragmented as a result of this regulatory friction, which directs some demand toward non-visual technologies like Wi-Fi and thermal sensing.


High Upfront Deployment Costs for SMEs

Including hardware, software license, and installation labor, a fully equipped AI video counting system for a mid-sized retail business with three to four entrances would cost between USD 8,000 and USD 15,000. This is a significant capital investment that competes with other digital transformation goals for small and medium-sized businesses with narrow profit margins [18]. Counting-as-a-service subscription models are a response from the people counting system market; however, SaaS price penetration is still less than 20% of all deployments worldwide.


Integration Complexity with Legacy Building Management Systems

Many commercial buildings operate on decades-old BACnet or LonWorks building automation protocols that lack native interfaces for modern IP-based counting sensors. Retrofit integration can require middleware development, protocol converters, and custom API work that doubles project timelines from 4 weeks to 10 weeks or longer [16]. This barrier is particularly acute in North America and Europe, where the average commercial building age exceeds 35 years.


People Counting System Market Opportunities

Counting-as-a-Service Subscription Models

The shift from capital expenditure to operating expenditure pricing unlocks the vast SME segment that finds upfront costs prohibitive. Cloud-connected counting platforms offering monthly per-door pricing between USD 50 and USD 120 are gaining traction, and the People Counting System Market could see SaaS-model revenue exceed 35% of total sales by 2030 [11].

Emerging-Market Smart-City Deployments

India's Smart Cities Mission has earmarked over USD 7.5 billion for urban infrastructure digitization across 100 cities, with passenger counting in metro stations and bus rapid transit corridors identified as priority use cases. Similar programs in Saudi Arabia (NEOM, Riyadh Metro) and Brazil (São Paulo Linha 6) present greenfield opportunities where the People Counting System Market can establish de novo installations rather than compete for retrofit budgets [10].

Data Monetization and Analytics Platforms

Counting hardware is increasingly becoming the entry point for broader spatial intelligence platforms. Vendors that layer heatmap analytics, queue management, and predictive staffing algorithms onto raw count data can command 3–5× the annual recurring revenue of hardware-only providers. This platform economics play transforms the People Counting System Market from a one-time sensor sale into a recurring analytics relationship [11].

Healthcare and Aged-Care Facility Monitoring

Hospitals and residential aged-care facilities represent an underpenetrated vertical where occupancy tracking serves both regulatory compliance (nurse-to-patient ratios) and operational safety (wandering detection). Japan's Ministry of Health estimates that 72% of aged-care facilities lack any automated occupancy monitoring, representing a USD 180 million addressable opportunity by 2030 [15].

Stadium and Large-Venue Crowd Management

Post-crowd-crush safety mandates — accelerated by incidents in Seoul (2022) and other high-density events — are pushing event venue operators toward real-time occupancy caps enforced by counting infrastructure. FIFA and UEFA now recommend sensor-based crowd monitoring as a best practice for venues above 20,000 capacity [21].


People Counting System Market Future Outlook

Edge AI and On-Device Intelligence

The migration of neural network inference from cloud servers to edge processors embedded within counting cameras will define the next phase of the People Counting System Market. By 2028, an estimated 75% of new video-based counting deployments will process data entirely on-device, eliminating cloud bandwidth costs and addressing privacy concerns simultaneously [7]. Qualcomm and Ambarella have both announced sub-3-watt AI vision processors specifically targeting the occupancy sensing segment.

Platform Economics and Analytics Convergence

Standalone counting hardware is evolving into a data layer within broader spatial intelligence platforms that combine occupancy data with POS transactions, HVAC controls, and digital signage triggers. The People Counting System Market will increasingly be valued not by sensor units shipped but by annual recurring analytics revenue, mirroring the SaaS transformation seen in cybersecurity and fleet management [11].

Sustainability and ESG-Driven Demand

As corporations face mandatory ESG disclosures — the EU's Corporate Sustainability Reporting Directive (CSRD) affects over 50,000 companies from 2025 — occupancy data becomes essential for calculating Scope 2 and Scope 3 per-capita energy intensity metrics. The People Counting System Market sits at the intersection of operational technology and sustainability reporting, a position that ensures demand persistence regardless of economic cycles [2].

Autonomous Building Operations

The concept of fully autonomous buildings — where lighting, HVAC, elevators, and security respond dynamically to real-time occupancy without human intervention — positions people counting as critical infrastructure rather than optional analytics. The International Energy Agency projects that autonomous building controls could reduce commercial building energy consumption by 30–40% by 2035, with occupancy sensing identified as the foundational data input [14].


People Counting System Market Segmentation

By Technology

Technology Segment Key Metric Primary Demand Driver
Video-Based (2D/3D Stereo) 42% market share (2025) AI accuracy and analytics integration
Thermal Imaging CAGR 14.1% Privacy-sensitive deployments
Infrared Beam USD 266 M (2025) Cost-effective single-entrance installs
Wi-Fi / Bluetooth Proximity CAGR 11.8% Large-venue zone analytics
LiDAR and Radar USD 74 M (2025) Outdoor and high-ceiling applications


Video-based counting dominates the People Counting System Market because modern 3D stereo-vision cameras deliver counting accuracies above 98% while simultaneously providing directional flow, height filtering, and group-size estimation — capabilities that simpler sensor types cannot match. The segment's growth is compounded by the falling cost of AI inference chips, which dropped 40% between 2022 and 2025 [5].

Thermal imaging has emerged as the fastest-growing technology segment precisely because it resolves the privacy tension that constrains video deployments. Thermal sensors detect body heat signatures without capturing identifiable features, making them the preferred choice in healthcare, government, and education settings where data protection scrutiny is highest [17]. The segment is particularly strong in Europe, where GDPR compliance drives procurement specifications.

By End User

End-User Segment Key Metric Primary Demand Driver
Retail 35% market share (2025) Conversion analytics, staff optimization
Transportation CAGR 13.6% Passenger flow and schedule optimization
Hospitality & Entertainment USD 222 M (2025) Venue capacity and crowd safety
Corporate / Commercial Buildings CAGR 12.8% Smart-building codes, energy efficiency
Government & Public Spaces 10% market share (2025) Security and crowd management
Others (Healthcare, Education) USD 74 M (2025) Compliance and safety monitoring


Retail remains the anchor vertical for the People Counting System Market because physical stores treat entrance traffic as the top-of-funnel metric equivalent to website visits in e-commerce. Major retail chains now integrate counting data directly into workforce management platforms, automatically adjusting cashier schedules in 15-minute increments based on predicted foot traffic [4].

Transportation hubs are the fastest-growing end-user segment, with transit authorities worldwide investing in real-time passenger load monitoring to optimize train dispatch frequencies, manage platform safety, and feed data into mobility-as-a-service platforms. The People Counting System Market benefits as these installations typically involve hundreds of sensors per project, creating high-value contracts [8].


Regional Market Share Analysis

Region Key Metric Primary Investment Themes
North America 38% market share (2025) Retail analytics, smart-building codes, campus security
Europe USD 414 M (2025) GDPR-compliant sensors, EPBD occupancy mandates
Asia-Pacific 14.8% CAGR (2026–2035) Smart-city programs, metro-rail expansion
South America USD 89 M (2025) BRT transit systems, shopping-mall modernization
Middle East & Africa 13.2% CAGR (2026–2035) Mega-projects, hajj crowd management, retail expansion
Total USD 1.48 B (2025)

The People Counting System Market exhibits a clear geographic hierarchy shaped by retail density, regulatory maturity, and smart-infrastructure investment.


North America

Country Key Metric Key Driver
United States 82% of regional share Big-box retail analytics, Title 24 codes
Canada CAGR 11.6% Transit authority modernization
Mexico USD 18 M (2025) Shopping-center expansion


North America's dominance in the People Counting System Market reflects the region's mature retail sector, where chains like Walmart, Target, and Macy's have made footfall analytics a standard component of store performance dashboards. The US Department of Energy's Better Buildings Initiative further incentivizes occupancy-responsive HVAC controls, pulling counting sensors into the commercial real-estate ecosystem [16].

Europe

Country Key Metric Key Driver
Germany 24% of regional share Industry 4.0 factory-floor monitoring
United Kingdom CAGR 12.5% High-street retail transformation
France USD 62 M (2025) Transport hub security
Rest of Europe 34% of regional share Nordic smart-building mandates


The People Counting System Market in Europe is uniquely shaped by the tension between data-rich analytics ambition and GDPR-driven privacy constraints. This regulatory environment has given European vendors like Xovis and DILAX a competitive edge in privacy-by-design architectures that process counting on-device without transmitting identifiable imagery [17].

Asia-Pacific

Country Key Metric Key Driver
China 46% of regional share Smart-city surveillance and retail chains
India CAGR 16.2% Metro-rail and Smart Cities Mission
Japan USD 48 M (2025) Aged-care and retail labor optimization
South Korea CAGR 13.8% 5G-connected retail analytics
Rest of Asia-Pacific 18% of regional share Southeast Asian retail expansion


Asia-Pacific's rapid growth within the People Counting System Market reflects a convergence of government-funded mass-transit projects and an expanding organized retail sector. China's 14th Five-Year Plan allocated over USD 12 billion to smart-city infrastructure, with pedestrian flow monitoring explicitly listed as a priority technology vertical [10].

South America

Country Key Metric Key Driver
Brazil 58% of regional share Shopping-center and BRT systems
Rest of South America CAGR 11.4% Airport modernization


Brazil drives the South American People Counting System Market through its extensive network of shopping centers — the fifth-largest globally — and bus rapid transit corridors in cities like Curitiba and São Paulo that increasingly require automated passenger load data for fare optimization [12].

Middle East & Africa

Country Key Metric Key Driver
UAE 32% of regional share Mall-of-the-future and expo venues
Saudi Arabia CAGR 14.5% NEOM, Riyadh Metro, Vision 2030
Rest of MEA USD 36 M (2025) Hajj crowd management, airport expansion


The People Counting System Market in MEA benefits from mega-project construction cycles that embed counting sensors at the design stage rather than as retrofits. Saudi Arabia's Riyadh Metro — with 85 stations across six lines — specified real-time passenger counting as a contractual requirement during its 2023 procurement phase [10].


People Counting System Market By Region, 2025-2035

Competitive Benchmarking

The People Counting System Market is moderately fragmented, with an estimated Herfindahl-Hirschman Index (HHI) below 800 and the top five players collectively holding approximately 32–38% of global revenue. Competition spans specialized pure-play counting vendors, diversified surveillance-camera manufacturers adding counting features, and analytics-first software platforms integrating third-party sensors.

Company Est. Revenue Share Range Key Offerings Strategic Positioning
RetailNext ~6–9% Aurora sensor suite, cloud analytics platform Full-stack retail analytics
Axis Communications ~5–8% P8815-2 3D counter, ACAP analytics Surveillance-integrated counting
Xovis ~4–7% PC2S stereo sensor, flow monitoring Premium accuracy, transport focus
DILAX ~3–6% DCS sensors, transit analytics European transit specialist
Hikvision ~4–7% DeepinView counters, AI NVRs Price-competitive, broad portfolio
SensMax ~2–4% SensMax TAC-B radar counters Budget-tier, Eastern Europe focus
Teledyne FLIR ~3–5% Brickstream 3D+ sensors Thermal and stereo hybrid
ShopperTrak (Sensormatic) ~5–8% Thermal and video counters, analytics Legacy retail installed base
V-Count ~2–4% Ultima AI, Ultima Go sensors Cloud-native, SME-oriented
FootfallCam ~2–3% 3D Pro2 counter, Centroid software API-first, integrator-friendly


Recent News & Developments


  • Axis Communications (March 2025): Released an ACAP-based occupancy analytics application for its P-series cameras, enabling existing surveillance infrastructure to add counting capabilities without new hardware [Ref 7].


  • European Commission (January 2025): Published technical guidance under the EPBD recast specifying minimum sensor accuracy standards (≥95%) for occupancy-responsive ventilation systems, effectively creating a regulatory floor that favors advanced counting technologies [Ref 2].
  • Hikvision (November 2024): Introduced DeepinView series dual-lens counters with on-device privacy masking at under USD 400 per unit, targeting price-sensitive emerging markets [Ref 12].


  • Sensormatic Solutions (Johnson Controls) (August 2024): Integrated ShopperTrak counting data with OpenBlue building management platform, creating a unified occupancy and energy optimization dashboard for commercial real estate operators [Ref 16].


People Counting System Market Report Scope

Parameter Detail
Market Scope Global People Counting System Market covering hardware, software, and services
Study Period 2021–2035
CAGR 12.3% (2026–2035)
Market Size — 2025 USD 1.48 Billion
Market Size — 2035 USD 4.72 Billion
Fastest Growing Technology Thermal Imaging (CAGR 14.1%)
Fastest Growing End User Transportation (CAGR 13.6%)
Fastest Growing Region Asia-Pacific (CAGR 14.8%)
Companies Profiled 10 (RetailNext, Axis Communications, Xovis, DILAX, Hikvision, SensMax, Teledyne FLIR, ShopperTrak, V-Count, FootfallCam)
Valuation Currency USD (Billion)
CAGR Driver Disclaimer Impact percentages in Sections 4–5 are directional estimates, not additive components of the stated CAGR


FAQs

How does counting accuracy differ between stereo-vision and time-of-flight sensors in high-traffic doorways?
Stereo-vision sensors achieve 98–99% accuracy at up to 200 people per minute, while time-of-flight sensors average 95–97% accuracy but cost 30% less per unit. Stereo-vision excels in wide entrances; time-of-flight suits narrow single-door setups [3].
What typical payback period should a retailer expect from a counting system investment?
Most mid-sized retailers recover their investment in 10–16 months through improved staff scheduling and conversion-rate optimization. Stores with over 5,000 daily visitors tend to see faster payback due to higher data-driven savings [4].
Can existing CCTV infrastructure be repurposed for people counting?
Yes, several vendors offer software-only analytics layers that run on compatible IP cameras, avoiding new hardware costs. Accuracy depends on camera angle and resolution, typically reaching 90–94% versus 98% for purpose-built sensors [7].
How do GDPR and BIPA affect vendor selection for multinational deployments?
Buyers should prioritize vendors offering on-device processing and no-image-storage architectures. Multinational chains often deploy thermal sensors in regulated markets and video-based units elsewhere to balance accuracy with compliance [17].
What maintenance cadence do people counting sensors typically require?
Most modern sensors need only annual lens cleaning and firmware updates. Cloud-connected units receive over-the-air patches automatically, reducing on-site maintenance visits to once per year [5].
How are counting systems integrating with digital signage and queue management?
Leading platforms trigger dynamic content on digital displays based on real-time zone density. When queue lengths exceed thresholds, the system can open additional checkout lanes and redirect foot traffic via signage [11].
What role does LiDAR play compared to camera-based systems in outdoor counting?
LiDAR sensors operate reliably in direct sunlight, rain, and darkness where cameras struggle. They cost 2–3× more per unit but dominate outdoor plazas, theme parks, and transit platforms where environmental conditions vary widely [19].    
Author
Author
Author Profile
Aarti Dhapte LinkedIn
AVP - Research
A consulting professional focused on helping businesses navigate complex markets through structured research and strategic insights. I partner with clients to solve high-impact business problems across market entry strategy, competitive intelligence, and opportunity assessment. Over the course of my experience, I have led and contributed to 100+ market research and consulting engagements, delivering insights across multiple industries and geographies, and supporting strategic decisions linked to $500M+ market opportunities. My core expertise lies in building robust market sizing, forecasting, and commercial models (top-down and bottom-up), alongside deep-dive competitive and industry analysis. I have played a key role in shaping go-to-market strategies, investment cases, and growth roadmaps, enabling clients to make confident, data-backed decisions in dynamic markets.
Co-Author
Co-Author Profile
Shubham Munde LinkedIn
Team Lead - Research
Shubham brings over 7 years of expertise in Market Intelligence and Strategic Consulting, with a strong focus on the Automotive, Aerospace, and Defense sectors. Backed by a solid foundation in semiconductors, electronics, and software, he has successfully delivered high-impact syndicated and custom research on a global scale. His core strengths include market sizing, forecasting, competitive intelligence, consumer insights, and supply chain mapping. Widely recognized for developing scalable growth strategies, Shubham empowers clients to navigate complex markets and achieve a lasting competitive edge. Trusted by start-ups and Fortune 500 companies alike, he consistently converts challenges into strategic opportunities that drive sustainable growth.

Research Approach


Secondary Research

The secondary research process involved comprehensive analysis of regulatory databases, technical standards repositories, peer-reviewed engineering journals, IoT industry publications, and authoritative technology organizations. Key sources included the International Organization for Standardization (ISO), Institute of Electrical and Electronics Engineers (IEEE), International Electrotechnical Commission (IEC), National Institute of Standards and Technology (NIST), US Department of Transportation (DOT) Intelligent Transportation Systems, European Committee for Electrotechnical Standardization (CENELEC), American Society of Mechanical Engineers (ASME), National Retail Federation (NRF), Retail Industry Leaders Association (RILA), International Council of Shopping Centers (ICSC), Bureau of Transportation Statistics (BTS), Federal Aviation Administration (FAA), US Census Bureau Economic Indicators, Eurostat Digital Economy & Society Statistics, World Bank Smart Cities Data, National Association of Convenience Stores (NACS), and government smart city initiatives from Singapore (GovTech), Dubai (Smart Dubai Office), and Barcelona (City Council). These sources were used to collect technology adoption statistics, regulatory compliance data, safety standards, infrastructure development trends, and market landscape analysis for infrared sensors, video analytics, laser-based systems, and Wi-Fi-based people counting technologies.


Primary Research

To gather both qualitative and quantitative insights, supply-side and demand-side stakeholders were interviewed during the primary research phase. CEOs, CTOs, VPs of Product Development, heads of AI/Machine Learning departments, and commercial directors from people counting system makers, sensor technology suppliers, and video analytics software firms were examples of supply-side sources. Procurement leads from retail chains, transit authorities, commercial real estate companies, and public sector infrastructure agencies were among the demand-side sources, along with retail operations directors, facility managers, planners from the transportation authority, smart building consultants, and airport operations managers. Market segmentation was validated, product development roadmaps were confirmed, and information on pricing models, integration difficulties, technology adoption trends, and return on investment (ROI) metrics for retail analytics, transportation management, and building automation applications was obtained through primary research.

Primary Respondent Breakdown:

By Designation: C-level Executives (28%), Director Level (32%), Others (40%)

By Region: North America (32%), Europe (30%), Asia-Pacific (33%), Rest of World (5%)


Market Size Estimation

Global market valuation was derived through revenue mapping and deployment volume analysis. The methodology included:

Identification of 50+ key technology providers across North America, Europe, Asia-Pacific, and Middle East & Africa

Product mapping across infrared sensors, video analytics, laser-based systems, and Wi-Fi-based technologies

Analysis of reported and modeled annual revenues specific to people counting system portfolios

Coverage of manufacturers representing 75-80% of global market share in 2024

Extrapolation using bottom-up (deployment volume × ASP by vertical/region) and top-down (manufacturer revenue validation) approaches to derive segment-specific valuations for hardware, software, and service components

Download Free Sample

Kindly complete the form below to receive a free sample of this Report

Download PDF ×

We do not share your information with anyone. However, we may send you emails based on your report interest from time to time. You may contact us at any time to opt-out.

















