Photoresist Market (2026 - 2035)

Photoresist Market Size, Share and Research Report By Application (Semiconductor & IC, and LCD), By Ancillary Type (Anti-reflective Coating, Remover, Developer), By Photoresist Type (ArF Immersion, ArF Dry Film, KrF, G-line & I-line), And By Region (North America, Europe, Asia-Pacific, And Rest Of The World) โ€“Industry Forecast Till 2035
ID: MRFR/SEM/16230-HCR
200 Pages
Ankit Gupta
Last Updated: June 26, 2026
Photoresist Market
Market Size
Forecast Period2026-2035
CAGR (2026-2035)10.50%
2025 Market SizeUSD 3.09 Billion
2035 Market SizeUSD 8.47 Billion
Key Players
Tokyo Ohka Kogyo
JSR Corporation
Shin-Etsu Chemical
Fujifilm Electronic Materials
DuPont
Merck KGaA
Opportunities
  • High-NA EUV Resist Platforms
  • Regionalized Resist Manufacturing Hubs
  • Advanced Packaging Resist Demand

Photoresist Market Summary

The global Photoresist Market reached an estimated USD 3.09 billion in 2025 and is projected to grow from USD 3.45 billion in 2026 to USD 8.47 billion by 2035, registering a CAGR of 10.50% during the forecast period. Government-backed semiconductor localization programs โ€” including the U.S. CHIPS and Science Act allocating USD 52.7 billion and the EU Chips Act committing EUR 43 billion โ€” are reshaping resist supply chains and compelling manufacturers to establish blending and quality-assurance operations closer to new fab clusters [2][3].

A technology inflection is well underway. Legacy KrF and g-line formulations still serve cost-optimized nodes for automotive microcontrollers and display panels, but EUV lithography has moved decisively from pilot lines into high-volume manufacturing at sub-5 nm logic nodes. Metal-oxide dry resists are now essential where chemically amplified platforms cannot manage photon shot noise and line-edge roughness at acceptable yields [4]. Capital expenditure across the top five foundries exceeded USD 130 billion in 2024 alone, pulling advanced resist consumption upward [5].

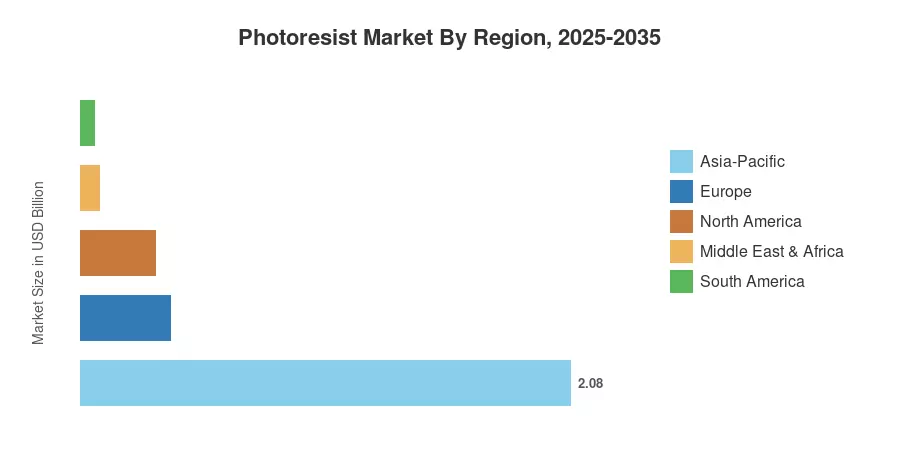
Asia-Pacific dominates the Photoresist Market with a 67.2% revenue share in 2025, anchored by fabrication clusters in Taiwan, South Korea, and Japan. North America is the fastest-growing region, expanding at a 10.50% CAGR through 2035 as greenfield fab projects in Arizona, Ohio, and Texas catalyze local resist demand. Europe holds the second-largest share outside Asia-Pacific, driven by automotive-grade semiconductor expansion in Germany and the Netherlands. The decade ahead will be defined by resist chemistry innovation tracking alongside continued node shrinkage and heterogeneous integration architectures.

ย 

Key Report Takeaways

โ€ข By Resist Type

  • ArF immersion formulations commanded 34.1% of the Photoresist Market share in 2025, reflecting continued dominance at mature immersion nodes.
  • EUV metal-oxide and dry resists are projected to expand at an 11.90% CAGR through 2035, driven by sub-3 nm logic ramps.

โ€ข By Tone

  • Positive-tone resists captured 76.3% of the Photoresist Market revenue in 2025.
  • Negative-tone resists post the fastest growth at a 10.40% CAGR to 2035, propelled by advanced packaging and 3D-NAND lithography layers.

โ€ข By Application

  • Semiconductors and ICs accounted for 58.5% of Photoresist Market demand in 2025.
  • Advanced packaging applications are set to grow at an 11.00% CAGR through 2035.

โ€ข By End-User Industry

  • Electronics and electricals represented 65.4% of the Photoresist Market in 2025.
  • Automotive and mobility end users are expanding at a 10.90% CAGR, the fastest among all verticals.

โ€ข By Region

  • Asia-Pacific held a 67.2% share of the Photoresist Market in 2025.
  • North America is forecast to grow at a 10.50% CAGR through 2035.

ย 

Photoresist Market Size and Forecast (2021โ€“2035)

Market Research Future's proprietary estimation framework combines bottom-up semiconductor wafer-start models, resist consumption-per-layer coefficients, and fab-level capacity announcements across more than 200 fabrication facilities globally. Historical values (2021โ€“2024) are derived from audited financial disclosures of leading resist suppliers and verified against trade data from SEMI and the Japan Electronics and Information Technology Industries Association (JEITA)[6].
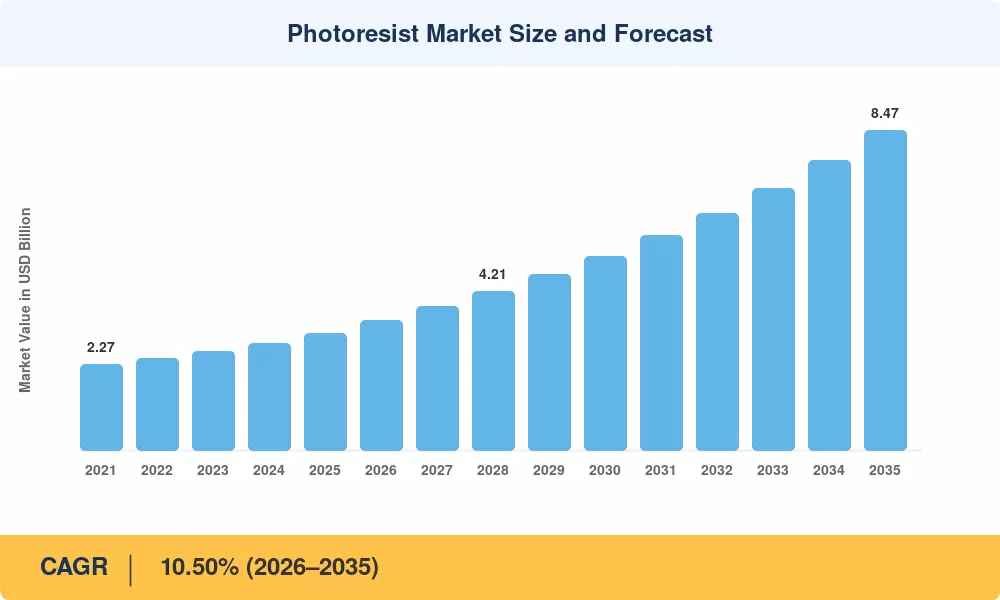
Photoresist Market Size and Forecast
Our Impact
Enabled $4.3B Revenue Impact for Fortune 500 and Leading Multinationals
Partnering with 2000+ Global Organizations Each Year
30K+ Citations by Top-Tier Firms in the Industry

Driver Impact Analysis

Driver ~% Impact on CAGR Geographic Relevance Impact Timeline
EUV and high-NA EUV layer proliferation ~22% Global (Taiwan, S. Korea, US) Medium-term
CHIPS Act and EU Chips Act fab localization ~18% North America, Europe Short-to-medium-term
AI/HPC chip demand surges ~17% Global Short-term
Automotive semiconductor content growth ~14% Asia-Pacific, Europe Medium-term
Advanced packaging (chiplet, 2.5D/3D) adoption ~12% Asia-Pacific, North America Medium-term
Display technology migration (OLED, micro-LED) ~9% Asia-Pacific Long-term
IoT and edge compute proliferation ~8% Global Long-term

ย 

EUV and High-NA EUV Layer Proliferation

Today, foundries are exposing 15-20 EUV layers on an advanced logic wafer at the 3-nm node, compared with just five levels at 7 nm. Initial production of ASML's high-NA EUV systems (0.55 NA) started in 2025, and there are projections for more than 20 tools to be installed by 2028, each requiring metal-oxide resist platforms with advanced resolution and reduced defectivity standards [4][7]. This increase in layers directly correlates to increased resist consumption per wafer and premium price mix, as EUV resists are priced three to five times more per liter than ArF immersion formulations.

ย 

CHIPS Act and EU Chips Act Fab Localization

As of early 2025, preliminary grants totaling more than USD 36 billion have been granted for 16 projects under the U.S. CHIPS and Science Act, including TSMC's Arizona campus, Samsung's Taylor fab, Intel's Ohio mega-site, and Micron's New York and Idaho facilities [2]. Every new fab needs a local resist supply ecosystem, including blending, filtering, and analytical quality-control facilities within a 48-hour logistics radius. The EU Chips Act follows this trend with EUR 43 billion dedicated to enhancing European wafer capacity, encouraging resist suppliers such as Merck KGaA and JSR to set up or enlarge European blending centers [3].

ย 

AI and HPC Chip Demand Surge

Global spending on AI-optimized semiconductors surpassed USD 70 billion in 2024. Training and inference accelerators at 3 nm and below consume photoresist at elevated rates due to larger die sizes and higher EUV layer counts. This translates to a disproportionate pull on advanced resist chemistries relative to mainstream node production.

Automotive Semiconductor Content Growth

The average semiconductor content per vehicle rose from around USD 600 in 2021 to more than USD 1,000 in 2025, led by ADAS, electric powertrains, and in-car infotainment designs. Automotive chips are largely produced using mature 28โ€“65 nm nodes, and the volume expansion considerably boosts the usage of KrF and i-line resists, giving a steady revenue floor for the Photoresist Market to rise above.

ย 

ย 

Restraints Impact Analysis

Restraint ~% Drag on CAGR Geographic Relevance Impact Timeline
Concentrated raw material supply chain ~โ€“6% Global Short-term
Stringent PFAS and chemical regulations ~โ€“5% Europe, North America Medium-term
High cost of EUV resist qualification ~โ€“4% Global Medium-term
Geopolitical export controls on resist precursors ~โ€“3% East Asia, US Short-term
Defectivity and yield challenges at sub-3 nm ~โ€“3% Global Long-term

ย 

Concentrated Raw-Material Supply Chain

Japan has only a handful of specialty chemical companies that produce more than 80% of the key photoresist intermediates, including photoacid generators (PAGs), quencher molecules, and resin platforms [13]. Single-source dependence exposed itself as fragile, as seen in the 2024 Noto earthquake and pandemic-era logistics difficulties. Resist suppliers are gradually approving secondary sources, but top foundries often require 12-18 months for requalification cycles, which hampers diversification.

ย 

Stringent PFAS and Chemical Regulations

The European Chemicals Agency's proposed universal PFAS restriction, expected to advance through regulatory review by 2026, could affect fluorinated surfactants and certain PAG chemistries embedded in ArF immersion and EUV resist formulations [14]. Reformulation costs and extended re-qualification timelines may temporarily constrain capacity and inflate per-liter pricing in the Photoresist Market, particularly for European fab operations.

Geopolitical Export Controls

In 2023, Japan decided to impose license requirements for shipments of advanced semiconductor materials to specified destinations, including certain EUV resist chemicals, which increased 4 to 8 weeks of lead time for impacted customers [15]. Continued U.S.-China tech decoupling is further fragmenting the global resist supply network, forcing international suppliers to maintain duplicative inventory positions.

ย 

ย 

Photoresist Market Opportunities

High-NA EUV Resist Platforms

The transition to 0.55 NA EUV lithography demands an entirely new class of resist materials optimized for tighter aerial image contrast and lower dose-to-size sensitivity. Suppliers that secure early qualification on high-NA pilot lines stand to capture premium pricing lasting well into the 2030s.

Regionalized Resist Manufacturing Hubs

CHIPS Act and EU Chips Act subsidies create a greenfield opportunity for resist blending facilities in North America and Europe. Establishing localized production reduces logistics risk and aligns with fab operators' just-in-time procurement strategies.

Advanced Packaging Resist Demand

Chiplet-based architectures and 2.5D/3D integration are scaling rapidly, with the advanced packaging addressable market expected to surpass USD 65 billion globally by 2030 [10]. Thick-film and dry-film resists used in redistribution layers and through-silicon vias represent a fast-growing Photoresist Market segment.

Emerging-Market Fab Investments

India's USD 10 billion semiconductor incentive program and Southeast Asian governments' fab-attraction strategies are seeding new demand pockets for photoresist outside traditional East Asian clusters [16]. Early movers that establish technical support and distribution networks in these markets gain a structural first-mover advantage.

Data-Driven Resist Optimization Services

Resist suppliers are beginning to monetize process-analytics platforms that use machine-learning models to optimize coatโ€“exposeโ€“develop recipes in real time, reducing rework and improving yield.

ย 

Photoresist Market Future Outlook

AI-Driven Semiconductor Demand Supercycle

Training clusters built on 3 nm and 2 nm accelerators will require 20-plus EUV resist layers per wafer, sustaining premium resist consumption growth well beyond the current cycle. The Photoresist Market will track AI capex intensity as a leading demand indicator throughout this decade.

Advanced Node and Resist Chemistry Co-Evolution

Gate-all-around transistor architectures, backside power delivery networks, and complementary FET (CFET) designs arriving in the 2028โ€“2032 window will demand resist platforms with sub-10 nm resolution, ultra-low defectivity, and compatibility with novel underlayer stacks [4]. Resist suppliers investing in metal-containing and hybrid organicโ€“inorganic chemistries are positioning for this next inflection in the Photoresist Market.

Sustainability and Green Chemistry Mandates

The semiconductor industry's Scope 3 emissions commitments are pushing resist manufacturers to reformulate products that reduce per-layer solvent consumption and eliminate PFAS-containing components [14]. Life-cycle-assessment-driven procurement is emerging as a differentiator, particularly among European fabs subject to the EU Corporate Sustainability Reporting Directive (CSRD). Resist companies that demonstrate measurable environmental improvements and stand to secure preferential supplier status.

Heterogeneous Integration and Packaging-Level Lithography

Chiplet-based design is reshaping Photoresist Market demand by shifting lithography layers from front-end transistor patterning toward back-end redistribution, fan-out wafer-level packaging, and hybrid bonding processes [10]. SEMI projects pulling thick-film and dry-film resist consumption upward and diversifying the market's application mix beyond traditional wafer-level exposure.

ย 

Photoresist Market Segmentation

By Resist Type

Segment Key Metric Primary Demand Driver
ArF Immersion 34.1% share (2025) Mature immersion nodes (7โ€“28 nm)
ArF Dry USD 0.31 Billion (2025) Legacy 65โ€“45 nm production
KrF 8.9% CAGR (2026โ€“2035) Automotive and IoT nodes
G-Line USD 0.14 Billion (2025) Display and thick-film applications
I-Line 15.8% share (2025) Power semiconductor and MEMS
EUV Metal-Oxide 11.90% CAGR (2026โ€“2035) Sub-5 nm logic and memory
Other Types USD 0.09 Billion (2025) Specialty and e-beam resists

ย 

ArF immersion resists remain the workhorse of the Photoresist Market, serving the 7 nm through 28 nm process window that encompasses the majority of global wafer starts. These chemically amplified formulations benefit from decades of optimization, offering predictable process latitude, low defectivity, and broad vendor qualification across multiple foundries and IDMs.

EUV metal-oxide resists represent the technology frontier. Unlike chemically amplified predecessors, metal-oxide platforms use inorganic tinโ€“oxygen clusters that deliver higher EUV absorption and reduced shot-noise sensitivity. As leading foundries push past 3 nm into 2 nm and eventually angstrom-class nodes, EUV resist consumption per wafer will continue to climb, making this the fastest-growing segment in the Photoresist Market over the coming decade.

By Tone

Segment Key Metric Primary Demand Driver
Positive 76.3% share (2025) Standard lithography patterning
Negative 10.40% CAGR (2026โ€“2035) 3D-NAND, advanced packaging

ย 

Positive-tone resists dominate because the semiconductor industry's standard development processes dissolve exposed regions, making positive tone the default for most front-end lithography steps. Negative-tone resists are gaining ground in specific applications โ€” particularly multi-patterning sequences and advanced packaging redistribution layers โ€” where pattern-transfer requirements favor cross-linking chemistry.

By Application

Segment Key Metric Primary Demand Driver
Semiconductors & ICs 58.5% share (2025) Logic, memory, and analog fabrication
Advanced Packaging 11.00% CAGR (2026โ€“2035) Chiplet, 2.5D/3D integration
Displays USD 0.28 Billion (2025) OLED and micro-LED patterning
PCBs 7.2% share (2025) 5G infrastructure, HDI boards
MEMS 6.8% CAGR (2026โ€“2035) Automotive sensors, IoT devices
Other USD 0.07 Billion (2025) Photovoltaic, biomedical devices

ย 

Semiconductors and ICs represent the core of the Photoresist Market, driven by relentless node migration and expanding wafer starts across logic, DRAM, and NAND flash production. Advanced packaging is the standout growth segment as the industry transitions from monolithic die designs to chiplet-based architectures requiring multiple lithography-intensive redistribution and bonding steps.

By End-User Industry

Segment Key Metric Primary Demand Driver
Electronics & Electricals 65.4% share (2025) Consumer devices, computing
Automotive & Mobility 10.90% CAGR (2026โ€“2035) ADAS, EV power electronics
Aerospace & Defense USD 0.11 Billion (2025) Rad-hard and specialty ICs
Consumer Packaged Goods 5.1% share (2025) Smart packaging, RFID tags
Other 7.4% CAGR (2026โ€“2035) Industrial, medical, telecom

ย 

Electronics and electricals dominate end-user demand, encompassing smartphone, PC, data-center, and consumer-appliance semiconductor consumption. Automotive and mobility is the fastest-growing end-user category in the Photoresist Market, propelled by rising silicon content per vehicle and the global electrification transition that demands power semiconductor, sensor, and connectivity chips in growing volumes.

ย 

Regional Market Share Analysis

Region Key Metric Primary Investment Themes
Asia-Pacific 67.2% share (2025) Foundry leadership, memory expansion
North America 10.50% CAGR (2026โ€“2035) CHIPS Act fabs, AI chip demand
Europe USD 0.38 Billion (2025) Automotive semiconductors, EU Chips Act
South America 2.1% share (2025) Consumer electronics assembly
Middle East & Africa USD 0.08 Billion (2025) Early-stage fab feasibility studies
Total USD 3.09 Billion (2025) โ€”

The Photoresist Market remains heavily concentrated in Asia-Pacific, where the majority of global wafer fabrication capacity is installed. Government-led fab localization programs are gradually redistributing demand toward North America and Europe.

ย 

North America

Country Key Metric Key Driver
United States 82.4% of regional share CHIPS Act fab projects (AZ, OH, TX)
Canada 6.7% CAGR (2026โ€“2035) Photonics and sensor fabs
Mexico USD 0.02 Billion (2025) Back-end packaging facilities

ย 

The United States anchors North American demand as TSMC, Intel, Samsung, and Micron bring greenfield fabs online between 2025 and 2029 [2]. These facilities collectively represent more than 500,000 wafer-starts-per-month of incremental capacity, each requiring localized resist supply within a tight logistics window. Canada's photonics-focused semiconductor ecosystem in Ottawa and Waterloo drives niche resist consumption, while Mexico's expanding back-end assembly base sustains modest demand for thick-film resist products.

Europe

Country Key Metric Key Driver
Germany 31.5% of regional share Automotive chip fabs (Infineon, Bosch)
United Kingdom USD 0.03 Billion (2025) Compound semiconductor R&D
France 7.9% CAGR (2026โ€“2035) STMicroelectronics expansion
Italy USD 0.02 Billion (2025) Power semiconductor production
Spain 3.1% of regional share Emerging sensor fab projects
Nordic Countries 5.8% of regional share Specialty MEMS fabrication
Russia USD 0.01 Billion (2025) Domestic self-sufficiency initiatives
Rest of Europe 6.4% of regional share Netherlands (ASML ecosystem), Belgium (imec)

ย 

Germany leads the European Photoresist Market demand through Infineon's Dresden mega-fab and Bosch's Reutlingen 300 mm facility, both targeting automotive-grade 28โ€“65 nm production. The Netherlands plays an outsized role through ASML's lithography ecosystem and imec's advanced patterning research center, which qualifies next-generation resists ahead of volume manufacturing. The EU Chips Act aims to double Europe's global semiconductor production share to 20% by 2030, unlocking substantial incremental resist consumption [3].

Asia-Pacific

Country Key Metric Key Driver
China 28.4% of regional share Mature-node self-sufficiency push
India 12.30% CAGR (2026โ€“2035) Government USD 10B incentive scheme
Japan USD 0.46 Billion (2025) Resist R&D hub, Rapidus 2 nm fab
South Korea 24.1% of regional share Samsung, SK hynix memory and logic
ASEAN 7.6% of regional share Back-end packaging and test
Rest of Asia-Pacific USD 0.10 Billion (2025) Taiwan foundry cluster

ย 

Asia-Pacific's dominance in the Photoresist Market stems from its unmatched concentration of leading-edge and mature-node fabs. Taiwan alone accounts for roughly 60% of global foundry revenue, though its resist demand is captured within the broader regional total. Japan functions simultaneously as the world's largest resist production base and a significant consumption center, with Rapidus targeting 2 nm production by 2027 [17]. China's aggressive mature-node buildout โ€” projected to add over 20 new fabs by 2028 โ€” drives substantial KrF and i-line resist volumes despite export controls limiting access to the most advanced EUV chemistries [15].

South America

Country Key Metric Key Driver
Brazil 64.3% of regional share Consumer electronics PCB assembly
Argentina USD 0.005 Billion (2025) Limited domestic fab activity
Rest of South America 5.2% CAGR (2026โ€“2035) Emerging electronics manufacturing

ย 

South America's Photoresist Market remains nascent, with demand concentrated in Brazil's consumer electronics assembly corridor in Manaus. Government incentives under the PADIS program support modest semiconductor packaging operations, but the region lacks front-end wafer fabrication and therefore relies primarily on imported resist for PCB and display panel applications.

Middle East & Africa

Country Key Metric Key Driver
Saudi Arabia 32.1% of regional share Vision 2030 tech manufacturing
UAE USD 0.02 Billion (2025) Smart city sensor fabrication
South Africa 14.7% of regional share Telecommunications equipment
Egypt 4.8% CAGR (2026โ€“2035) Early electronics assembly
Rest of MEA USD 0.01 Billion (2025) Nascent semiconductor interest

ย 

The Middle East and Africa represent a small but strategically watched frontier for the Photoresist Market. Saudi Arabia's Vision 2030 has earmarked investments in domestic technology manufacturing, including feasibility studies for a national semiconductor fabrication facility. The UAE's focus on smart-city infrastructure generates niche demand for sensor-grade MEMS resist products, though volumes remain modest relative to established production regions.

ย 

Photoresist Market By Region, 2025-2035

Competitive Benchmarking

The Photoresist Market exhibits high concentration, with the top five suppliers โ€” Tokyo Ohka Kogyo, JSR Corporation, Shin-Etsu Chemical, Fujifilm, and DuPont โ€” collectively holding an estimated 70โ€“78% of global revenue. The Herfindahl-Hirschman Index (HHI) exceeds 1,800, indicating a moderately concentrated to concentrated market structure. Barriers to entry are formidable: resist qualification at a leading foundry typically requires 18โ€“24 months and investment of USD 30โ€“50 million in application development, defectivity testing, and process-of-record acceptance [13].

Company Est. Revenue Share Range Key Offerings for the Photoresist Market Strategic Positioning
Tokyo Ohka Kogyo (TOK) ~18โ€“22% ArF, KrF, EUV resists; ancillary materials Full-spectrum resist leader with deep foundry relationships
JSR Corporation ~14โ€“18% ArF immersion, EUV metal-oxide (Inpria) EUV-first strategy post-Inpria acquisition
Shin-Etsu Chemical ~12โ€“16% ArF, KrF resists; silicone-based platforms Vertically integrated with proprietary resin synthesis
Fujifilm Electronic Materials ~8โ€“12% ArF, i-line, packaging resists Diversified materials portfolio across nodes
DuPont ~7โ€“10% ArF, anti-reflective coatings, and CMP slurries Integrated electronic materials platform
Merck KGaA ~5โ€“8% AZ-brand resists, specialty developers European anchor with strong automotive-node presence
Dongjin Semichem ~4โ€“6% KrF, i-line, display resists Cost-competitive Korean supplier to memory fabs
Sumitomo Chemical ~3โ€“5% ArF, i-line, specialty resist platforms Chemical conglomerate with resist division scale
Everlight Chemical ~2โ€“4% PCB and display resists Asia-Pacific specialty and mid-tier node focus
Kempur Microelectronics ~1โ€“3% KrF, i-line resists for the domestic China market Beneficiary of China's self-sufficiency mandates

ย 

ย 

Recent News & Developments

  • JSR Corporation (March 2025): Completed USD 6.2 billion take-private by JIC, consolidating EUV resist R&D under government-aligned strategic ownership in Japan [17]. Accelerates Inpria metal-oxide resist commercialization.

ย 

ย 

ย 

  • U.S. Department of Commerce (August 2024): Finalized preliminary CHIPS Act awards exceeding USD 6.4 billion for Samsung's Taylor, Texas fab complex, triggering resist supplier co-location planning [2].
  • ASML (June 2024): Shipped the first high-NA EUV scanner (TWINSCAN EXE:5000) to Intel's Oregon facility, initiating resist qualification programs at the 0.55 NA exposure threshold [7].
  • Shin-Etsu Chemical (April 2024): Expanded ArF immersion resist production capacity at its Naoetsu plant by 25%, responding to accelerating demand from foundry customers [21].
  • European Commission (February 2024): Approved EUR 1.6 billion in state aid for a STMicroelectronicsโ€“GlobalFoundries joint fab in Crolles, France, with resist supply commitments embedded in the project framework [3].

ย 

Photoresist Market Report Scope

Parameter Detail
Market Scope Global Photoresist Market across resist type, tone, application, end-user, region
Study Period 2021โ€“2035
CAGR 10.50% (2026โ€“2035)
Base Year Market Size USD 3.09 Billion (2025)
Forecast End Market Size USD 8.47 Billion (2035)
Fastest Growing Segment EUV Metal-Oxide Resists (11.90% CAGR)
Companies Profiled 10 (TOK, JSR, Shin-Etsu, Fujifilm, DuPont, Merck KGaA, Dongjin Semichem, Sumitomo Chemical, Everlight Chemical, Kempur Microelectronics)
Valuation Currency USD Billion

ย 

ย 

FAQs

How does high-NA EUV differ from standard EUV in resist requirements?
High-NA systems (0.55 NA) deliver a smaller aerial image, requiring resists with lower activation thresholds and tighter defectivity tolerances. Resist thickness is typically halved to around 20 nm, demanding new underlayer and etch-transfer integration [7].
What qualification barriers prevent new photoresist entrants?
A resist must pass 12โ€“18 months of defectivity, overlay, and process-window testing at a foundry before earning process-of-record status. The investment typically exceeds USD 30 million per product-node combination [13].
How are PFAS regulations affecting resist formulation strategies?
Proposed EU PFAS restrictions target fluorinated surfactants used in some ArF and EUV developers. Suppliers are reformulating with non-fluorinated alternatives, though requalification timelines add 6โ€“12 months of transition risk [14].
What role does China's domestic resist production play in global supply dynamics?
Chinese suppliers such as Kempur serve mature KrF and i-line nodes, capturing roughly 5โ€“8% of domestic consumption. Advanced EUV resists remain import-dependent due to technology and export-control constraints [15].
How does advanced packaging change photoresist consumption patterns?
Chiplet-based designs add 3โ€“5 additional lithography layers for redistribution and bonding steps, each requiring thick-film or dry-film resists distinct from front-end chemistries [10].
Which resist type offers the highest gross margins for suppliers?
EUV metal-oxide resists command per-liter prices three to five times higher than ArF immersion. Lower production volumes are offset by premium pricing, yielding estimated gross margins above 60% [13].
How are resist suppliers addressing fab-localization mandates?
Major suppliers are building satellite blending and QA facilities near CHIPS Act and EU Chips Act fabs. TOK, Shin-Etsu, and JSR have all announced North American or European facility investments since 2024 [18][20]. ย  ย 
Author
Author
Author Profile
Ankit Gupta LinkedIn
Team Lead - Research
Ankit Gupta is a seasoned market intelligence and strategic research professional with over six plus years of experience in the ICT and Semiconductor industries. With academic roots in Telecom, Marketing, and Electronics, he blends technical insight with business strategy. Ankit has led 200+ projects, including work for Fortune 500 clients like Microsoft and Rio Tinto, covering market sizing, tech forecasting, and go-to-market strategies. Known for bridging engineering and enterprise decision-making, his insights support growth, innovation, and investment planning across diverse technology markets.

Research Approach

ย 

Secondary Research

The secondary research process involved comprehensive analysis of regulatory databases, peer-reviewed scientific journals, technical publications, and authoritative semiconductor industry organizations. Key sources included the U.S. Department of Commerce Bureau of Industry and Security (BIS), European Semiconductor Industry Association (ESIA), Semiconductor Industry Association (SIA), SEMI (Semiconductor Equipment and Materials International), Japan Electronics and Information Technology Industries Association (JEITA), Korea Semiconductor Industry Association (KSIA), Taiwan Semiconductor Industry Association (TSIA), China Semiconductor Industry Association (CSIA), U.S. Environmental Protection Agency (EPA) Toxic Substances Control Act (TSCA) database, European Chemicals Agency (ECHA) REACH registrations, National Institute of Standards and Technology (NIST), International Technology Roadmap for Semiconductors (ITRS), IEEE Xplore Digital Library, ACS Applied Materials & Interfaces, Journal of Photopolymer Science and Technology, SPIE Advanced Lithography proceedings, World Semiconductor Trade Statistics (WSTS), IC Insights, Gartner Dataquest, and national trade statistics from customs administrations in key manufacturing markets.

Wafer fab capacity data, lithography technology transitions, chemical import/export statistics, regulatory compliance frameworks, and patent landscapes for ArF immersion, ArF dry, KrF, G-line/I-line photoresist formulations, and ancillary chemicals like anti-reflective coatings, developers, and removers were gathered from these sources.

ย 

Primary Research

In order to gather both qualitative and quantitative insights, supply-side and demand-side stakeholders were interviewed during the primary research process. CEOs, VPs of Technology Development, CTOs of Electronic Materials divisions, directors of process engineering, and supply chain leaders from photoresist producers, chemical suppliers, and OEM partners were examples of supply-side sources. VP-level lithography engineers, process integration managers, procurement directors from IDMs (Integrated Device makers), foundry operators, and memory makers, including DRAM and NAND factories, were examples of demand-side sources. Technology roadmaps, EUV transition schedules, and information on chemical purity standards, supply chain localization tactics, and the effects of dual-use export control were all corroborated by primary research.

Primary Respondent Breakdown:

By Designation: C-level Primaries (28%), Director Level (33%), Others (39%)

By Region: North America (28%), Europe (24%), Asia-Pacific (40%), Rest of World (8%)

ย 

Market Size Estimation

Lithography layer processing models and wafer input analysis were used to determine the global market valuation. The methodology comprised:

Finding more than 35 major producers of photoresist formulators and related products in Japan, South Korea, Taiwan, the US, and Europe

Product mapping for G-line/I-line photoresist, KrF, ArF immersion, ArF dry film, anti-reflective coatings, developers, and removers

Examination of annual sales for photoresist and lithography chemical portfolios, both reported and modeled

coverage of producers accounting for 75โ€“80% of the world market in 2024

Extrapolating segment-specific valuations by application (semiconductor & IC, LCD/display) and resist chemical type utilizing top-down (manufacturer revenue validation) and bottom-up (wafer starts ร— photoresist consumption per lithography layer ร— ASP per technology node) methods

Key differences from your dermal filler template:

Replaced medical regulatory bodies with semiconductor/chemical regulatory agencies (EPA, ECHA, BIS)

Changed revenue tiers to reflect semiconductor materials industry structure (lower thresholds than pharma)

Adjusted regional weights to reflect Asia-Pacific dominance in semiconductor manufacturing (40% vs 30%)

Modified methodology from "procedure volume" to "wafer input" and "lithography layers" for semiconductor-specific metrics

Download Free Sample

Kindly complete the form below to receive a free sample of this Report

Download PDF ×

We do not share your information with anyone. However, we may send you emails based on your report interest from time to time. You may contact us at any time to opt-out.
















