Plastic Waste Pyrolysis Oil Market (2026 - 2035)

Plastic Waste Pyrolysis Oil Market Research Report Information By Raw Material (Waste Plastics, Waste Tires, Biomass, and Others), By Application (Fuels and Chemicals) – Forecast Till 2035
ID: MRFR/CnM/30683-HCR
111 Pages
Chitranshi Jaiswal
Last Updated: July 28, 2026
Plastic Waste Pyrolysis Oil Market
Market Size
Forecast Period2026-2035
CAGR (2026-2035)14.8%
2025 Market SizeUSD 1.60 Billion
2035 Market SizeUSD 6.37 Billion
Key Players
Plastic Energy
Brightmark
Agilyx
Quantafuel
New Hope Energy
Nexus Circular
Opportunities
  • Chemical-Grade Naphtha Substitution
  • Carbon Credit Monetization and New Revenue Models
  • Emerging Market Expansion in India and ASEAN

Plastic Waste Pyrolysis Oil Market Summary

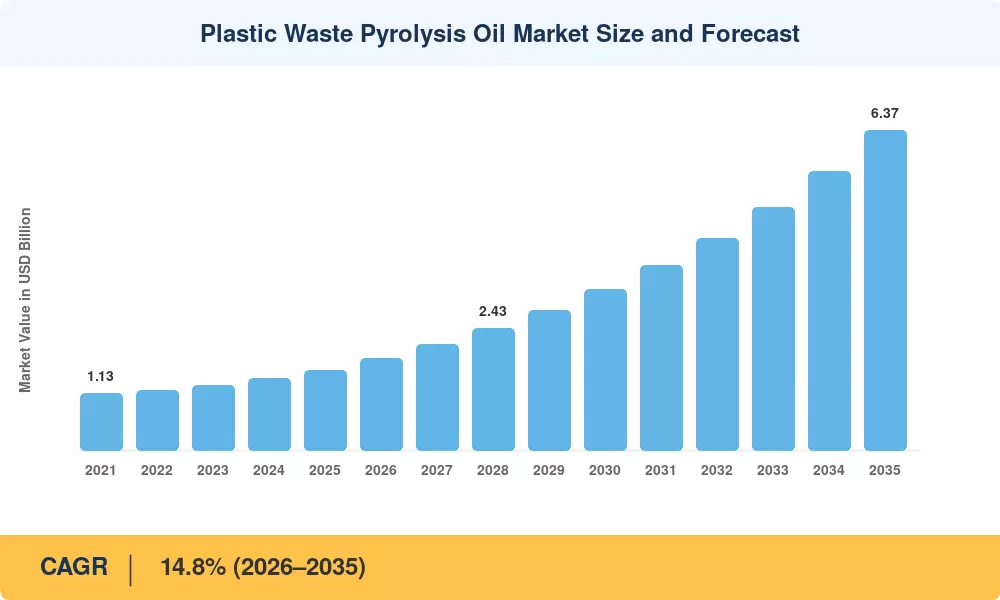
The plastic waste pyrolysis oil market stood at USD 1.60 billion in 2025 and is projected to reach USD 1.84 billion in 2026 before climbing to USD 6.37 billion by 2035, registering a CAGR of 14.8% across the forecast window. This acceleration traces directly to tightening Extended Producer Responsibility (EPR) mandates across the EU and OECD nations, combined with refinery co-processing approvals that allow pyrolysis oil to displace virgin naphtha in steam crackers [2]. The plastic waste pyrolysis oil market has attracted over USD 4.2 billion in announced project-level investment since 2022, a figure that underscores both the scale of unmet plastic-recycling demand and the improving unit economics of thermal depolymerization [3].

A technology shift is underway. Conventional rotary-kiln pyrolysis units — capital-heavy, batch-oriented, and limited to 40–50% liquid yields — are giving way to continuous-feed fluidized-bed and microwave-assisted reactors capable of 65–70% oil yields with lower energy inputs [4]. Europe's Innovation Fund committed EUR 1.8 billion to advanced recycling projects in its 2024 call, while Japan's NEDO program allocated ¥32 billion to pilot next-generation catalytic routes [5]. These investments are reshaping the competitive landscape of the plastic waste pyrolysis oil market by lowering the cost gap with mechanical recycling.

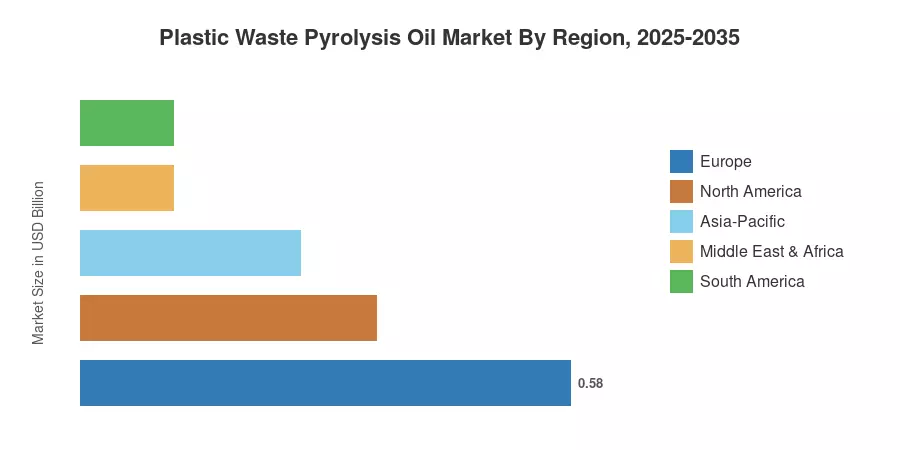
Europe dominates the plastic waste pyrolysis oil market with an estimated 36.2% revenue share in 2025, backed by the EU Packaging and Packaging Waste Regulation and mandatory recycled-content targets for food-contact polymers. Asia-Pacific is the fastest-growing region at a 16.3% CAGR, fueled by rapid capacity build-outs in China and India [6]. North America holds the second-largest position, driven by state-level chemical recycling legislation in over 20 U.S. states. By 2035, the plastic waste pyrolysis oil market will reflect a more geographically balanced supply base as emerging economies scale collection and conversion infrastructure.


Key Report Takeaways

• By Raw Material

  • Waste plastics commanded a 63.0% share of the plastic waste pyrolysis oil market in 2025, driven by EPR-linked collection mandates and refinery offtake agreements.
  • Waste tires are expanding at a 15.4% CAGR through 2035, supported by tire-derived fuel standards and landfill diversion policies.
  • Biomass-based pyrolysis oil is valued at USD 0.16 billion in 2025, serving niche biorefinery applications.

• By Application

  • Fuels accounted for 87.3% of the plastic waste pyrolysis oil market size in 2025, reflecting demand for low-sulfur marine fuel and refinery co-processing feedstock.
  • Chemicals are growing at a 16.8% CAGR as petrochemical producers pursue recycled-content naphtha for polymer production.

• By Region

  • Europe led the plastic waste pyrolysis oil market at 36.2% revenue share in 2025.
  • Asia-Pacific is forecast to grow at the fastest CAGR of 16.3% through 2035.
  • North America contributed USD 0.35 billion in 2025, anchored by U.S. state-level advanced recycling statutes.


Plastic Waste Pyrolysis Oil Market Size and Forecast (2021–2035)

Market Research Future employs a triangulated methodology combining bottom-up plant-capacity modeling, top-down trade-flow analysis, and primary interviews with technology licensors, off-takers, and regulatory agencies. Historical values (2021–2024) reflect audited industry data; the base year (2025) is estimated from confirmed project pipelines and feedstock availability indices. Forecast values (2026–2035) apply scenario-weighted CAGR modeling calibrated to policy implementation timelines and capital deployment schedules across the plastic waste pyrolysis oil market.
Plastic Waste Pyrolysis Oil Market Size and Forecast
Our Impact
Enabled $4.3B Revenue Impact for Fortune 500 and Leading Multinationals
Partnering with 2000+ Global Organizations Each Year
30K+ Citations by Top-Tier Firms in the Industry

Driver Impact Analysis

Driver ~% Impact on CAGR Geographic Relevance Impact Timeline
EPR and recycled-content mandates 18–22% EU, UK, Japan Short-term (≤2 yr)
Refinery co-processing approvals 15–18% Europe, North America Medium-term (2–4 yr)
Carbon credit and ETS incentives 12–15% EU, South Korea, California Medium-term (2–4 yr)
Public innovation funding (EU Innovation Fund, NEDO) 10–14% Europe, Japan Short-term (≤2 yr)
Petrochemical recycled-content demand 8–12% Global Long-term (≥4 yr)
Single-use plastics bans boosting collection 6–10% India, ASEAN, Africa Medium-term (2–4 yr)
ISCC PLUS and mass-balance certification adoption 5–8% Global Long-term (≥4 yr)


EPR and Recycled-Content Mandates

The EU's Packaging and Packaging Waste Regulation requires that plastic packaging contain at least 10% recycled content from post-consumer waste by 2030, rising to 35% by 2040 [2]. This regulatory architecture directly underpins the plastic waste pyrolysis oil market because chemical recycling is the only commercially proven pathway for food-contact-grade recycled polyolefins. The UK Plastic Packaging Tax already levies GBP 217.85 per tonne on packaging with less than 30% recycled content, creating an immediate cost differential that favors pyrolysis-derived feedstock [3].

Refinery Co-Processing Breakthroughs

Several European refiners — including Preem and Repsol — have secured regulatory clearance to blend up to 5% pyrolysis oil into fluid catalytic cracker feedstock without requiring separate REACH registration [4]. Co-processing slashes the capital requirement for new entrants in the plastic waste pyrolysis oil market by eliminating the need for dedicated upgrading units. The U.S. EPA's proposed rule on co-processing advanced recycling outputs could unlock an additional 120,000 tonnes per year of demand by 2028 [10].

Carbon Credit and Emissions Trading Schemes

When replacing virgin naphtha, pyrolysis oil derived from waste plastics can generate up to 2.3 tonnes of CO₂-equivalent credits per tonne of output under the EU ETS [9]. These credits increase revenue by USD 90–130 per tonne, significantly reducing the payback period for facilities that serve the plastic waste pyrolysis oil market, with EU Allowance prices averaging EUR 68 per tonne in 2024 [9].


Public Innovation Funding

Europe's Innovation Fund awarded EUR 1.8 billion to large-scale advanced recycling projects in 2024 alone, reducing developer equity requirements by 25–35% [5]. Japan's NEDO program supports microwave-assisted pyrolysis demonstrations with ¥32 billion in grants through 2027 [5]. These subsidies de-risk capital deployment and accelerate the plastic waste pyrolysis oil market's transition from pilot to industrial scale.


Restraints Impact Analysis

Restraint impact percentages reflect estimated downward pressure on growth rates. They represent independent risk vectors, not additive offsets to the CAGR.

Restraint ~% Impact on CAGR Geographic Relevance Impact Timeline
PAH contamination and product-specification barriers –(20–25%) Global Short-term
High capital expenditure (USD 35–60M per 20 kt plant) –(15–18%) Emerging markets Medium-term
Feedstock quality variability –(10–14%) Asia-Pacific, MEA Long-term
Competition from mechanical recycling –(8–12%) Europe, North America Medium-term
Crude oil price volatility –(5–10%) Global Long-term


PAH Contamination Challenges

Polycyclic aromatic hydrocarbons remain the most acute technical hurdle for the plastic waste pyrolysis oil market. Specification-driven customers — particularly naphtha crackers — impose PAH limits below 50 ppm, yet mixed-plastic pyrolysis oil routinely tests above 200 ppm without dedicated hydrotreatment [11]. Adding downstream purification raises operating costs by USD 40–80 per tonne, eroding the margin advantage over virgin feedstock and slowing commercial qualification timelines.

High Capital Intensity

A commercial-scale pyrolysis plant processing 20,000 tonnes of plastic waste per year typically requires USD 35–60 million in total installed capital [12]. For developers in emerging markets with limited access to project finance, this intensity constrains the plastic waste pyrolysis oil market to regions with strong public co-funding mechanisms. Modular plant designs are beginning to lower the entry threshold, but financing remains a gating factor in South America and parts of Africa.

Feedstock Quality Variability

Mixed post-consumer plastic waste varies widely in composition, moisture content, and contamination levels. Plants fed with inconsistent waste streams experience yield fluctuations of 10–20%, undermining production planning and offtake contract compliance [6]. Standardized feedstock pre-processing protocols are still evolving in the plastic waste pyrolysis oil market, particularly in regions without mature waste-sorting infrastructure.


Plastic Waste Pyrolysis Oil Market Opportunities

Chemical-Grade Naphtha Substitution

Petrochemical producers face binding recycled-content targets that mechanical recycling alone cannot satisfy for food-contact packaging. Upgrading pyrolysis oil to chemical-grade naphtha through hydrotreatment and distillation opens a USD 2+ billion addressable market segment by 2030. Producers in the plastic waste pyrolysis oil market that secure direct refinery integration will capture premium pricing of 15–25% over fuel-grade oil.

Carbon Credit Monetization and New Revenue Models

Plants certified under ISCC PLUS or equivalent schemes can stack recycled-content certificates with carbon credits, creating dual revenue streams. This layered monetization model improves project IRRs by 3–5 percentage points and enables pay-as-you-go financing structures [9]. The plastic waste pyrolysis oil market stands to benefit from emerging voluntary carbon markets in Southeast Asia and Latin America, where credit issuance frameworks are maturing rapidly.

Emerging Market Expansion in India and ASEAN

India produces more than 3.5 million tonnes of plastic waste annually; however, recycling rates are less than 30% [6]. An additional 8 million tonnes are produced by the ASEAN nations collectively. The plastic waste pyrolysis oil market in these regions is presented with a greenfield opportunity as a result of the combination of new foreign-investment incentives, increasing EPR enforcement, and low-cost feedstock. Decentralized modular facilities with an annual capacity of 5,000 tonnes are particularly well-suited for fragmented waste-collection ecosystems.


Marine Fuel Blending Under IMO 2030 Targets

Pull-demand for low-sulfur pyrolysis-derived marine fuel is generated by the International Maritime Organization's increasingly stringent sulfur and greenhouse-gas intensity targets [17]. The ports of Rotterdam, Singapore, and Fujairah are currently conducting pilot projects to test blended bunker fuel that contains up to 20% pyrolysis oil. In this niche, the plastic waste pyrolysis oil market has the potential to achieve a premium price of USD 80–120 per tonne in comparison to conventional heavy fuel oil.


AI-Driven Process Optimization

Machine-learning models applied to reactor temperature control, feedstock characterization, and catalyst management can increase liquid yields by 5–8% while reducing energy consumption [18]. Data-driven process twins are already deployed at pilot facilities in Europe, and their commercial rollout will lower per-unit production costs across the plastic waste pyrolysis oil market.


Plastic Waste Pyrolysis Oil Market Future Outlook

Digitalization and Autonomous Plant Operations

In order to autonomously optimize yield profiles, commercial pyrolysis plants will implement real-time spectroscopic feedstock analysis and AI-driven reactor control by 2030 [18]. The plastic waste pyrolysis oil market's competitiveness against virgin petrochemical routes could be enhanced by the IEA's projection that digital process optimization across chemical recycling facilities could reduce operational costs by 12–18%. Plants that invest in digital doubles at the outset will acquire a sustainable cost advantage as the industry expands.


Vertical Integration with Petrochemical Value Chains

The next decade will see the plastic waste pyrolysis oil market consolidate around vertically integrated producer-refiner partnerships. BASF, SABIC, and LyondellBasell have each announced dedicated cracker capacity reserved for chemically recycled feedstock, locking in long-term offtake contracts that de-risk project financing [14]. This structural shift will marginalize stand-alone producers lacking downstream relationships.

Regulatory Convergence and Global Standards

Divergent national definitions of chemical recycling currently fragment the plastic waste pyrolysis oil market. The OECD's ongoing harmonization effort, expected to yield model legislation by 2028, will reduce cross-border trade barriers and enable mass-balance certification interoperability [15]. Global standards will lower compliance costs for multinational producers by an estimated 8–12%.

Decarbonization Mandates and ESG Integration

Corporate net-zero pledges and Scope 3 reporting requirements will drive FMCG and packaging companies to source verified recycled-content polymers, directly expanding the plastic waste pyrolysis oil market's addressable demand base [17]. The Science Based Targets initiative already recognizes chemically recycled inputs in Scope 3 accounting, and forthcoming ISSB disclosure rules will amplify procurement pressure through 2035.


Plastic Waste Pyrolysis Oil Market Segmentation

By Raw Material

Segment Key Metric Primary Demand Driver
Waste Plastics 63.0% market share (2025) EPR mandates and refinery co-processing demand
Waste Tires 15.4% CAGR (2026–2035) Tire-derived fuel standards and landfill bans
Biomass USD 0.16 Billion (2025) Bio-refinery integration and renewable fuel credits
Others 5.0% market share (2025) Niche industrial and agricultural waste processing


Waste plastics anchor the plastic waste pyrolysis oil market, reflecting the convergence of high feedstock availability (over 350 million tonnes of plastic produced globally in 2024) and binding recycled-content regulations. Mixed polyolefin streams — particularly PE and PP from post-consumer packaging — constitute the primary feedstock, though PET and PS streams are gaining traction as sorting technologies improve.

Waste tires represent the second-fastest segment in the plastic waste pyrolysis oil market. An estimated 1.5 billion end-of-life tires are generated annually worldwide, and landfill bans in the EU and over 30 U.S. states channel this waste toward thermal recovery [16]. Tire-derived pyrolysis oil yields tend to be more consistent than mixed-plastic streams, offering operational advantages that appeal to fuel-market buyers.

By Application

Segment Key Metric Primary Demand Driver
Fuels 87.3% market share (2025) Marine fuel blending, industrial heating, and refinery co-feed
Chemicals 16.8% CAGR (2026–2035) Recycled-content naphtha for polymer production


The fuels segment commands the largest share of the plastic waste pyrolysis oil market because fuel-grade oil requires minimal upgrading compared to chemical-grade specifications. Refinery co-processing and marine bunker blending together account for the majority of current offtake. The chemicals segment is growing faster as petrochemical producers pursue recycled-content naphtha to meet packaging-regulation targets, though achieving the required purity levels demands additional hydrotreatment investment.


Regional Market Share Analysis

Region Key Metric Primary Investment Themes
North America USD 0.35 Billion (2025) State-level advanced recycling laws; refinery co-processing pilots
Europe 36.2% revenue share (2025) PPWR recycled-content mandates; Innovation Fund grants
Asia-Pacific 16.3% CAGR (2026–2035) Rapid capacity build-out in China and India
South America 7.0% revenue share (2025) Brazilian EPR framework; low-cost feedstock access
Middle East & Africa USD 0.11 Billion (2025) Petrochemical diversification; port-proximity advantages
Total USD 1.60 Billion (2025)

The plastic waste pyrolysis oil market exhibits distinct regional dynamics shaped by regulatory maturity, feedstock availability, and downstream integration pathways.


North America

Country Key Metric Key Driver
US 78.5% of regional share 24 states with advanced recycling legislation [10]
Canada 12.3% CAGR Federal plastic-pollution prevention framework [15]
Mexico USD 0.01 Billion (2025) Nascent waste-collection formalization


The United States anchors North America's position in the plastic waste pyrolysis oil market through a patchwork of state-level statutes that classify pyrolysis as manufacturing rather than waste disposal, accelerating permitting timelines. Texas and Ohio host the largest announced facilities, each exceeding 30,000 tonnes per year of mixed-plastic intake capacity [10].

Europe

Country Key Metric Key Driver
Germany 22.4% of regional share Strong DSD collection system and BASF ChemCycling program [2]
UK 15.8% CAGR Plastic Packaging Tax incentivizing recycled content [3]
France USD 0.07 Billion (2025) AGEC Law mandating recycling quotas
Italy 14.2% CAGR Circular economy decree and Versalis investments
Spain USD 0.04 Billion (2025) REP legislation and petrochemical hub proximity
Nordic Countries 16.1% CAGR Ambitious 2030 recycling targets and Innovation Fund projects
Russia USD 0.02 Billion (2025) Emerging waste management reforms
Rest of Europe 11.8% of regional share EU harmonization of PPWR standards


Europe's leadership in the plastic waste pyrolysis oil market reflects two decades of policy layering — from the Waste Framework Directive to the 2025 PPWR enforcement timeline. Germany's dual-system collection infrastructure provides reliable, pre-sorted feedstock, while the Netherlands' port-refinery corridor offers co-processing scale. BASF's ChemCycling program alone committed EUR 500 million to integrated pyrolysis-to-polymer value chains [2].

Asia-Pacific

Country Key Metric Key Driver
China 31.5% of regional share National Sword policy redirecting waste domestically [6]
India 18.4% CAGR EPR framework under Plastic Waste Management Rules [6]
Japan USD 0.08 Billion (2025) NEDO grants and ENEOS refinery integration [5]
South Korea 15.9% CAGR K-ETS carbon credit incentives
ASEAN USD 0.05 Billion (2025) Foreign investment in modular capacity
Rest of Asia-Pacific 14.1% CAGR Policy harmonization across smaller economies


Asia-Pacific's rapid expansion in the plastic waste pyrolysis oil market is anchored by China's post-National Sword pivot to domestic advanced recycling and India's tightening EPR obligations, which now cover over 10,000 brand owners [6]. Japan's ENEOS and Idemitsu refineries have committed to integrating pyrolysis oil into cracker feedstock, creating guaranteed offtake corridors.

South America

Country Key Metric Key Driver
Brazil 68.2% of regional share National Solid Waste Policy and low feedstock cost
Argentina 14.6% CAGR Petrochemical sector seeking alternative feedstocks
Rest of South America USD 0.02 Billion (2025) Early-stage regulatory development


Brazil dominates the South American plastic waste pyrolysis oil market, leveraging its large petrochemical base and a National Solid Waste Policy that incentivizes advanced recycling through tax credits. The country's cooperativa-based collection system provides low-cost mixed-plastic feedstock, though quality standardization remains an ongoing challenge.

Middle East & Africa

Country Key Metric Key Driver
Saudi Arabia 28.3% of regional share SABIC and Aramco circular economy programs
UAE 17.2% CAGR Petrochemical diversification from Jebel Ali hub
South Africa USD 0.02 Billion (2025) Extended producer responsibility legislation
Egypt 13.8% CAGR Waste-to-value infrastructure grants from IFC
Rest of MEA 22.7% of regional share Early-stage project development


The MEA region's position in the plastic waste pyrolysis oil market centers on petrochemical giants exploring circular-economy portfolios. SABIC's TRUCIRCLE initiative and Aramco's investment in Plastic Energy's Netherlands facility signal strategic intent to secure recycled feedstock pipelines [14].


Plastic Waste Pyrolysis Oil Market By Region, 2025-2035

Competitive Benchmarking

The plastic waste pyrolysis oil market exhibits medium concentration, with the top five players holding an estimated 32–38% combined revenue share in 2025. The Herfindahl-Hirschman Index (HHI) falls in the 800–1,200 range, characteristic of a market transitioning from fragmented pilot-stage ventures toward consolidated industrial operations. Competition centers on technology licensing, feedstock sourcing agreements, and downstream offtake partnerships rather than price alone.

Company Est. Revenue Share Range Key Offerings Strategic Positioning
Plastic Energy ~7–10% Patented TAC process for mixed plastics Pioneer in food-grade recycled oil; SABIC and ExxonMobil partnerships
Brightmark ~5–8% Large-scale U.S. pyrolysis plants Vertically integrated feedstock-to-fuel model
Agilyx  ~4–7% Polystyrene-focused pyrolysis; feedstock consortium Differentiated single-polymer approach
Quantafuel ~3–6% Continuous catalytic pyrolysis Scandinavian hub with BASF offtake
New Hope Energy ~3–5% High-capacity Texas facility Scale-focused strategy targeting refinery co-feed
Nexus Circular ~2–5% Distributed small-scale plants Franchise-style modular deployment model
Klean Industries ~2–4% Tire and plastic pyrolysis systems Technology licensor across Asia-Pacific
Alterra Energy ~2–4% Patented polymer-to-fuel technology Neste partnership for renewable diesel blending
Pyrowave ~1–3% Microwave-assisted depolymerization Polystyrene-to-styrene monomer recovery
Encina Development Group ~1–3% Aromatics-focused circular chemistry BTX production from mixed plastics


Recent News & Developments


  • Brightmark (January 2025): Secured USD 680 million in project finance for its Ashley, Indiana mega-facility, representing the largest single-site investment in North American advanced recycling [10].


  • Agilyx (June 2024): Completed commercial commissioning of its Tigard, Oregon polystyrene depolymerization unit, achieving 90% styrene monomer recovery at steady-state operations.
  • ENEOS Holdings (April 2024): Announced co-processing trial integrating 3,000 tonnes of pyrolysis oil annually into its Negishi refinery FCC unit in Yokohama, Japan [5].


  • Encina Development Group (December 2023): Closed a USD 1.1 billion financing package for its Point Comfort, Texas facility designed to convert 450,000 tonnes of mixed plastics into BTX aromatics annually.


Plastic Waste Pyrolysis Oil Market Report Scope

Parameter Detail
Market Scope Global plastic waste pyrolysis oil market across raw materials, applications, and geography
Study Period 2021–2035
CAGR (Forecast Period) 14.8% (2026–2035)
Base Year Market Size USD 1.60 Billion (2025)
Forecast Endpoint USD 6.37 Billion (2035)
Fastest Growing Segment Chemicals (by application); Waste Tires (by raw material)
Companies Profiled 10 major players including Plastic Energy, Brightmark, Agilyx, Quantafuel, and others
Valuation Currency USD Billion


FAQs

What minimum feedstock throughput makes a pyrolysis plant economically viable?
Most project finance models require a minimum input of 15,000–20,000 tonnes per year of pre-sorted plastic waste to achieve break-even within five years [12]. Plants below this threshold face disproportionately high fixed-cost burdens.
How does pyrolysis oil quality compare to virgin naphtha for cracker feed?
Untreated pyrolysis oil contains elevated nitrogen, chlorine, and PAH levels that require hydrotreatment before cracker acceptance [11]. After upgrading, it performs comparably to virgin naphtha in ethylene yield tests.
What certification does a producer need to sell pyrolysis oil into EU markets?
ISCC PLUS certification under a mass-balance chain-of-custody model is the de facto requirement for EU market access [8]. Producers must also comply with REACH registration for new chemical substances.
How do offtake agreements typically structure pricing in this industry?
Contracts generally use a floor price linked to Brent crude plus a green premium of USD 80–150 per tonne [7]. Contract durations range from three to ten years with annual volume escalation clauses.
What distinguishes catalytic pyrolysis from thermal pyrolysis for plastic waste?
Catalytic routes use zeolite or metal-oxide catalysts to lower reaction temperatures by 50–80°C, improving liquid yield and reducing wax formation [4]. Capital costs run 15–20% higher than thermal systems.
Can pyrolysis oil qualify for renewable fuel credits under U.S. RFS2?
The EPA has not yet finalized a pathway determination for plastic-derived pyrolysis oil under the Renewable Fuel Standard [10]. Cellulosic waiver credits remain unavailable until a formal ruling is issued.
What role does feedstock pre-processing play in plant economics?
Sorting, shredding, and drying account for 20–30% of total operating costs but directly determine oil yield and quality consistency [12]. Investing in automated near-infrared sorting reduces downstream contamination risk significantly.    
Author
Author
Author Profile
Chitranshi Jaiswal LinkedIn
Team Lead - Research
Chitranshi is a Team Leader in the Chemicals & Materials (CnM) and Energy & Power (EnP) domains, with 6+ years of experience in market research. She leads and mentors teams to deliver cross-domain projects that equip clients with actionable insights and growth strategies. She is skilled in market estimation, forecasting, competitive benchmarking, and both primary & secondary research, enabling her to turn complex data into decision-ready insights. An engineer and MBA professional, she combines technical expertise with strategic acumen to solve dynamic market challenges. Chitranshi has successfully managed projects that support market entry, investment planning, and competitive positioning, while building strong client relationships. Certified in Advanced Excel & Power BI she leverages data-driven approaches to ensure accuracy, clarity, and impactful outcomes.

Research Approach


Secondary Research

The secondary research process involved comprehensive analysis of environmental regulatory databases, peer-reviewed engineering journals, sustainability publications, and authoritative energy & waste management organizations. Key sources included the US Environmental Protection Agency (EPA), European Environment Agency (EEA), International Energy Agency (IEA), US Department of Energy (DOE) / National Renewable Energy Laboratory (NREL), European Commission Circular Economy Action Plan, World Bank Energy & Extractives Global Practice, UN Environment Programme (UNEP), International Solid Waste Association (ISWA), American Chemistry Council (ACC) Plastics Division, PlasticsEurope, Eurostat Waste Statistics, OECD Environment Statistics, BP Statistical Review of World Energy, IEA Bioenergy Task 36 (Waste to Energy), China National Development and Reform Commission (NDRC), India Central Pollution Control Board (CPCB), and national environmental ministry reports from key markets. These sources were used to collect plastic waste generation statistics, pyrolysis technology regulatory frameworks, chemical recycling capacity data, circular economy policy developments, and market landscape analysis for plastic waste pyrolysis oil, synthetic crude oil, and renewable fuel applications.


Primary Research

Qualitative and quantitative insights were obtained by interviewing supply-side and demand-side stakeholders during the primary research process. CEOs, VPs of Technology & Innovation, regulatory compliance chiefs, and commercial directors from pyrolysis oil producers, plastic waste recyclers, and chemical recycling technology providers comprised the supply-side sources. Chief sustainability officers, procurement directors from petrochemical refineries, fuel blenders, waste management operators, and regulatory affairs managers from circular economy platforms constituted demand-side sources. Market segmentation was validated, pyrolysis plant commissioning timelines were confirmed, and insights regarding technology adoption patterns, offtake agreement structures, and regulatory incentive dynamics were obtained through primary research.

Primary Respondent Breakdown:

By Designation: C-level Primaries (28%), Director Level (32%), Others (40%)

By Region: North America (28%), Europe (42%), Asia-Pacific (22%), Rest of World (8%)


Market Size Estimation

Global market valuation was derived through production capacity mapping and offtake volume analysis. The methodology included:

Identification of 55+ key pyrolysis oil producers and technology licensors across North America, Europe, Asia-Pacific, and Middle East & Africa

Product mapping across plastic waste pyrolysis oil, synthetic crude, naphtha substitutes, and marine fuel blends

Analysis of reported and modeled annual production volumes specific to pyrolysis oil portfolios

Coverage of producers representing 65-70% of global installed pyrolysis capacity in 2024

Extrapolation using bottom-up (plant capacity utilization × ASP by region) and top-down (producer revenue validation) approaches to derive segment-specific valuations

Key Adjustments Made:

Government/Regulatory Sources: Shifted from FDA/health agencies to EPA/EEA/energy departments focused on waste management and circular economy

Industry Associations: Replaced medical societies with chemistry councils, waste associations, and energy agencies

Primary Respondent Breakdown: Modified percentages across all three categories (Company Tier, Designation, Region) to reflect the more fragmented, regionally diverse nature of the recycling/waste sector

Tier Definitions: Adjusted revenue thresholds downward given the emerging nature of chemical recycling sector vs. established pharma/medical device companies

Download Free Sample

Kindly complete the form below to receive a free sample of this Report

Download PDF ×

We do not share your information with anyone. However, we may send you emails based on your report interest from time to time. You may contact us at any time to opt-out.














