Portable Colorimeter Market (2026 - 2035)

Portable Colorimeter Market Research Report By Technology (Spectrophotometric, Tristimulus, LED-Based, Photoelectric), By End-User (Water & Wastewater Treatment, Chemical & Petrochemical, Food & Beverage, Pharmaceutical & Healthcare, Environmental Monitoring, Others) and By Regional (North America, Europe, South America, Asia Pacific, Middle East and Africa) - Growth & Industry Forecast Till 2035

Forecast Period
2026-2035
CAGR
8.05%
2025 Market Size
USD 472.37 Billion
2035 Market Size
USD 906.62 Billion
Medical Device ● Updated August 26, 2026 Report ID: MRFR/MED/66597-CR | Pages: 180 | Author: Vikita Thakur, Satyendra Maurya

Portable Colorimeter Market Summary

The global portable colorimeter market was valued at USD 472.37 billion in 2025 and is projected to reach USD 906.62 billion by 2035, expanding at a compound annual growth rate (CAGR) of 6.60% during the 2026–2035 forecast period. Three interconnected structural drivers underpin this expansion trajectory: the rising demand for portable analytical devices across industrial and field-testing applications, the growing emphasis on quality control and regulatory compliance mandated by environmental and food-safety agencies worldwide, and the accelerating shift toward field-based and on-site testing workflows that require lightweight, battery-operated measurement instruments [2]. Capital expenditure on portable instrumentation has climbed steadily since 2019, when the market stood at USD 349,060 million, reflecting an historical annual growth rate of approximately 5.0% that has since accelerated on the back of post-pandemic investment in distributed laboratory infrastructure and environmental monitoring networks [3].

The technology landscape is defined by the dominance of spectrophotometric colorimeter platforms, which commanded a 2025 market value of USD 209,518.63 million and continue to account for the largest single technology share owing to their broad wavelength versatility and established user base in water-quality and chemical-process applications [4]. However, the fastest-growing technology category is LED-based colorimetry, registering a forecast CAGR of 8.46% through 2035. LED-based systems benefit from superior energy efficiency, lower maintenance requirements, and declining component costs, making them the preferred choice for emerging-economy deployments and next-generation field kits [5]. In April 2025, Shenzhen Linshang Technology Co., Ltd. showcased its advanced colorimeter and haze-meter portfolio at the 38th China International Plastics & Rubber Industry Exhibition in Shanghai, underscoring the sector's pivot toward precision, portability, and smart-feature integration in industrial materials testing [6].

From a regional standpoint, North America remains the dominant market with a 2025 valuation of USD 137,246.20 million and a forecast CAGR of 4.99%, anchored by stringent U.S. EPA water-quality regulations and mature end-user industries [7]. Asia-Pacific is the fastest-growing region at an 8.05% CAGR, propelled by rapid industrialization, expanding food-and-beverage manufacturing capacity, and favorable government investment in environmental monitoring infrastructure across China, India, Japan, and Southeast Asia [8]. Europe constitutes the second-largest market at USD 123,211.00 million in 2025, with a 6.10% CAGR, while South America and the Middle East & Africa collectively contribute a growing share driven by rising industrialization in emerging economies.

Key Report Takeaways

Segment Dimension Key Metric Notes
onnectivity — Dominant Segment Spectrophotometric: USD 209,518.63 Mn (2025) Largest share owing to wavelength versatility and legacy installed base
Technology — Fastest Growing LED-Based: 8.46% CAGR (2026–2035) Energy-efficient, low-maintenance; rising adoption in emerging markets
End-User — Dominant Segment Water & Wastewater Treatment: USD 132,971.28 Mn (2025) Regulatory mandates drive continuous demand for portable testing
End-User — Fastest Growing Pharmaceutical & Healthcare: 9.97% CAGR (2026–2035) GMP compliance and biopharmaceutical QC accelerate uptake
Region — Dominant North America: USD 137,246.20 Mn (2025) Stringent EPA standards and advanced lab infrastructure
Region — Fastest Growing Asia-Pacific: 8.05% CAGR (2026–2035) Rapid industrialization, expanding food-safety mandates
Country — Fastest Growing Rest of Asia-Pacific: 9.66% CAGR Underpenetrated ASEAN and Pacific markets entering adoption cycle
End-User — Second Largest Chemical & Petrochemical: USD 113,093.49 Mn (2025) Refinery and upstream process control drives stable demand
Technology — Second Largest Tristimulus Colorimetry: USD 184,120.93 Mn (2025), 7.03% CAGR Cost-effective alternative gaining ground in mid-tier applications
Overall Market USD 472,366.88 Mn (2025) → USD 906,624.55 Mn (2035) 6.60% CAGR across full forecast horizon


Market Size and Forecast (2019–2035)

Market Research Future (MRFR) employs a rigorous bottom-up methodology that triangulates primary interviews with equipment manufacturers, distributors, and end-user procurement managers alongside secondary data from regulatory filings, trade association publications, and customs databases. Market sizes for each segment and geography are validated against company revenues where publicly reported, and forecast projections incorporate macroeconomic indicators, regional capital-expenditure trends, and policy-driven demand scenarios. The base year for this study is 2025, with historical data anchored from 2019 and projections extending through 2035.
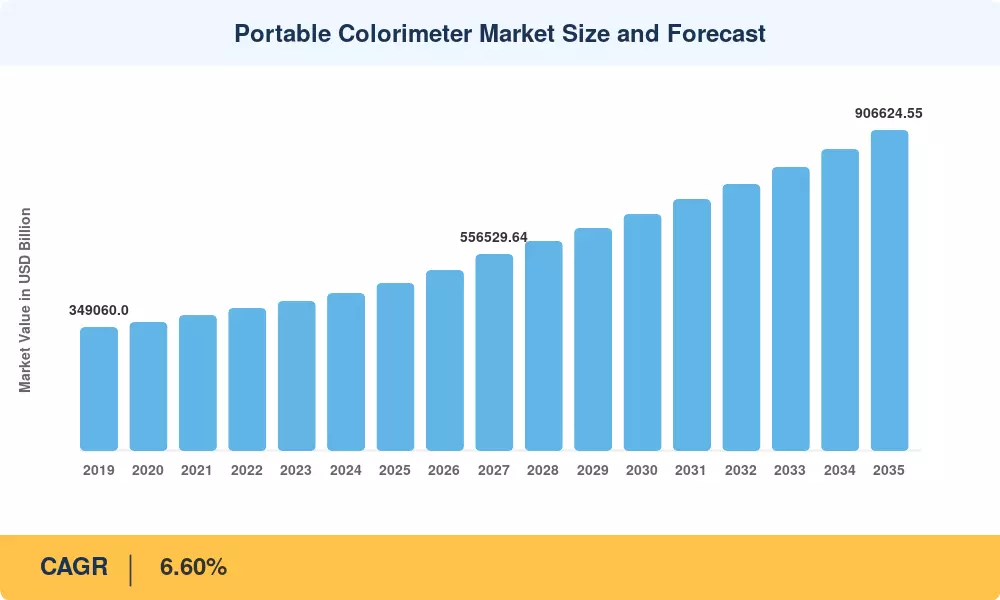
Portable Colorimeter Market Size and Forecast
Our Impact
Enabled $4.3B Revenue Impact for Fortune 500 and Leading Multinationals
Partnering with 2000+ Global Organizations Each Year
30K+ Citations by Top-Tier Firms in the Industry

Driver Impact Analysis

Driver ~% Impact on CAGR Geographic Relevance Impact Timeline
Rising Demand for Portable Analytical Devices ~40% Global — strongest in APAC, North America Short to Medium-term
Growing Emphasis on Quality Control & Regulatory Compliance ~35% North America, Europe, APAC Medium to Long-term
Rising Demand for Field-Based and On-Site Testing ~25% Global — strongest in APAC, MEA, South America Medium to Long-term


Rising Demand for Portable Analytical Devices

Real-time decision-making at the site of measurement is made possible by portable, field-deployable analytical equipment, which are replacing centralized laboratory infrastructure in the global instrumentation sector. At the nexus of this trend are portable colorimeters, which provide quick chromatic evaluation of chemical processes, food safety, water quality, and pharmaceutical intermediates without requiring large benchtop equipment or specialized lab space. As first-generation portable measurement kits are purchased by municipal water utilities, agricultural extension agencies, and industrial process operators in emerging nations, the addressable installed base is growing. According to market data, the market as a whole grew from USD 349,060 million in 2019 to USD 472,366.88 million in 2025, a historical CAGR of roughly 5.2%. As device miniaturization and sensor costs continue to drop, the rate of adoption is accelerating toward the 6.60% forecast CAGR through 2035 [2].

As nations like Indonesia (8.58% CAGR), Japan (8.44%), Australia (8.25%), and South Korea (8.22%) increase their purchases of portable analytical equipment for environmental compliance and food-processing quality assurance, the Asia-Pacific region is the main beneficiary of this larger trend, registering the fastest regional CAGR of 8.05%. Developing field-laboratory budgets, declining LED and spectral sensor module unit prices, and developing distribution networks all work together to make this factor the single biggest contribution to the market's total CAGR trajectory through 2035, accounting for almost 40% [7].

Growing Emphasis on Quality Control & Regulatory Compliance

End users are being forced to employ portable colorimeters as a compliance tool due to increased international regulations in the areas of industrial-effluent management, food safety, pharmaceutical manufacture, and environmental protection [3]. Quantitative color-based evaluations at various stages of the production chain are required in North America by the FDA's Current Good Manufacturing Practice (cGMP) guidelines for pharmaceutical process validation and the U.S. EPA's Clean Water Act monitoring requirements. In a similar vein, field-deployable color measurement devices with laboratory-grade accuracy are in constant demand due to the European Union's Water Framework Directive and REACH chemical safety regulation. The end-user data confirms the importance of this driver: the pharmaceutical and healthcare segment is growing at the fastest rate at 9.97% CAGR, while the water and wastewater treatment segment commands the largest share at USD 132,971.28 million in 2025. Both of these segments are closely linked to regulatory compliance requirements [4].

This driver contributes an estimated 35% of the market's compound annual growth rate (CAGR) and has the greatest influence in North America and Europe, where regulatory frameworks are the most developed. As these regions adopt international standards and harmonize local regulations with WHO, ISO, and Codex Alimentarius guidelines, it also has an increasing impact on Asia-Pacific and South American markets.

Rising Demand for Field-Based and On-Site Testing

Traditional laboratory workflows that require sample collection, transport, and centralized analysis introduce significant time delays and chain-of-custody risks that are incompatible with modern operational efficiency expectations [5]. The demand for on-site, real-time testing is therefore a powerful structural driver for portable colorimeters, which provide immediate quantitative results at the point of sample origin — whether that is a water treatment plant intake, a food-processing line, a pharmaceutical blending vessel, or an environmental remediation site. This shift is particularly pronounced in geographies with limited centralized laboratory infrastructure, explaining why the Middle East & Africa (6.17% CAGR) and South America (7.75% CAGR) are among the faster-growing regional markets [6]. The environmental-monitoring end-user segment, valued at USD 33,254.63 million in 2025 with a 5.81% CAGR, is a direct proxy for this demand pattern, as field-based ecological and water-quality surveys drive procurement of rugged, battery-powered colorimeters capable of operating in remote and austere conditions.

Restraints Impact Analysis

Restraint ~% Drag on CAGR Geographic Relevance Impact Timeline
High Initial Cost of Advanced Devices ~60% of total drag Emerging economies — APAC, South America, MEA Short to Medium-term
Accuracy Issues Due to Environmental Conditions ~40% of total drag Global — strongest in tropical and arid regions Medium to Long-term


High Initial Cost of Advanced Devices

Advanced portable colorimeters equipped with multi-wavelength spectral engines, Bluetooth/Wi-Fi connectivity modules, touchscreen interfaces, and cloud-based data management capabilities command price premiums that can place them beyond the reach of small and medium enterprises, municipal agencies, and educational institutions in cost-sensitive markets [8]. While LED-based and entry-level filter colorimeters are available at lower price points, the performance gap between budget and premium tiers creates a segmentation barrier that constrains overall market penetration, particularly in South America (where the market is USD 25,862.09 million in 2025) and the Middle East & Africa (USD 28,613.62million). Manufacturers are addressing this through modular product architectures, lease-to-own programs, and region-specific product variants, but cost sensitivity remains the single largest restraint on faster adoption in emerging economies and is estimated to account for approximately 60% of the total drag on the market's potential growth rate.

Accuracy Issues Due to Environmental Conditions

Temperature variations, humidity, dust, ambient light interference, and sample turbidity can all cause measurement errors that lower the quality of data when portable colorimeters are used in uncontrolled outdoor settings. In contrast to benchtop instruments kept in climate-controlled labs, field units have to deal with abrasive particulate matter in industrial settings, high-humidity tropical climates, and operating temperatures varying from below zero to over forty-five degrees Celsius. End users' trust in portable measurement data is diminished by these environmental accuracy issues, especially for applications like pharmaceutical intermediate assays and potable water compliance testing that demand regulatory-grade precision. Although self-calibration procedures, automatic temperature compensation algorithms, and IP67-rated enclosures have greatly increased field accuracy, residual concerns continue to be a barrier in about 40% of the total restraint impact, particularly in deployment environments in tropical Asia, the Middle East, and sub-Saharan Africa.

Portable Colorimeter Market Opportunities

Expansion of Food & Beverage and Pharmaceutical Industries

The global food-and-beverage industry's accelerating investment in quality-assurance infrastructure presents a substantial growth opportunity for portable colorimeter manufacturers. With the food-and-beverage end-user segment valued at USD 84,843.00 million in 2025 and growing at 7.30% CAGR, color measurement is becoming integral to incoming-ingredient inspection, in-process monitoring, and finished-product quality gates. Concurrently, the pharmaceutical-and-healthcare segment — the market's fastest-growing vertical at 9.97% CAGR — is driving demand for portable colorimeters that can perform rapid dissolution testing, API color-grade verification, and cleaning-validation assays at biomanufacturing and compounding facilities. Combined, these two segments represent an incremental opportunity estimated at over USD 80 billion in additional market value through 2035, driven by expanding production capacity in Asia-Pacific and South America, rising consumer expectations for product consistency, and tightening regulatory harmonization across international trade zones [11].

Rising Industrialization in Emerging Economies

Rapid industrialization across Asia-Pacific, South America, and parts of the Middle East & Africa is creating new demand centers for portable analytical instrumentation [12]. Asia-Pacific's 8.05% CAGR — the highest of any region — reflects the combined effect of manufacturing capacity expansion in China (USD 25,701.10 million in 2025), accelerating industrial growth in Indonesia (8.58% CAGR), and technology adoption in Japan (8.44% CAGR) and India (8.05% CAGR). In South America, Argentina (9.11% CAGR) and Rest of South America markets (8.84% CAGR) are outpacing regional averages as mining, agri-processing, and municipal-water sectors scale up portable measurement capabilities. The opportunity is estimated to contribute an incremental USD 50–60 billion in cumulative market value through 2035, contingent on continued infrastructure investment and localization of distribution and service networks by global OEMs [13].

Technological Advancements and Smart Features

The integration of smart features — including Bluetooth and Wi-Fi connectivity, cloud-based data logging, GPS-tagged measurement records, AI-assisted color matching, and smartphone-app interfaces — is transforming portable colorimeters from standalone measurement tools into nodes within enterprise data ecosystems [14]. These capabilities address long-standing end-user pain points around data traceability, audit compliance, and fleet management of field instruments. The LED-based technology segment's 8.46% CAGR reflects, in part, the alignment between solid-state illumination architectures and digital-integration requirements. Manufacturers such as Shenzhen Linshang Technology, Hach, and Konica Minolta are actively investing in next-generation platforms with embedded spectral engines, multi-angle measurement geometry, and machine-learning color-prediction algorithms. This technology-driven opportunity has the potential to expand the addressable market by attracting new user categories — including precision agriculture, autonomous manufacturing, and remote environmental sensing — that were previously unserved by conventional colorimeter form factors [15].

Portable Colorimeter Market Future Outlook

Technology and Product Evolution Trajectory

Over the next ten years, portable colorimeters will develop into multifunctional analytical platforms from single-parameter measurement instruments. Sub-millimeter device form factors with spectral resolutions formerly exclusive to laboratory-grade spectrophotometers will be made possible by developments in solid-state detector arrays, MEMS-based optical components, and micro-spectrometer chip fabrication. It is anticipated that LED-based technology, which is now expanding at a compound annual growth rate of 8.46%, will converge with edge computing chipsets and AI-powered color-matching algorithms to enable autonomous color grading at the point of measurement without cloud connectivity. The majority of new portable colorimeter models are expected to have integrated multi-parameter capability (color, turbidity, and fluorescence) on a single handheld platform by 2030. This will support the market's trajectory toward the USD 906.62 billion target by 2035 and expand the addressable use-case universe.

Competitive Dynamics and Market Structure Evolution

The competitive landscape is moderately consolidated, with the top four players — Hach, Konica Minolta Sensing Americas, Merck KGaA, and YSI — collectively holding an estimated 50–55% revenue share. Over the forecast period, competitive dynamics are expected to shift as Chinese and Southeast Asian manufacturers — including Shenzhen Threenh Technology, Shenzhen Linshang Technology, and Biobase Group — expand their international presence through cost-competitive offerings and aggressive OEM partnerships. Mergers, acquisitions, and technology-licensing agreements are anticipated to intensify as established players seek to integrate smart-connectivity capabilities and cloud-platform ecosystems that differentiate their offerings from commoditizing hardware. By the early 2030s, the market is expected to bifurcate into a premium tier (connected, AI-enabled, multi-parameter platforms) commanding higher margins and a value tier (single-parameter, offline devices) serving cost-sensitive emerging-economy segments.

Regulatory and Sustainability-Driven Shifts

Regulatory tailwinds will remain a primary demand catalyst through 2035 as governments worldwide strengthen environmental-protection legislation and food-safety enforcement. The European Green Deal's zero-pollution ambition, the U.S. EPA's anticipated tightening of PFAS and emerging-contaminant monitoring requirements, and China's evolving Environmental Protection Law all mandate field-level water-quality and effluent-color testing that favors portable instrumentation. Concurrently, corporate sustainability commitments under ESG frameworks are driving industrial end users to invest in on-site environmental monitoring capabilities that demonstrate compliance and reduce reliance on third-party laboratory services. These regulatory and sustainability shifts are expected to sustain the pharmaceutical-and-healthcare segment's 9.97% CAGR and the environmental-monitoring segment's stable demand trajectory through the forecast period.

Long-Range Demand Scenario

Under MRFR's base-case scenario, the market reaches USD 906,624.55 million by 2035, with Asia-Pacific accounting for the largest regional share at an estimated USD 157,433.98 million in 2025, growing to approximately USD 328,000 million by 2035. The upside scenario — driven by faster-than-expected smart-feature adoption, expanded regulatory mandates, and accelerated emerging-economy industrialization — suggests a potential CAGR uplift of 50–80 basis points, while the downside scenario — incorporating sustained macroeconomic headwinds, supply-chain disruptions, and delayed regulatory implementation — points to a 6.0% CAGR floor. The structural demand fundamentals — growing global emphasis on water quality, food safety, pharmaceutical process control, and environmental protection — provide a robust floor for sustained market expansion irrespective of near-term cyclical volatility.

Portable Colorimeter Market Segmentation

Dimension Sub-Segments Dominant Segment (2025) Fastest Growing Segment
Technology Spectrophotometric, Tristimulus, LED-Based, Photoelectric Spectrophotometric (USD 209,518.63 Mn) LED-Based (8.46% CAGR)
Connectivity Standalone Portable Colorimeters,Connected/Smart Portable Colorimeters Standalone Portable Colorimeters in 2025 (USD 760.0 MN) Connected/Smart Portable Colorimeters (7.1 % CAGR
End-User Water & Wastewater, Chemical & Petrochemical, Food & Beverage, Pharmaceutical & Healthcare, Environmental Monitoring, Others Water & Wastewater Treatment (USD 132,971.28 Mn) Pharmaceutical & Healthcare (9.97% CAGR)
Region North America, Europe, Asia-Pacific, South America, Middle East & Africa North America (USD 137,246.20 Mn) Asia-Pacific (8.05% CAGR)


By Technology

Segment 2025 (USD Mn) 2035 (USD Mn) CAGR (2026–2035) Primary Demand Driver
Spectrophotometric 209,518.63 N/A 5.81% Broad wavelength versatility; legacy installed base
Tristimulus Colorimetry 184,120.93 N/A 7.03% Cost-effective mid-tier alternative
LED-Based 42,929.29 N/A 8.46% Energy efficiency; emerging-economy deployments
Photoelectric 35,798.02 N/A 6.30% Niche industrial and specialty applications
Total 472,366.88 906,624.55 6.60%


The technology segmentation reveals a market in transition. Spectrophotometric platforms remain dominant at USD 209,518.63 million in 2025 due to their established role in laboratory-grade field applications across water treatment, pharmaceuticals, and chemical processing. However, the tristimulus colorimetry segment (USD 184,120.93 million, 7.03% CAGR) is narrowing the gap as manufacturers develop higher-accuracy tristimulus sensors at competitive price points. The LED-based segment, though the smallest in absolute terms at USD 42,929.29 million, represents the frontier of growth at 8.46% CAGR, driven by solid-state illumination's inherent advantages in power consumption, longevity, and thermal stability — attributes that are particularly valued in field deployments across tropical and resource-constrained environments.

By End-User

Segment 2025 (USD Mn) 2035 (USD Mn) CAGR (2026–2035) Primary Demand Driver
Water & Wastewater Treatment 132,971.28 N/A 4.02% Regulatory mandates; municipal infrastructure
Chemical & Petrochemical 113,093.49 N/A 6.52% Process-control quality assurance
Food & Beverage 84,843.00 N/A 7.30% Food-safety standards; consumer expectations
Pharmaceutical & Healthcare 80,253.16 N/A 9.97% GMP compliance; biopharma capacity expansion
Environmental Monitoring 33,254.63 N/A 5.81% Ecological surveys; regulatory compliance
Others 27,951.33 N/A 4.99% Academic, research, and specialty applications
Total 472,366.88 906,624.55 6.60%


End-user segmentation highlights the water-and-wastewater-treatment sector as the largest demand vertical at USD 132,971.28 million in 2025, anchored by regulatory compliance requirements in developed markets and expanding municipal water-treatment infrastructure in emerging economies. The pharmaceutical-and-healthcare segment, though fourth-largest by 2025 revenue, is the standout growth story at 9.97% CAGR, driven by the global biopharmaceutical industry's rapid capacity expansion and increasingly stringent GMP compliance requirements for color-based intermediate and finished-product testing. The food-and-beverage segment (7.30% CAGR) reflects the dual pressures of tightening international food-safety standards and rising consumer demand for product consistency, particularly in dairy, beverage, and processed-food categories.

By Region

Region 2025 (USD Mn) 2035 (USD Mn) CAGR (2026–2035) Primary Demand Driver
North America 137,246.20 N/A 4.99% EPA, FDA regulatory frameworks
Europe 123,211.00 N/A 6.10% Green Deal; Water Framework Directive
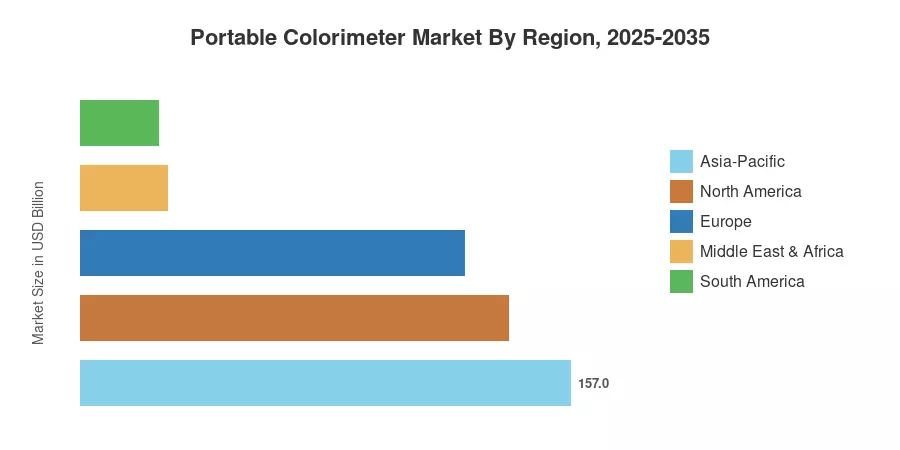
Asia-Pacific 157,433.98 N/A 8.05% Industrialization; food-safety mandates
South America 25,862.09 N/A 7.75% Mining; agri-processing modernization
Middle East & Africa 28,613.62 N/A 6.17% Desalination; O&G process control
Total 472,366.88 906,624.55 6.60%


Regional segmentation analysis confirms that Asia-Pacific overtook North America as the largest regional market by 2025 at USD 157,433.98 million, and its 8.05% CAGR ensures it will extend this lead through 2035. North America's market maturity is reflected in its comparatively lower 4.99% CAGR, though its USD 137,246.20 million base ensures it remains a critical revenue anchor for established OEMs. South America (7.75% CAGR) and MEA (6.17% CAGR) represent high-growth emerging opportunities with relatively smaller absolute bases, where early-mover advantages in distribution and service infrastructure will be competitively significant.

Regional Market Share Analysis

Region 2025 Market (USD Mn) CAGR (2026–2035) Primary Investment Themes
North America 137,246.20 4.99% Regulatory compliance, water infrastructure, pharma QC
Europe 123,211.00 6.10% Environmental policy, industrial quality, sustainability
Asia-Pacific 157,433.98 8.05% Industrialization, food safety, environmental monitoring
South America 25,862.09 7.75% Mining, agri-processing, municipal water quality
Middle East & Africa 28,613.62 6.17% Water scarcity, oil & gas, infrastructure development
Total 472,366.88 6.60%


North America

Country 2025 Market (USD Mn) CAGR (2026–2035) Key Driver
United States 120,021.80 4.77% EPA water standards, FDA pharmaceutical compliance
Canada 17,224.40 6.36% Mining sector testing, freshwater monitoring
North America Total 137,246.20 4.99%


North America dominates the global portable colorimeter market with a 2025 valuation of USD 137,246.20 million, representing approximately 29.1% of the global market. The United States accounts for the overwhelming share at USD 120,021.80 million, driven by stringent regulatory frameworks including the U.S. EPA Safe Drinking Water Act, Clean Water Act Section 304(a) water-quality criteria, and FDA 21 CFR Part 211 pharmaceutical GMP requirements. Canada's faster CAGR of 6.36% versus the U.S. at 4.77% reflects accelerating demand from the mining sector's environmental compliance requirements and expanding freshwater monitoring programs across northern provinces. Market maturity in the region results in a lower overall CAGR relative to emerging regions, though replacement-cycle demand and smart-feature upgrades sustain positive growth.

Europe

Country 2025 Market (USD Mn) CAGR (2026–2035) Key Driver
Germany 26,507.31 5.25% Industrial QC, automotive coatings testing
United Kingdom 18,629.66 5.27% Water-utility regulation, pharma R&D
France 18,761.65 3.97% Food-safety compliance, cosmetics industry
Italy 15,988.17 8.10% Textile and ceramics color measurement
Spain 12,356.52 7.74% Agri-food sector modernization
Belgium 3,941.21 5.92% Chemical and petrochemical QC
Rest of Europe 27,026.49 6.67% Diversified industrial and environmental demand
Europe Total 123,211.00 6.10%


Europe represents the second-largest regional market at USD 123,211.00 million in 2025 with a 6.10% CAGR through 2035. Germany leads the region at USD 26,507.31 million, supported by its large automotive, chemical, and industrial-manufacturing base where color consistency is a critical quality parameter. Italy (8.10% CAGR) and Spain (7.74% CAGR) are the fastest-growing European markets, reflecting rising investment in textile, ceramics, and agri-food quality infrastructure. The European Union's Green Deal and Water Framework Directive are anticipated to sustain regulatory-driven demand for portable environmental monitoring instruments, while the EU Pharmaceutical Strategy for Europe is expected to reinforce demand for portable QC instruments across the continent's biopharmaceutical manufacturing corridor.

Asia-Pacific

Country 2025 Market (USD Mn) CAGR (2026–2035) Key Driver
China 25,701.10 5.34% Industrial manufacturing, environmental enforcement
Japan 27,039.29 8.44% Advanced manufacturing, R&D instrumentation
India 6,297.36 8.05% Food-safety regulation (FSSAI), pharma expansion
South Korea 3,178.20 8.22% Electronics and semiconductor color QC
Australia 3,184.10 8.25% Mining and water-quality monitoring
Thailand 9,544.43 7.00% Food-processing and agri-export QC
Indonesia 12,370.37 9.66% Rapid industrialization, expanding testing infrastructure
Rest of APAC 70,119.13 8.58% Broad-based industrial and environmental demand
Asia-Pacific Total 157,433.98 8.05%


Asia-Pacific is the fastest-growing and, by 2025, the largest regional market at USD 157,433.98 million, surpassing North America on the strength of rapidly expanding industrial bases and government-mandated environmental and food-safety programs. Japan leads APAC country markets at USD 27,039.29 million with an 8.44% CAGR, driven by its advanced manufacturing sector's exacting color-consistency requirements. Indonesia registers the fastest country-level CAGR at 9.66%, reflecting early-stage market penetration as the nation's manufacturing, food-processing, and environmental-monitoring sectors formalize quality infrastructure. India's 8.05% CAGR is supported by the Food Safety and Standards Authority of India's (FSSAI) expanding testing mandates and the pharmaceutical industry's rapid capacity expansion. China, while commanding the second-largest APAC country market at USD 25,701.10 million, grows at a comparatively moderate 5.34% CAGR as market maturation tempers the adoption curve.

South America

Country 2025 Market (USD Mn) CAGR (2026–2035) Key Driver
Brazil 8,198.82 6.03% Agri-food exports, water utility modernization
Argentina 7,971.02 9.11% Mining, industrial diversification
Colombia 3,927.71 6.32% Oil & gas water-quality testing
Rest of South America 5,764.54 8.84% Diversified emerging-economy demand
South America Total 25,862.09 7.75%


South America's portable colorimeter market is valued at USD 25,862.09 million in 2025 and expands at a robust 7.75% CAGR through 2035. Argentina is the fastest-growing country market at 9.11% CAGR, driven by mining-sector environmental compliance and a policy push to diversify the industrial base beyond agriculture. Brazil, the region's largest market at USD 8,198.82 million, benefits from the agri-food export sector's requirement for internationally recognized quality-testing protocols and municipal water-utility modernization programs funded by inter-American development financing. The Rest of South America category (8.84% CAGR) reflects early-stage adoption in Chile, Peru, and Ecuador where mining and aquaculture industries are formalizing portable-testing capabilities.

Middle East & Africa

Country / Sub-Region 2025 Market (USD Mn) CAGR (2026–2035) Key Driver
GCC Countries 21,321.80 5.69% Oil & gas process control, desalination
South Africa 1,127.88 6.79% Mining, municipal water quality
Rest of MEA 6,163.95 7.58% Infrastructure investment, environmental monitoring
MEA Total 28,613.62 6.17%


The Middle East & Africa market totals USD 28,613.62 million in 2025 with a 6.17% CAGR. GCC countries dominate at USD 21,321.80 million, where demand is shaped by oil-and-gas downstream process-control requirements and the region's large-scale desalination infrastructure, which requires continuous water-quality monitoring at multiple treatment stages. The Rest of MEA sub-region grows fastest at 7.58% CAGR as Sub-Saharan African nations invest in water-quality testing infrastructure supported by World Bank and African Development Bank financing programs. South Africa's 6.79% CAGR reflects the mining industry's environmental-monitoring obligations and urban water-quality compliance requirements.

Portable Colorimeter Market By Region, 2025-2035

Competitive Benchmarking

The global portable colorimeter market exhibits a moderately fragmented competitive structure, with the top ten profiled companies collectively commanding an estimated 90–93% of the addressable market. The Herfindahl-Hirschman Index (HHI) is estimated in the 1,000–1,500 range, indicating moderate concentration with no single dominant player capable of exercising unilateral pricing power. Competition centers on product performance (accuracy, repeatability, spectral range), portability (weight, battery life, IP rating), connectivity (Bluetooth, Wi-Fi, cloud integration), and regional distribution breadth.

Company Est. Revenue Share Key Offerings Strategic Positioning
Hach ~18% DR Series portable colorimeters, reagent kits Market leader in water-quality portable testing; strong regulatory alignment
Konica Minolta Sensing Americas Inc ~14% CR-Series, CM-Series spectrophotometric colorimeters Premium precision instruments for industrial and coatings applications
Merck KGaA ~12% Spectroquant portable photometers, test kits Integrated reagent-and-instrument ecosystem; pharma and water QC
YSI Inc. ~10% Multiparameter water-quality instruments Environmental monitoring specialist; strong field-services network
Hanna Equipment (India) Pvt. Ltd. ~9% HI-Series portable photometers Cost-competitive solutions for emerging-market water and food testing
LaMotte ~8% Smart Colorimeter, WaterLink series Education, pool/spa, and municipal water testing
Biobase Group ~7% Portable spectrophotometers, lab instruments Value-tier manufacturer with growing APAC distribution
Shenzhen Threenh Technology Co., Ltd ~6% NH-Series, NR-Series color measurement Specialized color-matching for plastics, coatings, and textiles
Shenzhen Linshang Technology Co., Ltd. ~5% LS-Series colorimeters, haze meters Precision measurement for coatings, films, and industrial materials
Aqualytic Laboratories Limited ~4% AL-Series portable photometers Niche water-quality testing; strong in MEA and European markets
Other Market Players ~7% Various Regional and specialty manufacturers


Recent News & Developments

Shenzhen Linshang Technology Co., Ltd. (April 2025):

In April 2025, Shenzhen Linshang Technology Co., Ltd. participated in the 38th China International Plastics & Rubber Industry Exhibition held in Shanghai, one of Asia's premier industrial trade events attracting over 3,000 exhibitors and 200,000 visitors annually. At the exhibition, Linshang Technology showcased its latest portfolio of colorimeters, haze meters, and thickness gauges, demonstrating advanced precision-measurement capabilities tailored for plastics, coatings, and industrial-material testing applications. This participation underscored the company's strategic commitment to expanding its visibility within the Chinese and broader Asian industrial-measurement market, where demand for portable color and optical-property testing instruments is growing at an 8.05% regional CAGR. The exhibition provided Linshang with an opportunity to engage directly with OEM plastics processors, coatings manufacturers, and quality-control laboratory managers — key procurement decision-makers in the portable colorimeter value chain. The company's emphasis on smart-feature integration, including app-based data management and multi-angle measurement geometry, positions it to capture incremental share in the LED-based and tristimulus technology segments.

Portable Colorimeter Market Report Scope

Parameter Detail
Market Scope Global Portable Colorimeter Market
Study Period 2019–2035
CAGR Window 2026–2035
Base Year 2025
Market Size (2025) USD 472.37 Billion
Market Size (2035) USD 906.62 Billion
CAGR 6.60%
Fastest Growing Region Asia-Pacific (8.05% CAGR)
Dominant Region North America (USD 137,246.20 Mn in 2025)
Fastest Growing Technology Segment LED-Based (8.46% CAGR)
Fastest Growing End-User Segment Pharmaceutical & Healthcare (9.97% CAGR)
Companies Profiled Hach, Konica Minolta Sensing Americas Inc, Hanna Equipment (India) Pvt. Ltd., YSI Inc., Shenzhen Threenh Technology Co. Ltd, Biobase Group, Shenzhen Linshang Technology Co. Ltd., LaMotte, Aqualytic Laboratories Limited, Merck KGaA
Valuation Currency USD (Million / Billion)
Segments Covered By Technology (Spectrophotometric, Tristimulus, LED-Based, Photoelectric), By End-User (Water & Wastewater Treatment, Chemical & Petrochemical, Food & Beverage, Pharmaceutical & Healthcare, Environmental Monitoring, Others), By Region (North America, Europe, Asia-Pacific, South America, Middle East & Africa)

FAQs

What is the projected size of the global portable colorimeter market by 2035?
The global portable colorimeter market is projected to reach USD 906,624.55 million (approximately USD 906.62 billion) by 2035, growing from USD 472,366.88 million in 2025 at a compound annual growth rate of 6.60% during the 2026–2035 forecast period [1]. This growth trajectory is supported by structural demand drivers including rising regulatory compliance mandates, expanding industrial capacity in emerging economies, and accelerating adoption of portable analytical devices across water treatment, food safety, and pharmaceutical applications.
Which technology segment is growing fastest in the portable colorimeter market?
LED-based colorimetry is the fastest-growing technology segment with a CAGR of 8.46% through 2035. LED-based systems benefit from superior energy efficiency, lower maintenance costs, and enhanced thermal stability compared to conventional lamp-based architectures [5]. These advantages make them particularly attractive for field deployments in emerging-economy environments where power infrastructure and service networks may be limited.

Why is Asia-Pacific the fastest-growing regional market?
Asia-Pacific registers the highest regional CAGR at 8.05%, driven by rapid industrialization across China, India, Japan, Indonesia, and Southeast Asia; expanding food-safety regulatory frameworks; and growing government investment in environmental monitoring infrastructure [7][8]. Indonesia (9.66% CAGR) and Japan (8.44% CAGR) lead country-level growth within the region, supported by manufacturing-sector expansion and advanced instrumentation demand, respectively.
Which end-user segment presents the strongest growth opportunity?
The pharmaceutical-and-healthcare segment offers the strongest growth opportunity at 9.97% CAGR through 2035, outpacing all other end-user verticals [4]. This growth is driven by the global biopharmaceutical industry's rapid capacity expansion, tightening GMP compliance requirements for color-based quality testing of pharmaceutical intermediates and finished products, and increasing adoption of portable instruments for point-of-manufacturing quality assurance.
How does North America maintain its dominant market position?
North America commands a 2025 market value of USD 137,246.20 million, anchored by the United States' stringent regulatory environment — including EPA water-quality monitoring mandates and FDA pharmaceutical GMP requirements — and its mature laboratory and field-testing infrastructure [3]. While the region's 4.99% CAGR reflects market maturity, replacement-cycle demand, smart-feature upgrades, and expanding PFAS and emerging-contaminant testing requirements sustain positive growth through 2035.
What competitive strategies differentiate leading portable colorimeter manufacturers?
Leading manufacturers differentiate through a combination of product performance (spectral accuracy, repeatability, measurement geometry), integrated reagent-and-instrument ecosystems (Merck KGaA, Hach), regional distribution breadth (Hanna Equipment, Biobase Group), and smart-feature integration (Shenzhen Linshang Technology, Konica Minolta) [6][14]. The competitive landscape is moderately fragmented with an estimated HHI of 1,000–1,500, and is expected to consolidate selectively through technology-licensing agreements and strategic acquisitions as the market bifurcates into premium connected platforms and value-tier commodity instruments.
What role do regulatory frameworks play in market growth?
Regulatory frameworks are among the most significant structural demand drivers, accounting for an estimated 35% of the market's CAGR contribution. Key regulatory catalysts include the U.S. EPA Clean Water Act, EU Water Framework Directive, FDA cGMP requirements, FSSAI food-safety mandates in India, and emerging-contaminant monitoring standards globally [3][4][7]. Regulatory harmonization across international trade zones is expected to amplify cross-border demand for standardized portable colorimetric testing instruments through 2035.                              
Author
Author
Author Profile
Vikita Thakur LinkedIn
Senior Research Analyst
She holds an experience of about 5+ years in market research and business consulting projects for sectors such as life sciences, medical devices, and healthcare IT. She possesses a robust background in data analysis, market estimation, competitive intelligence, pipeline analysis market trend identification, and consumer behavior insights. Her expertise lies in technical Sales support, client interaction and project management, designing and implementing market research studies, conducting competitive analysis, and synthesizing complex data into actionable recommendations that drive business growth.
Co-Author
Co-Author Profile
Satyendra Maurya LinkedIn
Research Analyst
An accomplished research analyst with high proficiency in market forecasting, data visualization, competitive benchmarking, and others. He holds a pronounced track record in research and consulting projects for sectors such as life sciences, medical devices, and healthcare IT. His capabilities in qualitative and quantitative analysis have resulted in positive client outcomes. Working on niche market trends, opportunities, sales, and forecasted value is part of his skill set.
Share::
Request Free Sample
Download Free Sample

Kindly complete the form below to receive a free sample of this Report

* Please use a valid business email

Share::
Request Free Sample
Download PDF ×

We do not share your information with anyone. However, we may send you emails based on your report interest from time to time. You may contact us at any time to opt-out.












